
ABSTRACT
Apart from the conventional view of repressive promoter methylation, the DNA methyltransferase 1 (DNMT1) was recently described to modulate gene expression through a variety of interactions with diverse epigenetic key players. We here investigated the DNMT1-dependent transcriptional control of the homeobox transcription factor LHX1, which we previously identified as an important regulator in cortical interneuron development. We found that LHX1 expression in embryonic interneurons originating in the embryonic pre-optic area (POA) is regulated by non-canonic DNMT1 function. Analysis of histone methylation and acetylation revealed that both epigenetic modifications seem to be implicated in the control of Lhx1 gene activity and that DNMT1 contributes to their proper establishment. This study sheds further light on the regulatory network of cortical interneuron development including the complex interplay of epigenetic mechanisms.
Introduction
An increasing number of studies challenged the textbook model of repressive DNA methylation that is catalysed by DNA methyltransferases (DNMTs). The identification of the diverse genomic locations that can be methylated like enhancer and intragenic loci in addition to promoter regions has led to new findings for functional implications of DNA methylation like alternative splicing and promoter choice [Citation1–3]. Moreover, in contrast to the traditional view of DNA methylation preventing the binding of transcription factors, numerous reports indicated that DNA methylation signatures can even serve as binding motifs for particular factors, thereby mediating methylation-dependent biological processes [Citation4]. Apart from this, DNA methylation can instruct histone-modifying complexes (HMCs) and vice versa [Citation5–8]. In addition, DNMTs act on histone modifications by transcriptional control over genes encoding for proteins implicated in HMCs or by interacting with protein complexes independent of their DNA methylating activity [Citation9–12]. This diversity of actions requires detailed investigations to decipher the functional implications of distinct epigenetic mechanisms in directing cell- and stage-specific differentiation and maturation programmes, and to reveal causes for dysfunctions in related diseases.
Alterations in epigenetic signatures or the function of epigenetic key players in neurons were reported to contribute to the pathophysiology of diverse neurological diseases and psychiatric disorders [Citation13,Citation14]. Changed Dnmt1 expression was observed post-mortem in inhibitory cortical interneurons of schizophrenia patients, which is suggested to be associated with altered expression of GABA-related transcripts [Citation15,Citation16]. By shaping the response of excitatory neurons through inhibitory actions, GABAergic interneurons are essential key players in cortical information processing. For this, it is not surprising that numerous neuropsychiatric diseases like schizophrenia, epilepsy, and autism involve defects in GABAergic interneuron function [Citation17–20], which are suggested to be in part developmental in their origin [Citation18–20]. In support of this, prenatal stress alters DNA methylation networks in inhibitory cortical interneurons during development, which elicits a schizophrenia-like phenotype in offspring [Citation21–23]. However, little is known so far about the stage- and context-specific effects of epigenetic transcriptional regulation during cortical interneuron development, which is a highly complex process [Citation24]. A major step embraces the long-range migration of post-mitotic interneurons from their sites of origin in the basal telencephalon towards cortical target areas [Citation24–27]. This requires comprehensive control over cytoskeletal remodelling to achieve successful migration, prerequisite for the correct number of cortical interneurons in the diverse cortical regions [Citation26–28]. The strict regulation of cell survival during the different developmental steps is likewise critical for proper interneuron numbers in adults [Citation26,Citation27,Citation29].
We have recently reported that the DNA methyltransferase 1 (DNMT1) orchestrates the post-mitotic maturation of POA-derived cortical interneurons by promoting their migratory morphology and survival in part through the modulation of Pak6 expression [Citation27]. Of note, we found that Pak6 transcription is not regulated by DNMT1-dependent DNA methylation [Citation12,Citation27], but non-canonically through interactions of DNMT1 with histone methylating enzymes [Citation12].
Apart from DNMT1, we identified the LIM-homeobox transcription factor LHX1 as crucial transcriptional regulator of POA-derived inhibitory interneuron development [Citation26]. LHX1 modulates the expression of major guidance receptors in migrating interneurons facilitating their tangential and radial migration through the basal telencephalon and the developing cortex, respectively [Citation26]. Alike DNMT1, LHX1 acts on interneuron survival by controlling gene expression of genes like Bcl2 or Bcl6 [Citation26]. Thereby, the expression of Lhx1 is restricted to early post-mitotic stages and timed Lhx1 silencing is critical for the proper regulation of interneuron survival and migration during development [Citation26]. To this end, we here investigated whether and how Lhx1 expression is controlled by DNMT1 as a potential upstream regulator.
We identified Lhx1 expression to be controlled by non-canonical DNMT1 activity. Besides evidence for a DNMT1-dependent bivalent regulation through H3K4 and H3K27 trimethylation, our data propose a contribution of DNMT1-mediated histone acetylation and deacetylation to the regulation of Lhx1 expression. This study emphasizes the complexity of epigenetic networks in transcriptional control of key players relevant for cortical interneuron development.
Results
DNMT1 regulates the expression of Lhx1 non-canonically
In the embryonic mouse brain, Lhx1 is very restrictively expressed in the mantle zone of the embryonic POA, partially overlapping with the local and post-mitotic expression of the transcription factor HMX3 () [Citation26]). We have previously shown that LHX1-dependent transcriptional control is of great relevance for the survival and migration regulation in post-mitotic HMX3-positive cortical interneurons originating in the POA [Citation26]. For this immature interneuron subset, we further identified DNMT1 to be essential for orchestrating stage-specific gene expression [Citation27]. Hence, in this study, we first aimed to investigate whether DNMT1 controls the expression of Lhx1.
Figure 1. Lhx1 transcription is controlled by DNMT1, but not through its DNA methylation activity
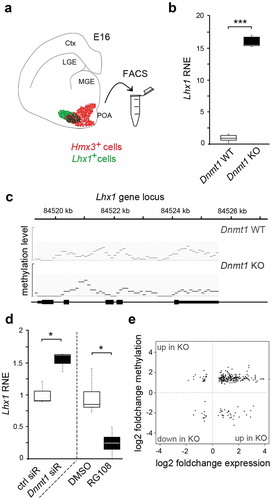
To this end, we checked for changes in the expression levels of Lhx1 in FACS-enriched Hmx3-Cre/tdTomato/Dnmt1 control and Hmx3-Cre/tdTomato/Dnmt1 interneurons isolated from the POA of mouse embryos at embryonic day (E) 16, at the peak of POA interneuron migration ()). Indeed, we detected a highly elevated Lhx1 expression in Dnmt1 knockout (KO) cells, which points to a DNMT1-mediated repression of Lhx1 in wild-type interneurons ()).
To control whether these transcriptional changes correlate with alterations in DNA methylation levels, we screened the MeDIP-sequencing data performed with equally aged embryonic FACS-enriched control and Dnmt1 KO cells (E16), published previously in Pensold et al. [Citation27]. However, the Lhx1 gene locus did not show any significant alterations in the DNA methylation levels between the two genotypes ()). Apart from this, the RNA-sequencing and MeDIP-sequencing dataset of FACS-enriched Dnmt1 KO and control cells (E16) [Citation27] did not reveal altered methylation and expression levels of potential regulators of Lhx1 in Dnmt1-deficient interneurons. In agreement with the expression and DNA methylation analysis of POA-derived embryonic interneurons, elevated levels of Lhx1 expression were also detected upon Dnmt1 siRNA application in Neuro2a (N2a) cells, a cell culture model already applied in a previous study [Citation12]. Of note, this increase in Lhx1 expression was not observed upon treatment with RG108, an inhibitor of DNA methylation ()), which even leads to a significant decrease putatively by eliciting secondary effects. Together, our data suggest a DNA methylation-independent repression of Lhx1 by DNMT1.
In general, direct effects of repressive DNMT1-dependent DNA methylation appear to play a rather subordinate role during embryonic development of POA-derived interneurons. First, by MeDIP and RNA sequencing we identified a non-significant overlap of genes displaying both, changes in the methylation and expression profiles in Dnmt1-deficient Hmx3-Cre/tdTomato compared to control cells [Citation12]. Second, among the overlapping genes, we identified only very few genes displaying reduced DNA methylation and increased expression in the Dnmt1-deficient cells (), lower right quadrant), which would be consistent with the canonical function of DNMT1 performing repressive DNA methylation in controls. In turn, most genes were elevated in expression and displayed at the same time increased levels of DNA methylation (), upper right quadrant), pointing to secondary or indirect effects caused by Dnmt1 deletion. This is consistent with the emerging new functional implications of DNA methylation being far more complex than just leading to gene repression. DNA methylation is described to mediate alternative splicing and promoter choice [Citation1–3] and can even lead to the formation of binding motifs for particular factors that upon binding drive the transcription of particular genes [Citation4].
In sum, our data so far suggest that DNMT1 exerts transcriptional control over Lhx1 in embryonic POA-derived interneurons, but rather independent of direct DNA methylation of the Lhx1 gene locus or gene loci encoding for known Lhx1 regulators.
Dnmt1 deficiency resulted in altered H3K4me3 and H3K27me3 levels at the Lhx1 gene locus
In addition to its DNA methylating activity, we have recently reported that non-canonical functions of DNMT1, such as a crosstalk with histone-modifying enzymes, are involved in the transcriptional regulation in developing interneurons [Citation12]. In detail, Pak6 expression was found to be controlled through direct or indirect interactions of DNMT1 with EZH2, the core enzyme of the polycomb-repressor complex 2 (PRC2), catalysing repressive trimethylations at H3K27 [Citation30,Citation31].
To evaluate a potential implication of DNMT1-dependent modulation of repressive histone methylation in the transcriptional control of Lhx1, we analysed Lhx1 expression in N2a cells upon treatment with 3-deazaneplanocin A (DZNep, )), a potent inhibitor of the histone methyltransferase EZH2 [Citation32,Citation33]. We detected significantly elevated Lhx1 expression levels in DZNep-treated N2a cells ()), suggesting a role of histone methylation in repressing Lhx1 transcription. As LHX1 was shown to influence POA cell migration [Citation26], we next analysed whether DZNep-treatment affects the migratory potential of N2a cells. To this end, we monitored the migratory speed of N2a cells on matrigel, which was significantly decreased upon DZNep-treatment compared to control treatment with DMSO (–d)). In line with that, we found DZNep-induced morphological alterations which could account for the reduced motility. By comparing the morphology of DZNep- and control-treated POA and N2a cells, we detected increased numbers of processes as well as higher numbers of branch points of the longest process of each cell (–g)), which is indicative for the loss of the polarized migratory morphology.
Figure 2. DNMT1-dependent modulation of repressive and permissive histone lysine trimethylation contributes to Lhx1 expression control
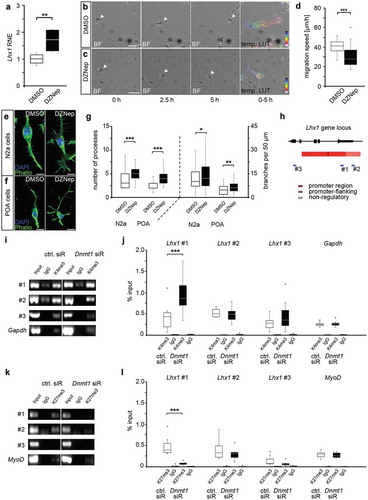
We previously showed that DNMT1 negatively acts on permissive H3K4me3 levels and promotes the establishment of repressive trimethylation of H3K27 at the global level [Citation12]. Here we investigated whether DNMT1 is required to prevent or promote the setup of permissive H3K4- or repressive H3K27-trimethylation marks at regulatory sites of the Lhx1 gene locus, respectively. For this we performed targeted chromatin-immunoprecipitation (ChIP) with an H3K4me3- and an H3K27me3-specific antibody followed by qPCR with primers directed against regulatory and non-regulatory regions of the Lhx1 locus in control and Dnmt1 siRNA-treated N2a cells (–l)). Compared to controls, we identified an enhanced association of H3K4me3 within the promoter region of the Lhx1 gene locus in Dnmt1-depleted compared to control cells, whereas promoter-flanking and non-regulatory regions did not reveal detectable changes (–j)). As Gapdh is often associated with H3K4me3 in neurons [Citation34,Citation35], it was used as a positive control. This suggests that DNMT1 negatively influences the establishment of permissive H3K4me3 marks at the Lhx1 promoter region.
Many promoters are bivalently regulated by H3K4me3 and H3K27me3 [Citation36–41], and we already showed a DNMT1-dependent establishment of H3K27me3 signatures in immature POA-derived interneurons and neuron-like N2a cells [Citation12]. Consistent with the global reduction of H3K27me3 found upon Dnmt1 depletion [Citation12], H3K27me3 association was significantly diminished site-specifically at the promoter region of the Lhx1 gene locus, which also displayed increased H3K4-trimethylation marks (, k, l)). As a positive control, we included MyoD as muscle-specific gene, which is usually marked by repressive H3K27 trimethylation in neurons [Citation42]. Together, the targeted ChIP experiments presented here suggest that DNMT1 regulates Lhx1 expression by promoting the establishment of repressive H3K27me3 and the removal of permissive H3K4me3 signatures at regulatory Lhx1 gene regions. This is in part reminiscent to what we found for the DNMT1-dependent regulation of Pak6 expression, which is mediated by the concerted action of DNMT1 and EZH2, the core enzyme of the PRC2, promoting the setup of repressive H3K27me3 marks in regulatory regions of the Pak6 locus [Citation12].
DNMT1-mediated alterations in histone acetylation contribute to the modulation of Lhx1 expression
Besides affecting H3K27 and H3K4 trimethylation [Citation5–8,Citation12], DNMT1 was further reported to act on histone acetylation, which leads to open chromatin [Citation43,Citation44]. In line with this, we detected significantly increased H3K9/K14/K18/K23/K27 acetylation levels in Dnmt1 siRNA-treated N2a cells compared to controls by performing immunocytochemistry with a pan-specific antibody (–c)). This indicates that DNMT1 can also modulate transcription by negatively acting on permissive histone acetylation marks. The following set of experiments was designed to address whether the DNMT1-mediated modulation of histone acetylation contributes to the transcriptional regulation of Lhx1 as well as its cellular effects.
Figure 3. Lhx1 transcription is modulated by DNMT1-dependent histone acetylation and deacetylation processes
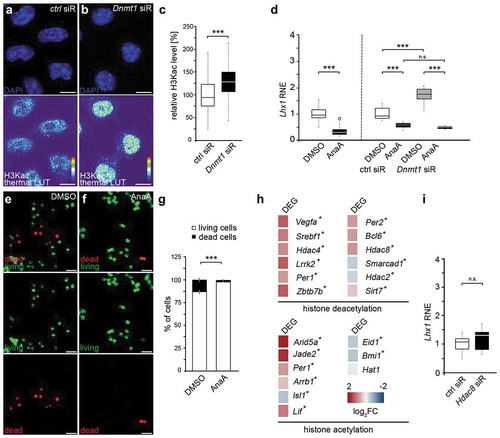
First, we examined whether histone acetylation affects Lhx1 expression by treating N2a cells with the histone acetyltransferase inhibitor anacardic acid, causing global histone deacetylation [Citation45,Citation46]. Inhibiting histone acetylation resulted in significantly decreased Lhx1 expression levels compared to DMSO control treatment (), left side of the diagram). To investigate whether DNMT1 controls Lhx1 expression by modulating histone acetylation, we determined whether the elevated Lhx1 expression levels seen upon Dnmt1 siRNA treatment () and )-right side of the diagram) can be reversed by concurrent application of the histone acetyltransferase inhibitor anacardic acid. Indeed, collective administration of anacardic acid together with Dnmt1 siRNA reduced the boosted Lhx1 transcription levels seen after Dnmt1 depletion to levels which were even below the Lhx1 expression levels of the control treatment (control siRNA and DMSO; )). This proposes that (i) permissive histone acetylation promotes Lhx1 expression and that (ii) DNMT1 represses Lhx1 in part by impeding the establishment of such permissive histone acetylation marks.
We have previously characterized the relevance of DNMT1 and LHX1 function for survival regulation in POA-derived cortical interneurons [Citation26,Citation27]. We identified several downstream targets of LHX1, through which cell survival in immature POA-derived cortical interneurons is controlled. We showed that LHX1 drives the expression of pro-apoptotic genes and negatively acts on the transcription of pro-survival genes [Citation26]. Hence, tight orchestration of Lhx1 expression during interneuron development is required to maintain the delicate balance of interneuron cell death and survival, and hence the control over correct interneuron numbers, for which we propose DNMT1 as up-stream repressor. As we here provided evidence that the DNMT1-mediated repression of Lhx1 is in part achieved by impeding the establishment of permissive histone acetylation marks (–d)), we next investigated whether manipulating histone acetylation affects cell survival regulation. For this, we determined cell death rates of N2a cells that were treated with the histone acetylation inhibitor anacardic acid by applying a live/dead assay. We indeed detected elevated proportions of living cells in anacardic acid-treated samples ((e–g)). This is in line with the diminished Lhx1 levels observed upon anacardic acid treatment ()), and the role of LHX1 in promoting cell death, as we previously reported [Citation26].
Our data so far indicate that DNMT1-mediated modulation of histone acetylation could contribute to Lhx1 transcriptional control with potential implications for cortical interneuron migration and survival. In support of this, numerous studies propose a DNMT1-dependent transcriptional regulation of genes encoding for histone-modifying complexes as a potential mechanism for a crosstalk of DNMT1 with histone modifications [Citation9–12]. Such transcriptional control could also affect the concerted actions of histone acetylases (HATs) and histone deacetylases (HDACs), and hence the balance of histone acetylation and deacetylation, respectively [Citation47]. Indeed, by screening the RNA sequencing dataset of FACS-enriched embryonic (E16) wild-type and Dnmt1-deficient POA cells [Citation27], we found evidence that DNMT1 regulates the expression of genes associated with histone deacetylation. In Dnmt1-deficient POA cells we observed significant changes in the expression of Hdac2, Hdac4 and Hdac8 encoding histone deacetylases ()). In addition, numerous other genes associated with histone deacetylation were changed in expression upon Dnmt1 deletion. While the expression of Hat1 encoding for a histone acetylase was not significantly altered, the expression levels from other histone acetylation-related genes like Arid5a [Citation48] and Jade2 [Citation49] were changed prominently in Dnmt1-deficient POA cells compared to controls ()). Together, these transcriptional alterations induced by Dnmt1 deletion support a role of DNMT1 in the transcriptional regulation of genes related to histone acetylation/deacetylation complexes.
HDAC8 was already described as a potent inhibitor of Lhx1 transcription in cranial neural crest cells [Citation50] and is implicated in cell survival regulation [Citation51]. However, Hdac8 expression was significantly increased in FACS-enriched Dnmt1-deficient POA cells (E16) ()). While being consistent with a repressive function of DNMT1, this does not provide a logic explanation for the elevated pan-histone acetylation induced by Dnmt1 siRNA in the N2a cell culture model, as augmented HDAC8 expression would rather be consistent with diminished histone acetylation. Moreover, Lhx1 expression levels were not changed in Hdac8 siRNA-treated N2a cells ()), indicating that HDAC8 is not affecting Lhx1 transcription in our cell culture model.
Hdac2 was the only histone deacetylase-encoding gene, which we found diminished in Dnmt1-deficient POA cells, indicating that DNMT1 directly or indirectly promotes its expression ()). HDAC2 was already reported to regulate the expression of Lhx1 [Citation52]. Hence, a DNMT1-dependent promotion of histone deacetylation by enhancing Hdac2 expression represents a potential scenario for the DNMT1-mediated transcriptional repression of Lhx1. Whereas deciphering the underlying mechanism requires further investigation, our data so far indicate that DNMT1-mediated gene expression regulation in immature interneurons could be realized via the modulation of histone acetylation in addition to the previously reported crosstalk with histone methylation.
Discussion
The development of interneurons, including their long-range migration and their subtype-specific differentiation as well as their survival, is strictly controlled by various regulatory mechanisms [Citation24]. Here we provided evidence that DNMT1 regulates the expression of the LIM homeodomain transcription factor LHX1, a relevant regulator of cortical interneuron development. Lhx1 was shown to be expressed in a proportion of POA interneurons during brain development, promoting proper migration from their subpallial origin towards cortical targets as well as controlling their survival [Citation26]. Our current data support a role of DNMT1 in executing transcriptional control over Lhx1 through DNA methylation-independent mechanisms. Apart from DNMT1-dependent modulation of H3K4 and H3K27 trimethylation, partially organized in bivalent regions, DNMT1-mediated interference with histone acetylation may contribute to the regulation of Lhx1 gene activity in interneurons and neuron-like cells.
Epigenetic mechanisms are key for neuronal development and function and are implicated in diverse neurological diseases and psychiatric disorders [Citation13,Citation14]. DNA methylation exerted by DNA methyltransferases (DNMTs) was shown to play a major role in the regulation of gene transcription and the modulation of neuronal differentiation programs [Citation53–55]. Thereby, DNA methylation was often reported to silence gene transcription by preventing the binding of transcription factors to the DNA [Citation53–55]. We recently reported that the function of DNMT1 is fundamental for the maturation of POA-derived cortical interneurons [Citation27]. Interestingly, we observed that the majority of genes in post-mitotic POA interneurons which revealed elevated expression upon Dnmt1-deletion also showed increased methylation states. This is not in line with the proposed model of repressive DNMT1-dependent DNA methylation. Recently studies added new aspects on how DNA methylation or DNMTs may contribute to the control of gene activity. These include a crosstalk with histone tail modifications or RNA silencing that concertedly contribute to the complex network of gene regulation [Citation53,Citation56]. For this reason, we asked whether the regulation of relevant DNMT1 downstream target genes depends on non-canonical DNMT1 functions. In this context, we recently showed that the expression of the gene coding for the serine/threonine-protein kinase PAK6, which regulates interneuron morphology and survival [Citation12,Citation27], is modulated by DNMT1-dependent establishment of repressive H3K27me3 marks at gene promoter sites [Citation12]. Following this line of research, we here asked, whether Lhx1 is likewise regulated by DNMT1-dependent changes in the histone code, as in contrast to Dnmt1 deletion-induced alteration in Lhx1 expression, no respective changes in the DNA methylation levels were found. Our data emphasize a bivalent regulation of Lhx1 by a DNMT1-dependent modulation of both repressive H3K27me3 and permissive H3K4me3 marks.
An interaction of DNMT1 with enzymes involved in establishing H3K27me3 marks like EZH2 as the main methyltransferase of the polycomb repressor complex 2 (PRC2), as well as a transcriptional regulation of associated genes was already reported for non-neuronal cells in different studies [Citation11,Citation57,Citation58]. We recently revealed that in POA interneurons and neuron-like N2a cells the DNMT1-dependent establishment of H3K27-trimethylation marks relies on protein–protein interactions between DNMT1 and EZH2 [Citation12]. In turn, DNMT1-dependent repression of activating H3K4me3 marks in control cells appears to be achieved via transcriptional control of relevant key players. This assumption was based on the observation that in Dnmt1-deficient Hmx3-expressing POA cells an enhanced expression of H3K4me3-associated genes was revealed [Citation12,Citation27]. However, other ways of action are likewise conceivable.
A simultaneous association of permissive H3K4me3 and repressive H3K27me3, like we and others observed for the Lhx1 promoter [Citation59–61], is typically found for many developmental genes adopting a ‘winner-takes-all’ principle [Citation36,Citation38,Citation39,Citation62] with the decision about gene transcription being defined by the proportion of these histone modifications. Such bivalent gene regulation, initially reported for the repression of lineage restricting genes in early embryogenesis (reviewed in [Citation63]), enables the repression of genes until their expression is required. Since LHX1 regulates the survival and migration of specific interneurons from the POA within a given time window [Citation26], a highly coordinated expression of this transcription factor is of great importance. A bivalent regulation of Lhx1 expression would allow for such a temporally and spatially limited expression, which seems to depend on DNMT1 function.
Besides the connection to histone methylation, DNMT1 also interacts with key enzymes relevant for histone acetylation and deacetylation [Citation43,Citation44]. Acetylated histones are highly associated with euchromatic gene regions and activated gene transcription, while histone deacetylation results in ‘closed’ heterochromatin and gene repression [Citation64,Citation65]. Histone acetylation and deacetylation processes are intimately linked to proper development and function of several cortical interneuron types and enable a dynamic change of gene accessibility [Citation66,Citation67]. The data presented here indicate a DNMT1-dependent repression of activating histone acetylation marks in immature POA interneurons, as well as a regulation of the Lhx1 expression level by the histone acetylation status. Based on this, we propose the hypothesis that DNMT1 represses Lhx1 transcription at least partly by contributing to changes in histone acetylation levels. DNMT1 has already been reported to be associated with HDAC activity, which removes histone acetylation marks to silence gene transcription. For example, Fuks et al. [Citation43] identified a specific domain in the DNMT1 protein that partially contributes to transcriptional repression by recruiting histone deacetylase activity. Apart from this, DNMT1 was also shown to directly bind HDAC2 and the co-repressor DMAP1 to form a repressive transcription complex [Citation44]. Thus, a DNMT1-dependent removal of acetyl groups from histone tails could account for Lhx1 repression in POA interneurons and N2a cells. Interestingly, an HDAC-dependent repression of Lhx1 was already shown in cranial neural crest cells for the class I histone deacetylase HDAC8 [Citation50], in which the enzyme prevents the aberrant expression of homeobox transcription factors during skull development. For the cell types investigated here, HDAC8, in turn, seems of subordinate relevance for the transcriptional control of Lhx1, as Hdac8 siRNA application had no effect on Lhx1 transcription levels. This underlines that the function of HDACs appears to be cell type specific and likely depend on cell-specific cofactors and their integration into protein complexes. Apart from that, the regulation of Lhx1 expression was also described for the class I histone deacetylases HDAC1 and HDAC2 in non-neuronal progenitor cells [Citation52]. Here, we detected reduced levels of Hdac2 expression in Dnmt1-deficient POA cells, which is in line with the increased pan-histone acetylation determined upon Dnmt1 depletion. Consequently, a DNMT1-dependent transcriptional regulation of HDAC2 could represent a possible scenario for how DNMT1 modulates Lhx1 transcription through a crosstalk with histone acetylation. Moreover, we identified numerous transcripts related to histone acetylation and deacetylation that were altered in expression in Dnmt1-deficient POA cells, indicating multiple levels of regulation. Besides, other mechanisms that would enable a crosstalk between DNMT1 and histone acetylation, for example, via transcriptional control over long non-coding RNA expression that in turn can recruit or avoid the binding of chromatin-modifying complexes [Citation68], or an interaction of DNMT1 with the histone acetylation machinery at protein level similar to what we identified for the DNMT1-dependent establishment of H3K27me3 marks [Citation12], are likewise conceivable and subject of further investigations.
Furthermore, since the regulation of gene expression through epigenetic mechanisms is based on a complex network of diverse factors that regulate different histone tail modifications, we cannot rule out that additional mechanisms like histone phosphorylation, ubiquitination, or deimination contribute to the DNMT1-dependent regulation of Lhx1 expression. We likewise cannot exclude that the effects we described could also partially represent secondary effects through intermediary factors, and not necessarily be due to the direct interaction of DNMT1 with histone methylating complexes. For this, the identification of potential binding partners and whole protein complexes interacting with DNMT1 is of great relevance to fully understand the complex crosstalk of bivalent gene sites by histone 3 trimethylation and histone acetylation.
Together, the transcriptional control by epigenetic mechanisms once more emerges as a complex interplay of numerous factors, likely acting in large complexes that integrate intracellular and extracellular cues to drive cell differentiation and maturation processes.
Methods
Animals
For all experiments, transgenic mice on C57BL/6J background were used including Hmx3-Cre/tdTomato/Dnmt1 wild-type as well as Hmx3-Cre/tdTomato/Dnmt1 loxP2 mice. Transgenic mice were generated by crossing Hmx3-Cre mice (obtained from Oscar Marin, King’s College, London, UK and described in Gelman et al. [Citation25]) with tdTomato transgenic reporter mice (obtained from Christian Hübner, University Hospital Jena, Germany and described in Madisen et al. [Citation69]) and Dnmt1 LoxP2 mice (B6; 129Sv-Dnmt1tm4Jae/J, Jaenisch laboratory, Whitehead Institute, USA). Cre-mediated deletion in Dnmt1 mice leads to out-of-frame splicing from exon 3 to exon 6, resulting in a Dnmt1 null allele [Citation70]. Transgenic mice are abbreviated as Dnmt1 WT and Dnmt1 KO in text and figures. Mice were housed under 12 h light/dark conditions with ad libitum access to food and water. All animal procedures were approved by the local government (Thueringer Landesamt, Bad Langensalza, Germany) and performed in strict compliance with the EU directives 86/609/EWG and 2007/526/EG guidelines for animal experiments. Study design and experiments were performed according to the ARRIVE guidelines.
Preparation of POA single cells
For the preparation of cells of the embryonic preoptic area (POA), timed pregnant Dnmt1 WT and KO mice were killed by an intraperitoneal injection of 1x PBS (pH 7.4) with 2.5 μg chloral hydrate per g body weight. Embryonic POA was prepared under visual control, dissociated with 0.04% trypsin (Thermo Fisher Scientific) in Hank´s balanced salt solution (Invitrogen) for 17 min at 37 °C prior trituration and removal of cell aggregates by filtering through a 200 µm nylon gauze. Preparations of Cre-positive embryos were used for fluorescence-activated cell sorting. POA cells of Cre-negative embryos were used for morphometric studies. They were seeded at densities of 300 cells/mm2 on coverslips (Ø 12 mm) coated with 19 µg/µL laminin (Sigma-Aldrich) and 5 µg/µL poly-L-lysine (Sigma-Aldrich) and cultured according to Symmank et al. [Citation12] at 37 °C and 5% CO2.
Fluorescence-activated cell sorting (FACS) of POA cells
FACS of tdTomato reporter-positive cells was performed as described in Pensold et al. [Citation27]. FACS-enriched cell pellets were either frozen directly for DNA isolation or dissociated with TRIzol™ Reagent (Life Technologies) for RNA isolation.
RNA Sequencing and MeDIP analysis of embryonic POA cells
RNA sequencing and methylated DNA immunoprecipitation (MeDIP) sequencing of FACS-enriched POA cells were described and performed by Pensold et al. [Citation27] and reanalysed in this study. Briefly, pooled samples were tested in technical duplicates for RNA sequencing. Due to higher quantities of required material for MeDIP sequencing, one pooled sample was evaluated per genotype and a special bioinformatic pipeline for computational analysis was applied for such rare samples as previously described in Pensold et al. [Citation27] and Pensold et al. [Citation71]. Complete data set of RNA sequencing and MeDIP analysis is provided by Pensold et al. [Citation27] and uploaded at GEO with the series number GSE146968. Heat-maps were generated using R package pheatmap (https://CRAN.R-project.org/package=pheatmap). For heat-maps showing a comparison between two datasets, data were normalized to WT and log2 fold-change to KO is depicted.
N2a cell culture
Neuro-2a (N2a) cells were grown in culture medium consisting of DMEM with high glucose, sodium pyruvate (Thermo Fisher) and GlutaMAX (Invitrogen), 10% FBS (Biowest), 100 U/mL penicillin (Gibco), 100 µg/mL streptomycin (Gibco) at 37 °C, 5% CO2, and 95% humidity. When reaching 75% confluence, N2a cells were mechanically dissociated and seeded at densities of 100 cells/mm2 on coverslips (Ø 12 mm) coated with 19 μg/mL laminin (Sigma-Aldrich) and 10 μg/mL poly-L-lysine (Sigma-Aldrich) in GBSS. For further treatment, N2a cells were incubated in culture medium (DMEM, 10% FBS, 100 U/mL penicillin, 100 µg/mL streptomycin) at 37 °C, 5% CO2, and 95% humidity for 24 h.
Transfection with siRNA and inhibitor treatment
Transfection of N2a cells with siRNA was performed via lipofection using Lipofectamine™ 2000 (Thermo Fisher Scientific), according to the manufacturer’s protocol and as described in Zimmer et al. [Citation72] and Pensold et al. [Citation71]. Mouse Dnmt1 siRNA oligos (30 nM; siRNA sc-35203, Santa Cruz Biotechnology), Hdac8 siRNA oligos (30 nM; siRNA sc-35548, Santa Cruz Biotechnology), or control siRNA (15 nM; BLOCK-iT Alexa Fluor red/green fluorescent oligo, Invitrogen) were applied for 5 h in antibiotic- and serum-free Opti-MEM (Thermo Fisher Scientific). Afterwards, cells were grown in culture medium (DMEM with high glucose, sodium pyruvate and GlutaMAX, 10% FBS, 100 U/mL penicillin, 100 µg/mL streptomycin) for 24 h at 37 °C, 5% CO2, and 95% humidity if not stated differently.
N-phthalyl-L-tryptophan (20 μM, RG108, Sigma-Aldrich) was used to block DNA methylation. To inhibit histone methyltransferases, N2a cells were treated with 100 nM of 3-deazaneplanocin A (DZNep; Sigma-Aldrich) and POA cells with 1.5 µM DZNep. Anacardic acid of 40 µM (AnaA, Merck) was used to inhibit histone acetyltransferase function in N2a cells. All inhibitor treatments were performed in culture medium for 24 h at 37 °C, 5% CO2, and 95% humidity and as control, N2a cells were treated with dimethyl sulphoxide (DMSO).
Chromatin-immunoprecipitation and quantitative PCR
For chromatin immunoprecipitation (ChIP), 75% confluent N2a cells were transfected with siRNA in 10 cm well plates. 24 h after transfection, crosslinking of DNA and protein was performed with 1% formaldehyde in PBS. Cells were harvested and aliquoted with a cell number of 1 × 10⁶ cells per tube and centrifuged for 5 min at 1000 x g at 4°C. ChIP was performed as described in Symmank et al. [Citation12] using the following ChIP-valuated antibodies for precipitation: rabbit anti-H3K4me3 (Abcam), rabbit anti-H3K27me3 (Millipore), and rabbit anti-IgG (Abcam). One per cent input control was taken after DNA fragmentation. Protein-DNA cross-linking of probes and input control were removed for 4 h at 65 °C with 200 mM NaOH. Finally, proteins were digested for 1 h at 45 °C in 10 mM EDTA, 40 mM Tris-HCl (pH 6.5) und 20 μg/μl proteinase K (Merck). DNA was precipitated with standard phenol-chloroform isoamyl alcohol (25:24:1) extraction and purified with the DNA Clean & Concentrator-5 Kit (Zymo Research) according to the manufacturer’s guidelines. To quantitatively asses the amount of specific DNA fragments, primer-specific pre-amplification of probes was performed in the T-gradient PCR Cycler (Bio-Rad) for 20 cycles prior quantitative analysis with the Real-Time PCR-System qTOWER3 (Analytik Jena). For both PCR reactions, Luminaris Color HiGreen qPCR Master Mix (Thermo Fisher Scientific) was used according to the manufacturer’s protocol. Following primer sequences were used (indicated as 5′ → 3′; fw, forward; rev, reverse): Gapdh fw AACGACCCCTTCATTGACCT, Gapdh rev TGGAAGATGGTGATGGGCTT, Lhx1-#1 fw AGACCTCTGATCCGAAGCTG, Lhx1-#1 rev AACGACTTCTTCCGGTGAGT, Lhx1-#2 fw TGGTCCCTTTGCTCTCCATT, Lhx1-#2 rev GGGCGACTCACAGATTTCCT, Lhx1-#3 fw GGCAACTGTCTGAATATCATGGT, Lhx1-#3 rev TGACAGATTTGCAGGGCTTG, MyoD fw CTCACAGAGTCCAGGCCAG, MyoD rev TGTTCTGTGTCGCTTAGGGA. Normalization of DNA content was performed according to the per cent-input method in relation to the analysed input probes [Citation73].
RNA isolation and expression analysis
RNA isolation of FACS-enriched POA cells was performed as described in Pensold et al. [Citation27]. For expression analysis of siRNA- or inhibitor-treated N2a cells grown in six well plates, cells were harvested with TRIzol™ Reagent (Thermo Fisher Scientific) following the manufacturer’s guidelines. RNA was isolated using 1-Bromo-3-chloropropane, centrifuged for 30 min at 13,000 × g and 4 °C and the aqueous phase was purified with the RNA Clean & Concentrator-5 kit (Zymo Research) including DNAse treatment according to manufacturer’s protocol. Superscript IV™ first-strand synthesis system (Thermo Fisher Scientific) was used for cDNA synthesis according to the manufacturer’s instructions with the same amount of input RNA in all compared probes. Quantitative reverse transcription PCR was performed with Luminaris Color HiGreen qPCR Master Mix (Thermo Fisher Scientific) according to manufacturer’s protocols and following primers were used (indicated as 5′ → 3′; fw, forward; rev, reverse): Lhx1 fw GGAGCGAAGGATGAAACAGC, Lhx1 rev TGCGGGAAGAAGTCGTAGTT, Rps29 fw GAAGTTCGGCCAGGGTTCC, Rps29 rev GAAGCCTATGTCCTTCGCGT. As housekeeping gene, Rps29 was used. Each sample was tested in three biological replicates analysed in separate qPCR runs with one to three technical replicates. The qPCR program included the following optimized steps: UDG pre-treatment at 50 °C for 2 min, initial denaturation at 95 °C for 10 min, denaturation at 95 °C for 15 sec as well as annealing and elongation at 60 °C for 1 min. Denaturation and annealing/elongation steps were repeated 40 times and primer dimers were excluded by a melting curve analysis. Data were analysed with ΔΔCt method [Citation74].
Immunocytochemistry
N2a cells, cultured on coverslips were fixed with 4% PFA/1x PBS for 10 min and immunocytochemistry was performed as previously described in Zimmer et al., 2011 [Citation72]. A pan-specific rabbit-anti-H3K9/K14/K23/K27 acetylation (Abcam) was used as the primary antibody. As secondary antibody, Cy3-goat anti-rabbit IgG (1:1000; Jackson Laboratory) was used. For analysis of cell morphology, incubation with Alexa Fluor™ 488 Phalloidin (Thermo Fisher Scientific) was performed according to the manufacturer’s guidelines.
Live-dead-assay
N2a cells cultured on coverslips were stained after inhibitor treatment for living and dead cells with the LIVE/DEAD™ Cell Vitality Assay Kit for mammalian cells (Invitrogen) according to the manufacturer’s protocol.
Migration assay with N2a cells
Standardized imaging plates (Eppendorf; 170 µm glass thickness) were coated with matrigel (GelTrex™; Thermo Fisher) according to the manufacturer’s instructions using a working concentration of 0.1 mg GelTrexTM diluted in 1 mL N2a culture medium. One hundred microlitre matrigel working solution was added per well and incubated for 60 min until hardening of the substrate. N2a cells were seeded with a density of 57 cells/mm2 and treated with the inhibitor DZNep after 24 h as described above. To avoid phototoxic effects during imaging, culture medium was exchanged to DMEM without phenol red (Invitrogen) with 10% FBS (Biowest), 100 U/mL penicil-lin (Gibco), 100 µg/mL streptomycin (Gibco). Forty-eight hours after seeding, N2a cells were imaged every 15 min for 20 h at 37 °C and 5% CO2.
Microscopy and data analysis
Fluorescent images were taken with the inverted confocal laser scanning microscope TCS SP5 (Leica). Life cell imaging of migrating cells and images of the Live-Dead-Assay were taken with the DMi8 with thunder imaging platform (Leica). Photographs were analysed with Fiji (ImageJ) software [Citation75]. Background correction was performed for fluorescence intensity measurement. Mean fluorescent intensity of Dnmt1 siRNA-treated cells was normalized to control siRNA-treated cells. Quantitative RNA results were analysed by efficiency corrected ΔΔCt method and presented in relation to control samples. Photoshop CC was applied for image illustration. Significance was analysed with two-tailed Student’s t-test or two-way ANOVA with Tukey Test. Shapiro–Wilk was used as Normality Test. Significance levels: P value <0.05 *; P value <0.01 **; P value <0.001 ***. If not stated differently, experiments were repeated three times.
Authors´ contribution
JS: designed and performed experiments, data analysis, figure illustration, conceptual design of the study, wrote the manuscript; CB: performed experiments, data analysis, figure illustration, corrected the manuscript; JR: performed experiments, data analysis, figure illustration, corrected the manuscript; DP: performed experiments and data analysis; corrected the manuscript; GZ, conceptual design of the study results, discussion, wrote the manuscript. All authors read and approved the manuscript.
Availability of data and materials
The reanalyzed RNA sequencing and MeDIP data sets comparing Hmx3-Cre/tdTomato/Dnmt1 wild-type as well as Hmx3-Cre/tdTomato/Dnmt1 loxP2 mice that are used in this study are published by Pensold et al. (27) and uploaded at GEO with the series number GSE146968.
Disclosure statement
The authors declare that they have no competing interest.
Additional information
Funding
References
- Maunakea AK, Chepelev I, Cui K, et al. Intragenic DNA methylation modulates alternative splicing by recruiting MeCP2 to promote exon recognition. Cell Res. 2013 Nov;23(11):1256–1269. PubMed PMID: 23938295. Pubmed Central PMCID: 3817542.
- Jeziorska DM, Murray RJS, De Gobbi M, et al. DNA methylation of intragenic CpG islands depends on their transcriptional activity during differentiation and disease. Proc Natl Acad Sci U S A. 2017 Sep 5;114(36):E7526–E35. PubMed PMID: 28827334. Pubmed Central PMCID: 5594649.
- Shayevitch R, Askayo D, Keydar I, et al. The importance of DNA methylation of exons on alternative splicing. Rna. 2018 Oct;24(10):1351–1362. PubMed PMID: 30002084. Pubmed Central PMCID: 6140467.
- Hudson NO, Buck-Koehntop BA. Zinc finger readers of methylated DNA. Molecules. 2018 Oct 7;23(10):2555. PubMed PMID: 30301273. Pubmed Central PMCID: 6222495.
- Rose NR, Klose RJ. Understanding the relationship between DNA methylation and histone lysine methylation. Biochimica Et Biophysica Acta. 2014 Dec;1839(12):1362–1372. PubMed PMID: 24560929. Pubmed Central PMCID: 4316174.
- Kondo Y. Epigenetic cross-talk between DNA methylation and histone modifications in human cancers. Yonsei Med J. 2009 Aug 31;50(4):455–463. PubMed PMID: 19718392. Pubmed Central PMCID: 2730606.
- Cheng X. Structural and functional coordination of DNA and histone methylation. Cold Spring Harb Perspect Biol. 2014 Aug 1;6(8):a018747–a018747. PubMed PMID: 25085914. Pubmed Central PMCID: 4107986.
- Du J, Johnson LM, Jacobsen SE, et al. DNA methylation pathways and their crosstalk with histone methylation. Nat Rev Mol Cell Biol. 2015 Sep;16(9):519–532. PubMed PMID: 26296162. Pubmed Central PMCID: 4672940.
- Vire E, Brenner C, Deplus R, et al. The polycomb group protein EZH2 directly controls DNA methylation. Nature. 2006 Feb 16;439(7078):871–874. PubMed PMID: 16357870.
- Wu X, Gong Y, Yue J, et al. Cooperation between EZH2, NSPc1-mediated histone H2A ubiquitination and Dnmt1 in HOX gene silencing. Nucleic Acids Res. 2008 Jun;36(11):3590–3599. PubMed PMID: 18460542. Pubmed Central PMCID: 2441805.
- So A-Y, Jung J-W, Lee S, et al. DNA methyltransferase controls stem cell aging by regulating BMI1 and EZH2 through microRNAs. PLoS One. 2011 May 10;6(5):e19503. PubMed PMID: 21572997. Pubmed Central PMCID: 3091856.
- Symmank J, Bayer C, Schmidt C, et al. DNMT1 modulates interneuron morphology by regulating Pak6 expression through crosstalk with histone modifications. Epigenetics 2018;13(5):536–556. PubMed PMID: 29912614. Pubmed Central PMCID: 6140805.
- Kuehner JN, Bruggeman EC, Wen Z, et al. Epigenetic regulations in neuropsychiatric disorders. Front Genet. 2019;10: 268. PubMed PMID: 31019524. Pubmed Central PMCID: 6458251.
- Focking M, Doyle B, Munawar N, et al. Epigenetic factors in schizophrenia: mechanisms and experimental approaches. Mol Neuropsychiatry. 2019 Mar;5(1):6–12. PubMed PMID: 31019914. Pubmed Central PMCID: 6465752.
- Veldic M, Caruncho HJ, Liu WS, et al. DNA-methyltransferase 1 mRNA is selectively overexpressed in telencephalic GABAergic interneurons of schizophrenia brains. Proc Natl Acad Sci U S A. 2004 Jan 6;101(1):348–353. PubMed PMID: 14684836. Pubmed Central PMCID: 314188.
- Shrestha S, Offer SM. Epigenetic regulations of GABAergic neurotransmission: relevance for neurological disorders and epigenetic therapy. Med Epigenet. 2016;4(1):1–19.
- Tatti R, Haley MS, Swanson OK, et al. Neurophysiology and regulation of the balance between excitation and inhibition in neocortical circuits. Biol Psychiatry. 2017 May 15;81(10):821–831. PubMed PMID: 27865453. Pubmed Central PMCID: 5374043.
- Rossignol E. Genetics and function of neocortical GABAergic interneurons in neurodevelopmental disorders. Neural Plast. 2011;2011:649325. [ PubMed PMID: 21876820. Pubmed Central PMCID: 3159129].
- Rubenstein JL. Annual research review: development of the cerebral cortex: implications for neurodevelopmental disorders. J Child Psychol Psychiatry. 2011 Apr;52(4):339–355. PubMed PMID: 20735793. Pubmed Central PMCID: 3429600.
- Chattopadhyaya B, Cristo GD. GABAergic circuit dysfunctions in neurodevelopmental disorders. Front Psychiatry. 2012;3:51. [ PubMed PMID: 22666213. Pubmed Central PMCID: 3364508].
- Matrisciano F, Tueting P, Dalal I, et al. Epigenetic modifications of GABAergic interneurons are associated with the schizophrenia-like phenotype induced by prenatal stress in mice. Neuropharmacology. 2013 May 68:184–194. PubMed PMID: 22564440. Pubmed Central PMCID: 3433586.
- Matrisciano F, Dong E, Nicoletti F, et al. Epigenetic alterations in prenatal stress mice as an endophenotype model for schizophrenia: role of metabotropic glutamate 2/3 receptors. Front Mol Neurosci. 2018;11:423. [ PubMed PMID: 30564095. Pubmed Central PMCID: 6289213].
- Kundakovic M, Jaric I. The epigenetic link between prenatal adverse environments and neurodevelopmental disorders. Genes (Basel). 2017 Mar 18;8(3):104. PubMed PMID: 28335457. Pubmed Central PMCID: 5368708.
- Zimmer-Bensch G. Diverse facets of cortical interneuron migration regulation – implications of neuronal activity and epigenetics. Brain Res. 2018 Dec;1700(1700):160–169. PubMed PMID: 30194015.
- Gelman DM, Martini FJ, Nobrega-Pereira S, et al. The embryonic preoptic area is a novel source of cortical GABAergic interneurons. J Neurosci. 2009 Jul 22;29(29):9380–9389. PubMed PMID: 19625528. Pubmed Central PMCID: 6665570.
- Symmank J, Golling V, Gerstmann K, et al. The transcription factor LHX1 regulates the survival and directed migration of POA-derived cortical interneurons. Cereb Cortex. 2019 Apr 1;29(4):1644–1658. PubMed PMID: 29912395.
- Pensold D, Symmank J, Hahn A, et al. The DNA methyltransferase 1 (DNMT1) controls the shape and dynamics of migrating POA-derived interneurons fated for the murine cerebral cortex. Cereb Cortex. 2017 Dec 1;27(12):5696–5714. PubMed PMID: 29117290.
- Symmank J, Zimmer G. Regulation of neuronal survival by DNA methyltransferases. Neural Regen Res. 2017 Nov;12(11):1768–1775. PubMed PMID: 29239313. Pubmed Central PMCID: 5745821.
- Symmank J, Zimmer-Bensch G. LHX1–a multifunctional regulator in preoptic area-derived interneuron development. Neural Regen Res. 2019 Jul;14(7):1213–1214. PubMed PMID: 30804249. Pubmed Central PMCID: 6425840.
- Boros J, Arnoult N, Stroobant V, et al. Polycomb repressive complex 2 and H3K27me3 cooperate with H3K9 methylation to maintain heterochromatin protein 1 at chromatin. Mol Cell Biol. 2014 Oct 1;34(19):3662–3674. PubMed PMID: 25047840. Pubmed Central PMCID: 4187721.
- Jiao L, Liu X. Structural basis of histone H3K27 trimethylation by an active polycomb repressive complex 2. Science. 2015 Oct 16;350(6258):aac4383. PubMed PMID: 26472914. Pubmed Central PMCID: 5220110.
- Girard N, Bazille C, Lhuissier E, et al. 3-Deazaneplanocin A (DZNep), an inhibitor of the histone methyltransferase EZH2, induces apoptosis and reduces cell migration in chondrosarcoma cells. PloS One. 2014;9(5):e98176. PubMed PMID: 24852755. Pubmed Central PMCID: 4031152.
- Miranda TB, Cortez CC, Yoo CB, et al. DZNep is a global histone methylation inhibitor that reactivates developmental genes not silenced by DNA methylation. Mol Cancer Ther. 2009 Jun;8(6):1579–1588. PubMed PMID: 19509260. Pubmed Central PMCID: 3186068.
- Wang P, Lin C, Smith ER, et al. Global analysis of H3K4 methylation defines MLL family member targets and points to a role for MLL1-mediated H3K4 methylation in the regulation of transcriptional initiation by RNA polymerase II. Mol Cell Biol. 2009 Nov;29(22):6074–6085. PubMed PMID: 19703992. Pubmed Central PMCID: 2772563.
- Bhandare R, Schug J, Le Lay J, et al. Genome-wide analysis of histone modifications in human pancreatic islets. Genome Res. 2010 Apr;20(4):428–433. PubMed PMID: 20181961. Pubmed Central PMCID: 2847745.
- Bernstein BE, Mikkelsen TS, Xie X, et al. A bivalent chromatin structure marks key developmental genes in embryonic stem cells. Cell. 2006 Apr 21;125(2):315–326. PubMed PMID: 16630819.
- Mikkelsen TS, Ku M, Jaffe DB, et al. Genome-wide maps of chromatin state in pluripotent and lineage-committed cells. Nature. 2007 Aug 2;448(7153):553–560. PubMed PMID: 17603471. Pubmed Central PMCID: 2921165.
- Voigt P, Tee W-W, Reinberg D. A double take on bivalent promoters. Genes Dev. 2013 Jun 15;27(12):1318–1338. PubMed PMID: 23788621. Pubmed Central PMCID: 3701188.
- Cui P, Liu W, Zhao Y, et al. Comparative analyses of H3K4 and H3K27 trimethylations between the mouse cerebrum and testis. Genomics Proteomics Bioinformatics. 2012 Apr;10(2):82–93. PubMed PMID: 22768982. Pubmed Central PMCID: 5054206.
- Barski A, Cuddapah S, Cui K, et al. High-resolution profiling of histone methylations in the human genome. Cell. 2007 May 18;129(4):823–837. PubMed PMID: 17512414.
- Burney MJ, Johnston C, Wong K-Y, et al. An epigenetic signature of developmental potential in neural stem cells and early neurons. Stem Cells. 2013 Sep;31(9):1868–1880. PubMed PMID: 23712654.
- Wang AH, Zare H, Mousavi K, et al. The histone chaperone Spt6 coordinates histone H3K27 demethylation and myogenesis. Embo J. 2013 Apr 17;32(8):1075–1086. PubMed PMID: 23503590. Pubmed Central PMCID: 3630356.
- Fuks F, Burgers WA, Brehm A, et al. DNA methyltransferase Dnmt1 associates with histone deacetylase activity. Nat Genet. 2000 Jan;24(1):88–91. PubMed PMID: 10615135.
- Rountree MR, Bachman KE, Baylin SB. DNMT1 binds HDAC2 and a new co-repressor, DMAP1, to form a complex at replication foci. Nat Genet. 2000 Jul;25(3):269–277. PubMed PMID: 10888872.
- Sung B, Pandey MK, Ahn KS, et al. Anacardic acid (6-nonadecyl salicylic acid), an inhibitor of histone acetyltransferase, suppresses expression of nuclear factor-kappaB-regulated gene products involved in cell survival, proliferation, invasion, and inflammation through inhibition of the inhibitory subunit of nuclear factor-kappaBalpha kinase, leading to potentiation of apoptosis. Blood. 2008 May 15;111(10):4880–4891. PubMed PMID: 18349320. Pubmed Central PMCID: 2384122.
- Sun Y, Jiang X, Chen S, et al. Inhibition of histone acetyltransferase activity by anacardic acid sensitizes tumor cells to ionizing radiation. FEBS Lett. 2006 Aug 7;580(18):4353–4356. PubMed PMID: 16844118.
- Marmorstein R, Zhou M-M. Writers and readers of histone acetylation: structure, mechanism, and inhibition. Cold Spring Harb Perspect Biol. 2014 Jul 1;6(7):a018762. PubMed PMID: 24984779. Pubmed Central PMCID: 4067988.
- Amano K, Hata K, Muramatsu S, et al. Arid5a cooperates with Sox9 to stimulate chondrocyte-specific transcription. Mol Biol Cell. 2011 Apr 15;22(8):1300–1311. PubMed PMID: 21346191. Pubmed Central PMCID: 3078073.
- Pardo M, Yu L, Shen S, et al. Myst2/Kat7 histone acetyltransferase interaction proteomics reveals tumour-suppressor Niam as a novel binding partner in embryonic stem cells. Sci Rep. 2017 Aug 15;7(1):8157. PubMed PMID: 28811661. Pubmed Central PMCID: 5557939.
- Haberland M, Mokalled MH, Montgomery RL, et al. Epigenetic control of skull morphogenesis by histone deacetylase 8. Genes Dev. 2009 Jul 15;23(14):1625–1630. PubMed PMID: 19605684. Pubmed Central PMCID: 2714711.
- Hua W-K, Qi J, Cai Q, et al. HDAC8 regulates long-term hematopoietic stem-cell maintenance under stress by modulating p53 activity. Blood. 2017 Dec 14;130(24):2619–2630. PubMed PMID: 29084772. Pubmed Central PMCID: 5731083.
- Liu H, Chen S, Yao X, et al. Histone deacetylases 1 and 2 regulate the transcriptional programs of nephron progenitors and renal vesicles. Development. 2018 May 18;145(10):dev153619. PubMed PMID: 29712641. Pubmed Central PMCID: 6001373.
- Reik W. Epigenetic reprogramming in mammalian development. Science. 2001 Aug 10;293(5532):1089–1093. PubMed PMID: 11498579.
- Weaver IC, et al. Reversal of maternal programming of stress responses in adult offspring through methyl supplementation: altering epigenetic marking later in life. J Neurosci. 2005 Nov 23;25(47):11045–11054. PubMed PMID: 16306417. Pubmed Central PMCID: 6725868.
- Miller CA, Sweatt JD. Covalent modification of DNA regulates memory formation. Neuron. 2007 Mar 15;53(6):857–869. PubMed PMID: 17359920.
- Cedar H, Bergman Y. Linking DNA methylation and histone modification: patterns and paradigms. Nat Rev Genet. 2009 May;10(5):295–304. PubMed PMID: 19308066.
- Ning X, Shi Z, Liu X, et al. DNMT1 and EZH2 mediated methylation silences the microRNA-200b/a/429 gene and promotes tumor progression. Cancer Lett. 2015 Apr 10;359(2):198–205. PubMed PMID: 25595591.
- Purkait S, Sharma V, Kumar A, et al. Expression of DNA methyltransferases 1 and 3B correlates with EZH2 and this 3-marker epigenetic signature predicts outcome in glioblastomas. Exp Mol Pathol. 2016 Apr;100(2):312–320. PubMed PMID: 26892683.
- Lin B, Lee H, Yoon J-G, et al. Global analysis of H3K4me3 and H3K27me3 profiles in glioblastoma stem cells and identification of SLC17A7 as a bivalent tumor suppressor gene. Oncotarget. 2015 Mar 10;6(7):5369–5381. PubMed PMID: 25749033. Pubmed Central PMCID: 4467155.
- Morey L, Santanach A, Blanco E, et al. Polycomb regulates mesoderm cell fate-specification in embryonic stem cells through activation and repression mechanisms. Cell Stem Cell. 2015 Sep 3;17(3):300–315. PubMed PMID: 26340528.
- Ikeda H, Sone M, Yamanaka S, et al. Structural and spatial chromatin features at developmental gene loci in human pluripotent stem cells. Nat Commun. 2017 Nov 20;8(1):1616. PubMed PMID: 29158493. Pubmed Central PMCID: 5696376.
- Li F, Wan M, Zhang B, et al. Bivalent histone modifications and development. Curr Stem Cell Res Ther. 2018;13(2):83–90. PubMed PMID: 28117006.
- Vastenhouw NL, Schier AF. Bivalent histone modifications in early embryogenesis. Curr Opin Cell Biol. 2012 Jun;24(3):374–386. PubMed PMID: 22513113. Pubmed Central PMCID: 3372573.
- Eberharter A, Becker PB. Histone acetylation: a switch between repressive and permissive chromatin. Second in review series on chromatin dynamics. EMBO Rep. 2002 Mar;3(3):224–229. PubMed PMID: 11882541. Pubmed Central PMCID: 1084017.
- Shahbazian MD, Grunstein M. Functions of site-specific histone acetylation and deacetylation. Annu Rev Biochem. 2007;76(1):75–100. PubMed PMID: 17362198.
- Nott A, Cho S, Seo J, et al. HDAC2 expression in parvalbumin interneurons regulates synaptic plasticity in the mouse visual cortex. Neuroepigenetics. 2015;1 1(1):34–40. PubMed PMID: 25705589. Pubmed Central PMCID: 4331030.
- Tsui D, Voronova A, Gallagher D, et al. CBP regulates the differentiation of interneurons from ventral forebrain neural precursors during murine development. Dev Biol. 2014 Jan 15;385(2):230–241. PubMed PMID: 24247009.
- Zimmer-Bensch G. Emerging roles of long non-coding RNAs as drivers of brain evolution. Cells. 2019 Nov 6;8(11):1399. PubMed PMID: 31698782. Pubmed Central PMCID: 6912723.
- Madisen L, Zwingman TA, Sunkin SM, et al. A robust and high-throughput Cre reporting and characterization system for the whole mouse brain. Nat Neurosci. 2010 Jan;13(1):133–140. PubMed PMID: 20023653. Pubmed Central PMCID: 2840225.
- Jackson-Grusby L, Beard C, Possemato R, et al. Loss of genomic methylation causes p53-dependent apoptosis and epigenetic deregulation. Nat Genet. 2001 Jan;27(1):31–39. PubMed PMID: 11137995.
- Pensold D, Reichard J, Van Loo KMJ, et al. DNA methylation-mediated modulation of endocytosis as potential mechanism for synaptic function regulation in murine inhibitory cortical interneurons. Cereb Cortex. 2020 Mar 7 PubMed PMID: 32147726. doi:10.1093/cercor/bhaa009.
- Zimmer G, Rudolph J, Landmann J, et al. Bidirectional ephrinB3/EphA4 signaling mediates the segregation of medial ganglionic eminence- and preoptic area-derived interneurons in the deep and superficial migratory stream. J Neurosci. 2011 Dec 14;31(50):18364–18380. PubMed PMID: 22171039. Pubmed Central PMCID: 6623906.
- Haring M, Offermann S, Danker T, et al. Chromatin immunoprecipitation: optimization, quantitative analysis and data normalization. Plant Methods. 2007 Sep;3(1):11. PubMed PMID: 17892552. Pubmed Central PMCID: 2077865.
- Livak KJ, Schmittgen TD. Analysis of relative gene expression data using real-time quantitative PCR and the 2−ΔΔCT method. Methods. 2001 Dec;25(4):402–408. PubMed PMID: 11846609.
- Schindelin J, Arganda-Carreras I, Frise E, et al. Fiji: an open-source platform for biological-image analysis. Nat Methods. 2012 Jun 28;9(7):676–682. PubMed PMID: 22743772. Pubmed Central PMCID: 3855844.