
ABSTRACT
The aim of this study was to develop a less invasive and accurate diagnostic system for upper urinary tract urothelial carcinoma (UTUC) based on genome-wide DNA methylation profiling. Genome-wide DNA methylation screening was performed using the Infinium HumanMethylation450 BeadChip, and DNA methylation quantification was verified using pyrosequencing. We analysed 26 samples of normal control urothelial tissue (C), an initial cohort of 62 samples (31 samples of non-cancerous urothelium [N] from UTUC patients and 31 samples of the corresponding UTUCs), a validation cohort of 82 samples (41 N and 41 UTUC samples), and 14 samples of urinary bladder urothelial carcinoma (BUC). In the initial cohort, we identified 2,448 CpG sites showing significant differences in DNA methylation levels between both C and UTUC and N and UTUC, but not showing differences between C and N. Among these CpG sites, 10 were located within CpG islands or their shores and shelves included in genomic domains where DNA methylation levels are stably controlled, allowing discrimination of UTUC even from BUC. Receiver operating characteristic curve analysis for discrimination of UTUC from N in these 10 CpG and neighbouring sites (37 diagnostic panels in total) yielded area under the curve values of 0.959–1.000, with a sensitivity and specificity of 86.6–100% and 93.5–100%, respectively. The diagnostic impact was successfully confirmed in the validation cohort. Our criteria were useful for diagnosis of UTUC, regardless of its clinicopathological features. Application of our criteria to voided urine samples will ultimately allow non-invasive DNA methylation diagnosis of UTUC.
Introduction
Urothelial carcinomas (UCs) develop in the upper urinary tract, i.e. the renal pelvis and ureter, and urinary bladder. The initial symptom in patients with UCs, regardless of whether they are upper urinary tract urothelial carcinomas (UTUCs) or urinary bladder urothelial carcinomas (BUCs), is usually macroscopic or microscopic haematuria and a positive test result for voided urine cytology. Among such patients, those in whom no tumorous lesion can be detected in the urinary bladder using cystoscopy are suspected to have UTUC [Citation1]. For definitive diagnosis of UTUC, selective urine cytology and ureteral catheterization for retrograde ureteropyelography and ureteroscopy are necessary. However, these procedures are invasive, sometimes inducing complications such as urinary tract infection or ureteral avulsion [Citation2]. Moreover, the sensitivity and specificity of selective urine cytology are not necessarily sufficient for detection of UTUC because of crushing and degeneration of exfoliated cancer cells [Citation3]. Although less invasive diffusion-weighted magnetic resonance urography is available, its use is somewhat challenging because of its low spatial resolution and limited ability to detect urinary calculi [Citation1]. Computed tomographic urography is one imaging technique with higher accuracy, but it requires high dose of radiation and is often contraindicated because of the need for iodinated contrast media. Moreover, computed tomography is generally unable to visualize flat carcinomas in situ without a mass effect or urothelial thickening [Citation1]. In this context, therefore, development of less invasive and reliable diagnostic techniques for UTUC is required.
It is well known that not only genomic but also epigenomic alterations participate in carcinogenesis in various human organs [Citation4,Citation5]. DNA methylation alterations are one of the most important epigenomic changes resulting in chromosomal instability and aberrant expression of tumour-related genes [Citation6–8]. Previous studies by ourselves [Citation9–11] and other groups [Citation12,Citation13], including the study by The Cancer Genome Atlas (TCGA) [Citation14], have revealed distinct differences in DNA methylation profiles between non-cancerous urothelia and UCs, suggesting that DNA methylation alterations can become a diagnostic parameter for UC detection [Citation15]. Moreover, since DNA methylation alterations during carcinogenesis are stably maintained on the DNA double-strand by covalent bonding through a maintenance methylation mechanism involving DNA methyltransferase (DNMT1) [Citation16,Citation17], such alterations can be regarded as a stable indicator for cancer diagnostics, differing from abnormalities of mRNA or protein expression that are easily affected by the microenvironment of cancer cells.
On the other hand, epigenomic mechanisms show heterogeneity among organs, tissues, and cell lineages. Even after cancerization, it has been reported that at least a proportion of such organ-specific DNA methylation profiles are maintained in cancerous tissue samples [Citation18]. Indeed, differences in DNA methylation profiles between UTUC and BUC have recently been noted [Citation19]. Differences in genetic alterations between UTUC and BUC have also attracted attention [Citation20], and it is known that DNA methylation alterations in cancers can be caused and/or affected by genetic alterations [Citation21]. Therefore, at least some of the differences in DNA methylation profiles between UTUC and BUC may be attributable to genetic alterations. In this context, DNA methylation criteria for UTUC may be optimal for discriminating UTUC from not only non-cancerous urothelium but also BUC.
In the present study, to establish new criteria for the diagnosis of UTUC, we analysed a total of 184 tissue samples. Using 26 tissue samples from patients without UCs and 76 tissue samples from patients with UCs, we performed single-CpG resolution genome-wide DNA methylation screening using the Infinium assay [Citation22] and verified the DNA methylation quantification using pyrosequencing. The reliability of the established criteria was successfully confirmed using 82 additional tissue samples in a validation cohort.
Results
DNA methylation profiles based on Infinium assays
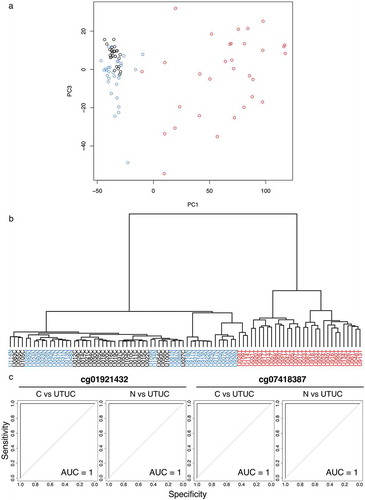
Based on Infinium data for all 473,228 CpG sites, principal component analysis (PCA) () and unsupervised hierarchical clustering (Ward’s linkage using Euclidean distances) () were performed using 26 samples of normal control urothelium (C) and 31 samples of non-cancerous urothelium (N) obtained from 31 patients who underwent nephroureterectomy for UTUC and 31 samples of the corresponding UTUCs in the initial cohort. shows that the DNA methylation profile of N samples tended to be different from that of C samples. Furthermore, the DNA methylation profile of UTUCs was clearly different from that of both C and N samples (). As shown in , unsupervised hierarchical clustering again confirmed that the DNA methylation profile of UTUCs differed distinctly from that of C and N samples, indicating that UTUC can be discriminated from both C and N on the basis of DNA methylation profiles.
Figure 1. DNA methylation profiling of tissue samples in the initial cohort. (a) Principal component analysis based on the results of the Infinium assay. The DNA methylation profile of non-cancerous urothelium (N, n = 31, blue) from patients with upper urinary tract urothelial carcinoma (UTUC) tended to differ from that of normal control urothelium (C, n = 26, black). Furthermore, the DNA methylation profile of the corresponding UTUC (n = 31, red) clearly differed from those of both C and N samples. (b) Unsupervised hierarchical clustering (Ward’s linkage using Euclidean distances). The distinct difference of the DNA methylation profile of UTUC (red) from that of C (black) or N (blue) samples is again confirmed. (c) Representative results of receiver operating characteristic curve analysis for candidate marker CpG sites identified using the procedures described in the Results section. The area under the curve values for Infinium probes cg01921432 and cg07418387 for discrimination of UTUC from C and those of the same probes for discrimination of UTUC from N are all 1
Identification of candidate marker CpG sites for diagnosis of UTUC
Candidate marker CpG sites discriminating UTUC from both C and N were identified by the following analyses, (a) to (c). (a) Welch’s t-test with the Bonferroni correction identified 71,869 probes showing significant differences in DNA methylation levels between the 31 UTUC samples in the initial cohort and the 26 C samples (P < 0.05 and |∆βUTUC − C| ≥ 0.2). Then, using these 71,869 probes, receiver operating characteristic (ROC) curves were generated to discriminate UTUC samples from C samples, and 7,777 probe CpG sites showed area under the curve (AUC) values of 1.0 (). (b) Next, Welch’s t-test with the Bonferroni correction identified 68,173 probes showing significant differences in DNA methylation levels between the 31 UTUC samples and the 31 N samples in the initial cohort (P < 0.05 and |∆βUTUC − N| ≥ 0.2). Among the 68,173 probes, 2,723 probe CpG sites showed AUC values of 1.0 in the ROC curves discriminating UTUC samples from N samples (). (c) Third, Welch’s t-test with the Bonferroni correction identified 22 probes showing significant differences in DNA methylation levels between the 26 C samples and the 31 N samples in the initial cohort (P < 0.05 and |∆βN − C| ≥ 0.2). We considered that 2,448 probe CpG sites satisfying both (a) and (b), but not (c), i.e. probes showing statistically significant differences between UTUC and both C and N and showing no significant difference between C and N, were candidate marker CpG sites for diagnosis of UTUC.
To establish criteria for the diagnosis of UTUC, among the 2,448 probe CpG sites, we further focused on the top 100 CpG sites showing the largest differences in β-values between UTUC and N (|∆βUTUC − N|). Then, among those 100 CpG sites, we focused on 52 that were located within CpG islands, island shores (the 2000-bp region adjacent to a CpG island) or island shelves (the 2000-bp region adjacent to island shores) based on the University of California, Santa Cruz (UCSC) genome browser (https://genome.ucsc.edu/). Furthermore, we referred to iMETHYL, an integrative multi-omics database (http://imethyl.iwate-megabank.org) that provides DNA methylation data for blood cells from a healthy Japanese population [Citation23,Citation24]. Based on this database, among the 52 CpG sites, we further focused on 21 that showed stable DNA methylation levels along with neighbouring CpG sites en bloc (for which the interquartile ranges of DNA methylation levels for all CpG sites located within at least a 1000-bp domain including the candidate marker CpG site were less than 20%).
In addition, Welch’s t-test was performed using the 21 CpG sites, and this identified 18 CpG sites showing significant differences in DNA methylation levels between the 31 UTUC samples and the 14 BUC samples (P < 0.05). We therefore considered these 18 CpG sites to be marker candidates that were able to distinguish UTUC from not only C and N (AUC = 1) but also BUC. All Infinium data for the 18 CpG sites are summarized in .
Table 1. DNA methylation levels obtained by Infinium assay for tissue samples of normal control urothelium (C), non-cancerous urothelium (N) from patients with upper urinary tract urothelial carcinoma (UTUC), and the corresponding UTUCs in the initial cohort and urinary bladder urothelial carcinoma (BUC)
Technical verification of DNA methylation levels of candidate marker CpG sites by pyrosequencing
Although we intended to technically verify the DNA methylation levels of the 18 candidate marker CpG sites based on Infinium assay using pyrosequencing, optimization of the PCR conditions was very difficult for pyrosequencing of 5 of the 18 CpG sites (cg05492975, cg10216717, cg16529477, cg18077971, and cg26132774). In addition, for 3 of the remaining 13 CpG sites (cg01227537, cg08070771, and cg16705627), the measured values did not completely agree with the theoretical values during the optimization procedure. On the other hand, the PCR conditions for pyrosequencing were successfully optimized for verification of the remaining 10 candidate marker CpG sites (cg01921432, cg07197785, cg07418387, cg08364561, cg10256242, cg10874111, cg14302471, cg14851578, cg15822765, and cg24035245) (Table S1): linearity of the measured values and consistency of them with the theoretical values for each of the CpG sites are shown in Figure S1.
DNA methylation levels of the 10 CpG sites were quantified using pyrosequencing in the 26 C samples and the 31 N and 30 UTUC samples in the initial cohort (pyrosequencing could not be performed for one UTUC sample because of insufficient genomic DNA remaining after the Infinium assay). DNA methylation levels based on the Infinium assay and pyrosequencing were significantly correlated with each other (Pearson’s correlation coefficient > 0.913 and P < 7.02 × 10⁻³⁵) (Figure S2), indicating that the Infinium data had been successfully verified by pyrosequencing and that the 10 CpG sites identified on the basis of the Infinium assay were valid diagnostic markers.
summarizes the gene names, chromosomal loci, and annotations (TSS1500 [from the transcription start site [TSS] to 1500 bp upstream of it], the first exons, and the first introns, or gene body [second exon and downstream of it] based on the RefSeq database [http://www.ncbi.nlm.nih.gov/refseq/]) for the 10 CpG sites. Using the pyrosequencing data, significant differences in DNA methylation levels between UTUC and C samples and UTUC and N samples, and no significant differences between C and N samples were again confirmed for the 10 CpG sites ().
Table 2. Marker CpG sites discriminating urinary tract urothelial carcinoma (UTUC) from normal control urothelium (C), non-cancerous urothelium from patients with UTUC (N), and urinary bladder urothelial carcinoma (BUC) located within stably regulated CpG islands or their shores and shelves, and for which DNA methylation levels based on Infinium assay were technically verified using pyrosequencing
Figure 2. DNA methylation levels obtained by pyrosequencing of candidate marker CpG sites in tissue samples in the initial cohort. Normal control urothelium (C, n = 26), non-cancerous urothelium (N, n = 31) obtained from patients with upper urinary tract urothelial carcinoma (UTUC), and the corresponding UTUC (n = 30) were analysed. Infinium probe IDs and P values in Welch’s t-test are shown in each panel. DNA methylation levels for each of the Infinium probes cg01921432, cg07197785, cg08364561, cg15822765, and cg24035245 in UTUC samples are significantly higher than those in both C and N samples. The DNA methylation levels for each of the Infinium probes cg07418387, cg10256242, cg10874111, cg14302471, and cg14851578 in UTUC samples are significantly lower than those in both C and N samples
Establishment of diagnostic criteria for UTUC
To establish criteria for the diagnosis of UTUC using each of the 10 marker CpG sites, ROC curves were generated using the pyrosequencing data for discriminating UTUC samples from N samples in the initial cohort (Figure S3), and cut-off values were settled by the top left method for each CpG site. Even when pyrosequencing data were used, excellent AUC values (0.988 to 1.000) were again obtained for each of the 10 exact Infinium probe CpG sites ().
Table 3. DNA methylation diagnosis of upper urinary tract urothelial carcinoma (UTUC)
In addition to the exact Infinium probe sites, DNA methylation levels at neighbouring CpG loci were also determined by pyrosequencing. For example, in addition to the exact Infinium probe cg01921432 site (position 2), DNA methylation data for a neighbouring CpG site (position 1) was obtained, as shown in Table S1. As expected, based on the iMETHYL database, such neighbouring CpG loci also showed excellent AUC values (0.959 to 1.00) for discriminating UTUC samples from N samples (Figure S3). The AUC and cut-off values for all neighbouring CpG loci for each Infinium probe CpG site are also included in . When using the average DNA methylation levels at the exact Infinium probe CpG site and its neighbouring CpG loci, excellent AUC values (0.986 to 1.00) were again obtained for each of the 10 Infinium probe CpG sites ( and Figure S3).
Using each of the 37 diagnostic criteria (the exact Infinium probe CpG sites, their neighbouring CpG sites and their average) shown in , the sensitivity for the diagnosis of UTUCs (n = 30) in all the initial cohort samples (n = 61) ranged from 86.6% to 100%, and the specificity ranged from 93.5% to 100% ().
Confirmation of the diagnostic criteria using the validation cohort
To validate the reliability of our criteria for the diagnosis of UTUC, pyrosequencing was performed for the 41 N samples and 41 UTUC samples in the validation cohort. For each of the 37 diagnostic criteria using the cut-off values shown in , the sensitivity for the diagnosis of UTUCs (n = 41) in all of the validation cohort samples (n = 82) ranged from 73.1% to 97.5%, and the specificity of such diagnosis ranged from 87.8% to 100% (), indicating that the reliability of the 37 criteria had been successfully validated.
Correlation between DNA methylation levels at marker CpG sites and clinicopathological parameters of UTUC
The positivity of our criteria in the 71 UTUC samples in both the initial and validation cohorts did not show any correlation with the clinicopathological parameters of UTUCs (gender, age, histological grade, pathological stage, and lymph node metastasis) (Table S2), indicating that the 37 criteria would be useful for diagnosis of UTUC, regardless of clinicopathological features.
Clinically applicable diagnostic criteria for UTUC
In order to make our diagnostic criteria for UTUC more clinically practical while achieving higher sensitivity and specificity, according to the data shown in , we selected a combination of a few marker CpG sites and standardized the cut-off values. As a result, by quantifying the DNA methylation levels of only four CpG sites and using simple cut-off values, i.e. ‘more than 30% and less than 70%’ or ‘more than 25% or less than 70%’, we were able to create 141 diagnostic panels that achieved 100% sensitivity and specificity in the initial cohort (Table S3). The sensitivity and specificity of the 141 panels were all 97.5% and 100% in the validation cohort, respectively (Table S3), indicating the clinical applicability of our diagnostic criteria.
Discussion
UCs are clinically noteworthy for their multicentricity and tendency for recurrence, often developing multifocally in the renal pelvis, ureter, and urinary bladder synchronously or metachronously. Although multifocal development of UCs may be partly attributable to intraluminal seeding [Citation25,Citation26], one possible mechanism for their multiplicity may be the ‘field effect’, whereby carcinogenic agents in the urine cause malignant transformation of multiple urothelial cells [Citation27,Citation28]. Even non-cancerous urothelia without remarkable histological changes obtained from patients with UCs can be considered precancerous, as they may have been exposed to carcinogens in the urine. It is well known that aberrant DNA methylation participates in even the early and precancerous stages in different organs [Citation29,Citation30]. In particular, we have revealed that DNA methylation levels at numerous CpG sites were actually altered in non-cancerous urothelia showing no marked histological changes, but which were clearly at the precancerous stage due to field cancerization, compared to normal urothelia; thus, DNA methylation abnormalities at the precancerous stage can predict future risk or urothelial carcinogenesis [Citation15]. Even in this study, the DNA methylation profile of N samples tended to differ from that of C samples on the basis of PCA and hierarchical clustering (. This finding is consistent with our previous data [Citation10,Citation15].
On the other hand, the aim of the present study was to establish criteria for the diagnosis of extant UTUC in the upper urinary tract, rather than for assessment of future UTUC risk. For this purpose, it was necessary to identify marker CpG sites discriminating UTUC from not only control C samples but also N samples by focusing on CpG sites without DNA methylation alterations at the precancerous N stages. This allowed us to identify 2,448 candidate marker CpG sites. Criteria allowing diagnosis of both UTUC and BUC would be clinically useful: if a test such as voided urine cytology for diagnosis of both UTUC and BUC gave a positive result when no tumorous lesion was detectable using cystoscopy, then UTUC might be suspected. However, in the present study, we focused directly on non-invasive diagnosis of UTUC, for which precise diagnosis is often difficult. Using this approach, we identified candidate marker CpG sites that discriminated UTUC even from BUC.
In order to establish reproducible diagnostic criteria, we aimed at marker CpG sites possibly showing stable DNA methylation abnormalities during carcinogenesis. In general, most 5-methylcytosine residues seem to be controlled in a coordinated manner with their neighbours, rather than being independent, resulting in a domain wherein, all CpG sites show largely similar methylation levels [Citation31,Citation32]. Such stably regulated domains often include CpG islands. It is well known that the DNA methylation status of almost all CpG sites included in CpG islands is stably regulated in normal tissue but frequently altered en bloc throughout the CpG islands during carcinogenesis [Citation4,Citation5], whereas DNA methylation levels at sparsely scattered CpG sites are unstable and may not be applicable as reproducible diagnostic markers. Therefore, using the iMETHYL database, we focused especially on CpG sites belonging to CpG islands or their shores and shelves and also included larger domains (at least 1000-bp) in which DNA methylation levels are stably regulated. In this way, we identified 18 CpG sites as candidate markers that are able to distinguish UTUC from not only C and N (AUC = 1 for both C and N based on the Infinium assay) but also BUC (). Pyrosequencing analysis verified the quantitative accuracy of the Infinium assay, and analysis of the validation cohort confirmed the reliability of the DNA methylation diagnostic criteria we had established.
Marker CpG sites were located around the TSS of the BARHL2 and LOC154822 genes and in the gene body of the FMN2 and RADIL genes (). DNA hypermethylation around the TSS of the BARHL2 gene has been reported in human gastric adenocarcinoma [Citation33], lung squamous cell carcinoma [Citation34] and astrocytoma [Citation35]. Especially, BARHL2 methylation is an established biomarker for detection of early gastric cancer with or without H. pylori infection using gastric wash DNA after endoscopic resection and gastric juice exosomal DNA [Citation33]. Treatment with a demethylating agent, 5-aza-2ʹ-deoxycytidine, has been reported to restore the expression of BARHL2 in human cancer cell lines, thus suppressing their growth [Citation33]. Moreover, the BarH family of homeodomain proteins, to which BARHL2 belongs, plays essential roles in cell fate specification, cell differentiation, migration, and survival [Citation36]. By analogy, BARHL2 DNA hypermethylation may not only be regarded as a marker of UTUC but may also participate in the development of UTUC by silencing BARHL2.
LOC154822 has never been characterized in detail. Therefore, even though marker CpG sites are located around the TSS of the gene, it is difficult to interpret its UTUC-specific DNA hypomethylation. On the other hand, our previous studies revealed that even DNA methylation alterations at CpG sites not participating in expression regulation of functionally important genes can become excellent surrogate markers for cancer diagnostics [Citation15,Citation37]. The excellent sensitivity (95.1–100% in the initial and validation cohorts) and specificity (100% in the initial and validation cohorts) of CpG sites at LOC154822 () are consistent with our previous findings. Moreover, cg07197785, cg08364561, cg14851578, cg15822765 and cg24035245, which were designed within the intergenic regions (), and their neighbouring CpG sites were also excellent surrogate markers showing high sensitivity (85.3–100% in the initial and validation cohorts) and specificity (87.8–100% in the initial and validation cohorts) ().
FMN2 is known to be induced by p14ARF via an NF-kB-dependent but p53-independent mechanism and to enhance expression of the cell-cycle inhibitor p21 by preventing its degradation [Citation38]. Silencing of the FMN2 gene by DNA hypermethylation around the promoter region has been reported in colorectal cancer [Citation39]. In contrast, our marker CpG site is located in the body of the FMN2 gene. In addition, the DNA methylation level of the exact Infinium probe CpG (cg07418387) in the gene body showed a significant positive correlation with the mRNA expression level (r = 0.287, P = 1.51 × 10⁻⁹) in UCs deposited in the TCGA database (https://tcga-data.nci.nih.gov/tcga/), although all of the deposited UCs are not derived from the upper urinary tract. Although DNA hypomethylation of the marker CpG site may be associated with reduced expression of FMN2 in our samples of UTUC, the impact of gene body DNA hypomethylation on FMN2 expression level should be further investigated.
RADIL, one of the effectors for the small GTPase RAP1, mediates inside-out integrin activation by RAP1, thereby influencing cell adhesion, migration, and polarity [Citation40]. Knockdown of the RADIL gene has been reported to efficiently block migration and invasion of breast cancer cell lines in vitro and breast cancer metastasis in a mouse model [Citation40]. In UCs deposited in the TCGA database, the DNA methylation level of the Infinium probe CpG (cg10256242) in the gene body was positively correlated with the level of mRNA expression (r = 0.482, P = 3.60 × 10⁻²⁶), suggesting that DNA hypomethylation may result in reduced expression. However, to our knowledge, aberrant expression due to DNA methylation alteration of the RADIL gene has never been reported in any human cancers. The significance of gene body DNA hypomethylation of RADIL in expression regulation should again be further clarified.
From the viewpoint of practical application as a clinical test, since we have achieved excellent sensitivity and specificity by quantifying the DNA methylation levels of only four marker CpG sites and using simply standardized cut-off values (Table S3), we consider it would be feasible to introduce any of the diagnostic panels shown in Table S3 into the clinical laboratories of individual hospitals. Moreover, since voided urine samples can be obtained non-invasively and easily, UTUC diagnosis using this source would be very desirable. On the other hand, voided urine samples contain mixtures of urothelial cells, blood cells, and other contaminating cells. When some ordinary methods, such as quantitative methylation-specific PCR, MassARRAY, and pyrosequencing, are applied to such urine specimens, the various DNA methylation levels of these cell lineages tend to be quantified as a whole, and not individually. In such situations, the CpG sites that we identified may be difficult to employ as diagnostic markers. However, if a system for quantification of DNA methylation (such as high-performance liquid chromatography [HPLC]) was able to discriminate diseased cells with DNA methylation abnormalities from contaminating cells, even if the proportion of diseased cells is low [Citation41]; then, our marker might be useful for UTUC diagnosis in patients with haematuria but without any obvious lesion detected by cystoscopy in the urinary bladder. Representative chromatograms showing that the HPLC-based quantification system can discriminate DNA derived from a minor component (diseased cells) in a mixed DNA sample, are shown in Figure S4. We have not yet completed studies using urine samples, and prospective validation using urine will, of course, be needed. However, our preliminary examinations have revealed that DNA methylation levels determined using voided urine samples from patients with UTUC are similar to the DNA methylation levels evident in the tissue samples. Therefore, it may be possible to implement non-invasive and reliable DNA methylation diagnosis of UTUC using voided urine samples and an appropriate system for quantification of DNA methylation such as HPLC.
Materials and methods
Patients and tissue samples
The initial cohort included 31 N samples obtained from 31 patients who underwent nephroureterectomy for UTUC and 31 samples of the corresponding UTUCs (62 samples in total). For comparison, we analysed 26 C samples obtained from the surgically resected renal pelvis or ureter of 22 patients with renal cell carcinoma, 3 with retroperitoneal liposarcoma, and 1 with retroperitoneal schwannoma. For further comparison, 14 samples of BUC obtained from 14 patients who underwent radical cystectomy were also analysed. The tissue samples in the validation cohort consisted of 41 samples of N and 41 samples of the corresponding UTUCs (82 samples in total). Histological diagnosis of UC was made in accordance with the World Health Organization criteria [Citation42]. All the tumours were classified according to the Tumour-Node-Metastasis Classification of the International Union Against Cancer [Citation43]. The clinicopathological parameters of patients belonging to each cohort, from whom N and UTUC (initial and validation cohorts), C and BUC samples were obtained, are summarized in Table S4: no significant differences in any of these parameters were observed among the cohorts.
All surgery was performed at the National Cancer Centre Hospital, Tokyo, Japan. Tissue samples were taken immediately after surgery, and then frozen and stored in liquid nitrogen until analysis in accordance with the ‘Japanese Society of Pathology Guidelines for the handling of pathological tissue samples for genomic research’ [Citation44]. This study was approved by the Ethics Committees of the National Cancer Centre and Keio University School of Medicine, and performed in accordance with the Declaration of Helsinki. All patients included in this study provided written informed consent for use of their samples.
Genome-wide screening by Infinium assay
High-molecular-weight DNA was extracted from fresh frozen tissue samples using phenol–chloroform, followed by dialysis. Five-hundred-nanogram aliquots of DNA were subjected to bisulphite conversion using the EZ DNA Methylation-GoldTM Kit (Zymo Research, Irvine, CA). Subsequently, the DNA methylation levels at 485,764 CpG sites were assayed using the Infinium HumanMethylation450 BeadChip (Illumina, San Diego, CA) [Citation22] in accordance with the manufacturer’s instructions. After hybridization, the specifically hybridized DNA was fluorescence-labelled by a single-base extension reaction and detected using an Illumina iScan system (Illumina) in accordance with the manufacturer’s protocol.
The data were then assembled using GenomeStudio methylation software (Illumina). At each CpG site, the ratio of the fluorescent signal was measured using a methylated probe relative to the sum of the methylated and unmethylated probes, i.e. the so-called β-value, which ranges from 0.00 to 1.00, representing the fully unmethylated and fully methylated values of an individual CpG site, respectively. The results of Infinium assay have been reported in our previous paper focusing on carcinogenetic risk estimation [Citation15] and deposited in the Gene Expression Omnibus database (GEO, https://www.ncbi.nlm.nih.gov/geo/, Accession number: GSE111933).
Quantitative DNA methylation analysis by pyrosequencing
Four-hundred-nanogram aliquots of DNA were subjected to bisulphite treatment using an EpiTect Bisulphite Kit (QIAGEN GmbH, Hilden, Germany) in accordance with the manufacturer’s protocol. The PCR and sequencing primers were designed using Pyrosequencing Assay Design Software ver.1.0 (QIAGEN). Each of the primer sequences is given in Table S1. To overcome any PCR bias, we optimized the PCR conditions: 0%, 50%, and 100% of the fully methylated control DNA (Epitect methylated human control DNA, QIAGEN) were used as a template to test the linearity of the protocol, as described previously [Citation37,Citation45]. As a result of this optimization experiment, all PCR reactions were performed using HotStarTaq DNA polymerase (QIAGEN). Further optimized PCR conditions for each primer set are summarized in Table S1. The biotinylated PCR product was captured on streptavidin-coated beads. Quantitative sequencing was performed on a PyroMark Q24 (QIAGEN) using the Pyro Gold Reagents (QIAGEN) in accordance with the manufacturer’s protocol. The experiment was conducted in triplicate and the mean DNA methylation levels for every three experiments were used as quantitative values.
Statistics
In the Infinium assay, the call proportions (P values for detection of signals above the background <0.01) for 893 probes in all of the tissue samples examined (26 C samples, 31 N and 31 UTUC samples in the initial cohort and 14 BUC samples) were less than 90%. Since such a low proportion may have been attributable to polymorphism at the probe CpG sites, these 893 probes were excluded from the present assay, as described previously [Citation6,Citation7]. The 127 probes containing missing β-values of more than 10% were also excluded. In addition, all 11,648 probes on chromosomes X and Y were excluded to avoid any gender-specific methylation bias, leaving a final total of 473,228 autosomal CpG sites.
The DNA methylation profiles of the 26 C samples and 31 N and 31 UTUC samples in the initial cohort were analysed using PCA and unsupervised hierarchical clustering (Ward’s linkage using Euclidean distances). Differences in DNA methylation levels among the sample groups were examined by Welch’s t-test with the Bonferroni correction. The ROC curve was generated for discriminating UTUC samples from N samples and cut-off values were settled by the top left method for each CpG site. Correlations between the DNA methylation levels based on the Infinium assay and those based on pyrosequencing were examined by Pearson correlation analysis. Differences at P values of less than 0.05 were considered statistically significant. All statistical analyses were performed using the statistical program RStudio (RStudio Inc., Boston, MA, https://www.rstudio.com) and the R software package (R Foundation for Statistical Computing, https://www.r-project.org).
Abbreviations
| AUC | = | Area under the curve |
| BUC | = | Urinary bladder urothelial carcinoma |
| C | = | Normal control urothelium |
| HPLC | = | High-performance liquid chromatography |
| N | = | Non-cancerous urothelium |
| PCA | = | Principal component analysis |
| ROC | = | Receiver operating characteristic |
| TCGA | = | The Cancer Genome Atlas |
| TSS | = | Transcription start site |
| UC | = | Urothelial carcinoma |
| UTUC | = | Upper urinary tract urothelial carcinoma |
Author’s contributions
EA and YK conceived, designed, and supervised the study. TaY and YY developed the methodology. MF, EA, KT, AMM, HF, and TeY contributed to acquire the data. MF and YT contributed to analyze and interpret the data. MF, EA, and YK wrote, reviewed and/or revised the manuscript. All authors read and approved the final manuscript.
Supplemental Material
Download PDF (818.3 KB)Disclosure statement
No potential conflict of interest was reported by the author.
Supplementary material
Supplemental data for this article can be accessed here.
Additional information
Funding
References
- Rouprêt M, Babjuk M, Compérat E, et al. European association of urology guidelines on upper urinary tract urothelial carcinoma: 2017 update. Eur Urol. 2018;73:111–122.
- Akita H, Kikuchi E, Hayakawa N, et al. Performance of diffusion-weighted MRI post-CT urography for the diagnosis of upper tract urothelial carcinoma: comparison with selective urine cytology sampling. Clin Imaging. 2018;52:208–215.
- Messer J, Shariat SF, Brien JC, et al. Urinary cytology has a poor performance for predicting invasive or high-grade upper-tract urothelial carcinoma. BJU Int. 2011;108:701–705.
- Baylin SB, Jones PA. Epigenetic determinants of cancer. Cold Spring Harb Perspect Biol. 2016;8:a019505.
- Jones PA, Issa JPJ, Baylin S. Targeting the cancer epigenome for therapy. Nat Rev Genet. 2016;15:630–641.
- Makabe T, Arai E, Hirano T, et al. Genome-wide DNA methylation profile of early-onset endometrial cancer: its correlation with genetic aberrations and comparison with late-onset endometrial cancer. Carcinogenesis. 2019;40:611–623.
- Kuramoto J, Arai E, Tian Y, et al. Genome-wide DNA methylation analysis during non-alcoholic steatohepatitis-related multistage hepatocarcinogenesis: comparison with hepatitis virus-related carcinogenesis. Carcinogenesis. 2017;38:261–270.
- Arai E, Gotoh M, Tian Y, et al. Alterations of the spindle checkpoint pathway in clinicopathologically aggressive CpG island methylator phenotype clear cell renal cell carcinomas. Int J Cancer. 2015;137:2589–2606.
- Nishiyama N, Arai E, Nagashio R, et al. Copy number alterations in urothelial carcinomas: their clinicopathological significance and correlation with DNA methylation alterations. Carcinogenesis. 2011;32:462–469.
- Nishiyama N, Arai E, Chihara Y, et al. Genome-wide DNA methylation profiles in urothelial carcinomas and urothelia at the precancerous stage. Cancer Sci. 2010;101:231–240.
- Nakagawa T, Kanai Y, Ushijima S, et al. DNA hypomethylation on pericentromeric satellite regions significantly correlates with loss of heterozygosity on chromosome 9 in urothelial carcinomas. J Urol. 2005;173:243–246.
- Porten SP. Epigenetic Alterations in Bladder Cancer. Curr Urol Rep. 2018;19:102.
- Schulz WA, Goering W. DNA methylation in urothelial carcinoma. Epigenomics. 2016;8:1415–1428.
- The Cancer Genome Atlas Research Network. Comprehensive molecular characterization of urothelial bladder carcinoma. Nature. 2014;507:315–322.
- Tsumura K, Arai E, Tian Y, et al. Establishment of permutation for cancer risk estimation in the urothelium based on genome-wide DNA methylation analysis. Carcinogenesis. 2019;40:1308–1319.
- Jones PA, Liang G. Rethinking how DNA methylation patterns are maintained. Nat Rev Genet. 2009;10:805–811.
- Nakagawa T, Kanai Y, Ushijima S, et al. DNA hypermethylation on multiple CpG islands associated with increased DNA methyltransferase DNMT1 protein expression during multistage urothelial carcinogenesis. J Urol. 2005;173:1767–1771.
- Ohara K, Arai E, Takahashi Y, et al. Genes involved in development and differentiation are commonly methylated in cancers derived from multiple organs: a single-institutional methylome analysis using 1007 tissue specimens. Carcinogenesis. 2017;38:241–251.
- Larsen LK, Lind GE, Guldberg P, et al. DNA-methylation-based detection of urological cancer in urine: overview of biomarkers and considerations on biomarker design, source of DNA, and detection technologies. Int J Mol Sci. 2019;20:E2657.
- Moss TJ, Qi Y, Xi L, et al. Comprehensive genomic characterization of upper tract urothelial carcinoma. Eur Urol. 2017;72:641–649.
- Arai E, Miura F, Totoki Y, et al. Epigenome mapping of human normal purified hepatocytes: personal epigenome variation and genome-epigenome correlation. Epigenomics. 2018;10:955–979.
- Bibikova M, Le J, Barnes B, et al. Genome-wide DNA methylation profiling using Infinium® assay. Epigenomics. 2009;1:177–200.
- Komaki S, Shiwa Y, Furukawa R, et al. iMETHYL: an integrative database of human DNA methylation, gene expression, and genomic variation. Hum Genome Var. 2018;5:18008.
- Hachiya T, Furukawa R, Shiwa Y, et al. Genome-wide identification of inter-individually variable DNA methylation sites improves the efficacy of epigenetic association studies. NPJ Genom Med. 2017;2:11.
- Habuchi T, Takahashi R, Yamada H, et al. Metachronous multifocal development of urothelial cancers by intraluminal seeding. Lancet. 1993;342:1087–1088.
- Sidransky D, Frost P, Von Eschenbach A, et al. Clonal origin of bladder cancer. N Engl J Med. 1992;326:737–740.
- Kakizoe T. Development and progression of urothelial carcinoma. Cancer Sci. 2006;97:821–828.
- Jones TD, Wang M, Eble JN, et al. Molecular evidence supporting field effect in urothelial carcinogenesis. Clin Cancer Res. 2005;11:6512–6519.
- Yamanoi K, Arai E, Tian Y, et al. Epigenetic clustering of gastric carcinomas based on DNA methylation profiles at the precancerous stage: its correlation with tumor aggressiveness and patient outcome. Carcinogenesis. 2015;36:509–520.
- Arai E, Kanai Y, Ushijima S, et al. Regional DNA hypermethylation and DNA methyltransferase (DNMT) 1 protein overexpression in both renal tumors and corresponding nontumorous renal tissues. Int J Cancer. 2006;119:288–296.
- Yokoyama T, Miura F, Araki H, et al. Changepoint detection in base-resolution methylome data reveals a robust signature of methylated domain landscape. BMC Genomics. 2015;16:594.
- Suzuki MM, Bird A. DNA methylation landscapes: provocative insights from epigenomics. Nat Rev Genet. 2008;9:465–476.
- Yamamoto H, Watanabe Y, Oikawa R, et al. BARHL2 methylation using gastric wash DNA or gastric juice exosomal DNA is a useful marker for early detection of gastric cancer in an H. pylori-independent manner. Clin Transl Gastroenterol. 2016;7:e184.
- Rauch TA, Wang Z, Wu X, et al. DNA methylation biomarkers for lung cancer. Tumour Biol. 2012;33:287–296.
- Wu X, Rauch TA, Zhong X, et al. CpG island hypermethylation in human astrocytomas. Cancer Res. 2010;70:2718–2727.
- Ding Q, Chen H, Xie X, et al. BARHL2 differentially regulates the development of retinal amacrine and ganglion neurons. J Neurosci. 2009;29:3992–4003.
- Nagashio R, Arai E, Ojima H, et al. Carcinogenetic risk estimation based on quantification of DNA methylation levels in liver tissue at the precancerous stage. Int J Cancer. 2011;129:1170–1179.
- Yamada K, Ono M, Perkins ND, et al. Identification and functional characterization of FMN2, a regulator of the cyclin-dependent kinase inhibitor p21. Mol Cell. 2013;49:922–933.
- Li DJ, Feng ZC, Li XR, et al. Involvement of methylation-associated silencing of formin 2 in colorectal carcinogenesis. World J Gastroenterol. 2018;24:5013–5024.
- Ahmed SM, Thériault BL, Uppalapati M, et al. KIF14 negatively regulates Rap1a-Radil signaling during breast cancer progression. J Cell Biol. 2012;199:951–967.
- Yotani T, Yamada Y, Arai E, et al. Novel method for DNA methylation analysis using high-performance liquid chromatography and its clinical application. Cancer Sci. 2018;109:1690–1700.
- World Health Organization Classification of Tumours. Pathology and genetics of tumours of the urinary system and male genital organs. JN E, Sauter G, JI E, et al., editors. Lyon: IARC Press; 2004.
- Brierley JD, Gospodarowicz MK, Wittekind C, editors. TNM classification of malignant tumours, eighth edition. Oxford (UK): John Wiley & Sons, Inc.; 2017.
- Kanai Y, Nishihara H, Miyagi Y, et al. The Japanese Society of Pathology Guidelines on the handling of pathological tissue samples for genomic research: standard operating procedures based on empirical analyses. Pathol Int. 2018;68:63–90.
- Shen L, Guo Y, Chen X, et al. Optimizing annealing temperature overcomes bias in bisulfite PCR methylation analysis. Biotechniques. 2007;42:48–58.