
ABSTRACT
Estrogen (E2) regulates hundreds of genes involved in cell metabolism and disrupts iron homoeostasis in various cell types. Herein, we addressed whether E2-induced epigenetic modifications are involved in modulating the expression of iron-regulatory genes. Epigenetic status of FTH1 and TFRC genes was assessed in E2-treated cancer cells. E2-induced DNA methylation was associated with decreased FTH1 and TFRC expression in Hep-G2 and Huh7 cells, but not in AGS or MCF7 cells. Demethylation with 5-Aza-2-deoxycytidine upregulated the expression of both these genes in Hep-G2 cells. The expression of DNMT3B, PRMT5, and H4R3me2s increased in E2-treated cells. Chromatin immunoprecipitation showed that E2 treatment recruited PRMT5 and H4R3me2s on FTH1 but not on TFRC. Knockdown of PRMT5, DNMT3B, and Estrogen-receptor alpha rescued FTH1 from E2-induced silencing. However, knockdown of DNMT3B alone blocked the inhibitory effects of E2 on TFRC. Analysis of human liver tissues in publicly available datasets showed that FTH1 and TFRC are highly expressed in primary liver tumours, but a lower expression is associated with better survival. Interestingly, we showed that the silencing of FTH1 and/or TFRC inhibited carcinogenesis in Hep-G2 cells. For the first time, our findings uncovered the novel signalling pathway involved in the protective effects of E2 against liver cancer.
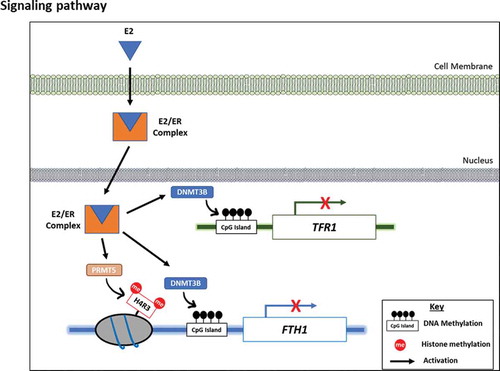
Graphical Abstract
Introduction
Hepatocellular carcinoma (HCC) is believed to be responsible for nearly 9.1% of total cancer-related deaths worldwide [Citation1]. Gender disparity in the incidence of HCC, being 2 to 4 times higher in males than in females [Citation2–4], has been attributed to the protective effects of Estrogen (17-β oestradiol; E2) in young women [Citation5]. Although anti-Estrogen therapy is commonly indicated for female-specific cancers such as breast or ovarian-uterine, numerous studies have demonstrated that E2 can precipitate protective anti-cancer effects as well. Premenopausal females with high circulating E2 are less prone to HCC or commonly show better recovery after treatment [Citation6]. E2 at physiological concentrations had shown to suppress chemically-induced liver carcinogenesis, attenuate leptin-induced Hep-G2 cell growth and inhibit testosterone-induced liver cancer cell proliferation [Citation7–9]. Additionally, E2 treatment was reported to reduce the incidence of invasive breast cancer in women with prior hysterectomy [Citation10,Citation11]. High-dose E2 treatment was reported to yield a positive outcome in >30% of breast cancer patients following long-term E2 deprivation [Citation3]. In phase 2 clinical trial, a daily dose of 6 mg of E2 treatment in women with advanced breast cancer showed higher clinical benefits and fewer adverse effects [Citation12]. Moreover, E2 treatment in patients with Estrogen receptor beta (ERβ)-positive gastric cancer was associated with lower tumour stage, suggesting that E2 is also protective against the invasiveness of gastric cancer [Citation13,Citation14]. There is an observation that E2 induces apoptosis in cancer cells [Citation8] through the intrinsic or extrinsic pathway [Citation6,Citation15]. Recently, a global transcriptome analysis study showed enhanced expression of apoptosis-related genes combined with the downregulation of genes related to cell proliferation in E2-treated Hep-G2 cells [Citation16]. These observations notwithstanding, the exact molecular mechanism(s) underlying the anti-cancer effects of E2 remains largely unknown.
Mounting evidence suggests that iron metabolism is disrupted in breast cancer cells as shown by an increased expression of hepcidin, transferrin receptor-1 (protein TFR1/gene TFRC) and ferritin heavy-chain-1 (FTH1) and reduced expression of the iron exporter ferroportin (FPN) [Citation17]. Disrupted iron metabolism in those cancer cells manifests as increased intracellular iron overload [Citation17], which was associated with increased oxidative stress, DNA damage and cell proliferation [Citation18,Citation19]. Changes in demand for iron and inflammation are the main regulators of iron homoeostasis at the cellular and systemic levels [Citation20,Citation21]. That said, there is evidence to suggest that E2 regulates iron metabolism by modulating the expression of key iron-regulatory genes (IRGs) including HAMP (the gene which encodes hepcidin) [Citation22,Citation23] and FPN [Citation24]. Therefore, E2 can dictate the direction of iron trafficking into or out of the cell. E2-induced switching to an iron release phenotype has recently been shown to lead to cell cycle arrest and reduced growth in MCF7 cells [Citation19]. Moreover, E2 in combination with Doxorubicin (Dox) has been recently reported to enhance the cytotoxic effects of Dox [Citation25].
The inhibitory effects of E2 on HAMP [Citation22,Citation23] or FPN [Citation24] expression has been attributed to the binding of E2-Estrogen receptor alpha (ERα) complex to Estrogen-responsive elements (EREs) in the promoter region of the respective gene. In many of these studies, however, the pattern of expression of other IRGs (FTH1, TFRC, and TFR2 among others) is almost uniformly incompatible with the iron release (reduced hepcidin or increased FPN expression) phenotype [Citation19]. This has raised the possibility that E2 may modulate the expression of IRGs other than HAMP and FPN by some other, yet to be identified, mechanisms. In this context, previous work has suggested that E2 induces epigenetic modifications that regulate gene expression in multiple tissues including the liver [Citation26,Citation27].
Herein, we addressed the question of whether E2-induced epigenetic changes are involved in modulating the expression of IRGs in the breast (MCF7), liver (Hep-G2, Huh7) and gastric (AGS) cancer cells. MCF7, Hep-G2, and Huh7 were used because they are responsive to E2 signalling and have been previously profiled in terms of the effect of E2 on various metabolic pathways including iron homoeostasis [Citation6–13]. To our knowledge, this is the first study to evaluate the possible role of E2-induced epigenetic regulation of IRGs in liver cancer. The possible involvement of ERα in E2-induced epigenetic modulation of IRGs and the functional consequences of the interplay between E2 and iron metabolism in liver cells was also evaluated.
Results
Candidate gene selection and E2-induced inhibition of FTH1 and TFRC/TFR1 expression
Based on the criteria outlined in the methods section regarding the selection of candidate IRGs that could be subject to E2-dependent epigenetic regulation, we identified FTH1 and TFRC genes as potential candidates meriting further evaluation. FTH1 and TFRC genes are IRGs that play major roles in iron homoeostasis [Citation28]. The mRNA levels of FTH1 and TFRC were significantly reduced in E2-treated Hep-G2 cells as compared with controls; the reduction was strongest at 6 hours’ post-treatment and at 20 nM E2 treatment (); **p < 0.001, *p < 0.01). E2 treatment also resulted in significantly decreased synthesis of FTH1 and TFR1 proteins in Hep-G2 cells as compared with controls, especially at 6 hours post-treatment with 20 nM E2 ()). A similar pattern of expression was observed for both genes in Huh7 cells ()). In contrast, MCF7 cells treated with 20 nM E2 for 6 hours showed a slight increase in the expression of FTH1 and TFRC ()). Additionally, AGS cells treated with 10 or 20 nM E2 for 6 hours showed a significant increase in FTH1 mRNA levels. A slight increase in TFRC mRNA levels was also evident especially at 20 nM E2 ()). This suggests that the inhibitory effects of E2 on FTH1 and TFRC gene expression are not universal but cell specific.
Figure 1. Expression patterns of FTH1 and TFRC genes in Estrogen (E2)-treated cancer cell lines. Hep-G2 cells treated with E2 for (a) different periods of time or (b) at different concentrations were assessed for the mRNA levels of FTH1 and TFRC by RT-PCR. (c) Lysates from Hep-G2 cells treated with 5, 10 or 20 nM E2 for 6 hours were assessed for FTH1 and TFR1 proteins expression by western blotting. Similarly, effect of E2 treatment on FTH1 and TFRC/TFR1 expression were analysed in (d, e) Huh7, (f) MCF7 and (g) AGS cell lines. Actin was used for normalization and as a loading control for western blotting. Only one representative figure, out of at least two independent experiments, is shown. In each bar graph, the data represent means ± SEM. *P < 0.01, and **P < 0.001 compared with control
E2-induced hypermethylation silences FTH1 and TFRC gene expression
To evaluate whether the inhibitory effects of E2 on FTH1 and TFRC gene expression are mediated by hypermethylation events at their promoter regions, qMSP was performed. Treatment of both Hep-G2 and Huh7, cells with E2 (20 nM) induced a significant increase in FTH1 and TFRC promotor methylation levels (); **p < 0.001, *p < 0.01). Levels of methylation were more pronounced in the case of TFRC as compared with FTH1. In contrast, treatment with the demethylating agent, 5-Aza-2-deoxycytidine (Aza), reversed the methylation-dependent inhibitory effects of E2 on the expression of FTH1 and TFRC. Moreover, while treatment with Aza followed by E2 maintained a state of methylation and suppressed the expression of FTH1 and TFRC genes, treatment with E2 followed by Aza nullified the methylation effect of E2. In the latter case, nullified methylation was associated with enhanced expression of FTH1 and TFRC genes (); **p < 0.001, *p < 0.01). Aza-induced demethylation also enhanced the expression of FTH1 and TFRC in MCF7 cells and that of only FTH1 in AGS cells ()). These findings suggest that E2-induced hypermethylation silences FTH1 and TFRC genes and that Aza-induced demethylation could positively affect the expression of IRGs.
Figure 2. DNA methylation patterns of FTH1 and TFRC genes in Estrogen (E2)-treated cancer cell lines. (a) Quantitative Methylation-specific polymerase chain reaction (qMSP) was used to assess DNA methylation in Hep-G2 cells following treatment with 20 nM E2 for 6, 12, 24 and 48 hours. (b, c) FTH1 and TFRC mRNA levels and DNA methylation status were assessed in Hep-G2 cells treated with 20 nM E2 (E20) alone, 1.0 µM 5-Aza-2-deoxycytidine (Aza) alone, Aza followed by E2 (A->E) or E2 followed by Aza (E->A). Similarly, the effect of E2 treatment on FTH1 and TFRC promoter methylation was analysed in (d) Huh7 cell lines. Further, the effect of demethylation treatment was assessed in (e) MCF7 and (f) AGS cell lines. In each bar graph, the data represent means ± SEM. *P < 0.01, and **P < 0.001 compared with control; NS represents ‘not significant’
E2-induced DNA methylation of FTH1 and TFRC genes is regulated by DNMT3B
Given that various members of the DNA methyltransferase (DNMTs) family of proteins mediate DNA methylation in humans, we evaluated the expression of three key DNMTs (DNMT1, 3A, and 3B) in Hep-G2 cells following E2 treatment. DNMT3B expression significantly increased upon treatment with E2 for 6 hours in a concentration-dependent manner ()). Compared with control cells, E2 treatment resulted in no significant change in DNMT1 expression; no DNMT3A was detected in treated or control Hep-G2 cells. The specificity of these antibodies was confirmed in MCF7 cells ()). Treatment with Aza reduced the expression of DNMT1 and DNMT3B in Hep-G2 cells. However, Aza treatment followed by E2 countered the inhibitory effects of Aza as evidenced by increased expression of DNMT3B ()). However, in MCF7 both, DNMT3A and 3B were found to be deregulated after long-term E2 treatment (data not shown). This suggested that DNMT3B plays a significant role in E2-induced DNA hypermethylation in Hep-G2 cells.
Figure 3. E2-induces DNA methylation through the activity of DNMT3B. (a, b) Lysates from Hep-G2 cells treated with 5, 10 or 20 nM E2 for 6 hours were assessed for DNMT1, DNMT3A and DNMT3B proteins by western blotting. The expression of all three proteins was also assessed in untreated MCF7 cells as external control. (c) Flow cytometry-based measurement of DNMT1 and DNMT3B proteins in Hep-G2 cells treated with 20 nM E2 alone, 1.0 µM 5-Aza-2-deoxycytidine (Aza) alone, Aza followed by E2 (A->E) or E2 followed by Aza (E->A). Only one representative figure, out of at least two independent experiments is presented. Relative protein expression was calculated and plotted as bar graph. Actin was used for normalization and as a loading control. In each bar graph, the data represent means ± SEM. *P < 0.01, and **P < 0.001 compared with control
E2-induced H4R3 methylation regulates FTH1, but not TFRC, expression
Hep-G2 cells were treated with increasing concentrations of E2 for 6 hours and 12 hours. In these cells, increased expression of total H4 and the type II histone arginine methyltransferase (PRMT5) were observed, mainly at 6 hours following E2. The expression of methylated H4R3 (H4R3me2s) significantly increased at 6 hours following treatment with 10 nM of E2 and at 12 hours after treatment with 20 nM of E2 ()). This raised the possibility that PRMT5 might be recruited to mediate histone methylation events that silence FTH1 and/or TFRC genes. To determine the protein–DNA interactions occurring in response to E2 treatment, chromatin immunoprecipitation (ChIP) was performed using specific antibodies to pull down PRMT5 and H4R3me2s proteins. E2 treatment (20 nM, 6 hours) resulted in an increased enrichment for FTH1 gene; this was especially true when FTH1 gene enrichment was assessed in DNA co-precipitated with PRMT5 or H4R3me2s (); **p < 0.001, *p < 0.01). In contrast, E2 treatment resulted in decreased enrichment for the TFRC gene, more so in the context of PRMT5 than H4R3me2s (); **p < 0.001, *p < 0.01). Gel electrophoresis of the PCR product further confirmed that E2 treatment increased FTH1 gene enrichment ()). On the other hand, DNA interaction of H4R3me2s or PRMT5 with TFRC gene was markedly reduced in E2-treated cells ()). This data suggested that E2-induced PRMT5-mediated methylation of H4 is a key regulator for FTH1 gene repression via chromatin remodelling near the FTH1 gene promoter, however, the TFRC gene expression was not regulated via PRMT5 as shown by a reduced PRMT5 and H4R3me2s interaction with the TFRC gene ().
Figure 4. PRMT5-dependent methylation of H4 (H4R3me2s) regulates FTH1 gene expression. (a) Lysates from Hep-G2 cells treated with 5, 10 or 20 nM E2 for 6 or 12 hours were assessed for H4R3me2s, and PRMT5 proteins; Actin was used as a loading control. Enrichment for (b) FTH1 gene and (c) TFRC gene fragments isolated by anti-H4R3me2s or anti-PRMT5 antibodies was assessed by qPCR and expressed as fold-change relative to the respective control. ChIP assay showing the interaction of H4R3me2s and PRMT5 proteins with (d) FTH1 gene and (e) TFRC gene fragments obtained from E2-treated and control Hep-G2 cells; isotype-matched negative antibody (IgG) is shown to left of each set, formaldehyde was used for crosslinking. Only one representative figure, out of at least two independent experiments is shown. In each bar graph, the data represent means ± SEM. *P < 0.01, and **P < 0.001 compared with control. (C: control, V: vehicle, and E2: Estrogen)
Differential epigenetic regulation of FTH1 and TFRC genes
To investigate the role of PRMT5 and DNMT3B in FTH1 and TFRC genes regulation, individual and combined siRNA knockdown assays targeting PRMT5 and DNMT3B were performed. Knockdown of PRMT5 associated with reduced expression of H4R3me2s, further confirming that PRMT5 is involved in E2-induced H4R3 methylation ()). The expression of FTH1 and TFR1 in E2-treated control and si-control cells was reduced compared to the expression of FTH1 and TFR1 in untreated control and si-control cells. Knockdown of PRMT5 and/or DNMT3B in control untreated cells did not have any effects on the de novo FTH1 or TFR1 expression. This might be because E2 is thought to be the main stimuli inducing epigenetic-induced silencing of FTH1/TFRC via DNMT3B and/or PRMT5. Hence, in untreated cells, the silencing of DNMT3B and/or PRMT5 will not affect FTH1 and TFR1 expression. Additionally, knockdown of DNMT3B alone blocked the inhibitory effects of E2 on FTH1 and TFR1 expression, knockdown of PRMT5 alone blocked the inhibitory effect of E2 on FTH1 but not TFR1 expression. However, knockdown of both DNMT3B and PRMT5 blocked the inhibitory effects of E2 on FTH1 and TFR1 expression ()), consistent with ChIP assay results. Later, qMSP performed on these siRNAs treated cells confirmed that knockdown of DNMT3A inhibits the E2-induced promoter methylation of both FTH1 and TFRC genes (), **p < 0.001). Overall, this suggested that E2-induced inhibition of FTH1 expression is dependent on histone and/or DNA methylation while inhibition of TFRC is only dependent on DNA methylation.
Figure 5. Differential E2-induced methylation events are required for FTH1 and TFRC silencing. (a) Expression status of H4R3me2s, total H4 and PRMT5 proteins in lysates obtained from E2-treated PRMT5-silenced Hep-G2 cells as well as treatment and silencing negative controls. (b) Expression status of FTH1, TFR1, DNMT3B and PRMT5 proteins in lysates obtained from E2-treated PRMT5 and/or DNMT3B-silenced Hep-G2 cells as well as treatment and silencing negative controls. (c) Next, these siRNAs treated cells were used to analyse DNA methylation of the promoter region of FTH1 and TFRC genes by qMSP. Only one representative figure, out of at least two independent experiments is shown. Actin was used for normalization and as a loading control. In each bar graph, the data represent means ± SEM. **P < 0.001 compared with E2 treatment. (C: control, V: vehicle, and E2: Estrogen)
E2-induces ERα-mediated epigenetic silencing of FTH1 and TFRC
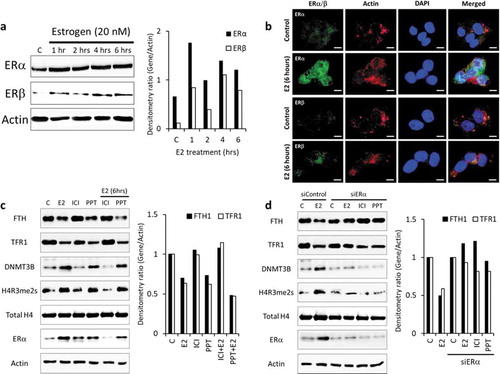
The effect of E2 on cells is mediated by E2 binding to its cytoplasmic receptors, ERα and/or ERβ. To investigate the expression of these receptors, we treated Hep-G2 cells with E2 (20 nM) for up to 6 hours and evaluated ER expression by western blotting. We show that untreated Hep-G2 cells express more ERα and that this expression increases with E2 treatment. In contrast, the expression of the ERβ was much reduced in both control and E2-treated Hep-G2 cells ()). Further, by immunofluorescence microscopy, we show that E2 (20 nM) treatment at 6 hours not only increased the expression of ERα but also enhanced its nuclear translocation. However, the effect of E2 treatment did not show the same effect on ERβ ()). Suggesting that the observed effects of E2 in Hep-G2 cells are mediated through E2-ERα signalling.
To show that the E2-ERα complex is involved in regulating FTH1 and TFRC silencing in Hep-G2 cells, we treated the cells with ER antagonist (ICI), ERα agonist (PPT) and siRNA to knock-down ERα. Cells treated with ICI alone or in combination with E2 shows a reduced expression of ERα, H4R3me2s, and DNMT3B, and expression of FTH1 and TFR1 was unchanged compared to control ()). Increased expression of ERα, H4R3me2s, and DNMT3B, and reduced expression of FTH1 and TFR1 is seen in cells treated with PPT alone or E2 plus PPT ()). Furthermore, knockdown of ERα in Hep-G2 cells failed to show E2-induced H4 methylation (reduced H4R3me2s) and DNMT3B expression. Similarly, E2 treatment of ERα-knockdown Hep-G2 cells did not show E2-induced inhibition of FTH1 and TFR1 in these cells ()). Hence this data signifies the role of ERα activated by E2/E2 agonist in mediating the epigenetic silencing of FTH1 and TFRC in Hep-G2 cells.
Figure 6. E2/ER agonist-induces Estrogen-receptor alpha (ERα)-mediated DNA and histone methylation silencing of FTH1 and TFR1. (a) Protein expression status of ERα and ER-beta (ERβ) upon E2-treatment was assessed by western blotting. (b) Expression and nuclear translocation of ERα and ERβ in Hep-G2 cells treated with E2 (20 nM, 6 hours) were assessed by immunofluorescence microscopy. ERα/β were labelled with Alexafluor®488 (Green), Actin was labelled with Alexafluor®680 (Red) to show the cytoplasm and nucleus was labelled with DAPI (Blue). Images were taken at 100X magnification; scale bar represents 20 µm (white bar). (c) Expression status of FTH1, TFR1, H4R3me2s, total H4 and DNMT3B in Hep-G2 cells treated with E2 (20 nM), ICI (10 µM) and PPT (1 µM), alone or in combination, all for 6 hours. (d) Expression status of FTH1, TFR1, H4R3me2, total H4, and DNMT3B in ERα-silenced (siERα) Hep-G2 cells treated with E2 (20 nM), ICI (10 µM) and PPT (1 µM) for 6 hours. Only one representative figure, out of at least two independent experiments is shown. For western blotting images, the densitometry ratio was calculated to show quantitative protein expression relative to control. Actin was used for normalization and as a loading control
Functional consequences of FTH1 and TFRC silencing in Hep-G2 cells
To evaluate the consequences of silenced FTH1 and TFRC gene expression in Hep-G2 cells, siRNA silencing (at 15 and 30 pmol) of FTH1 and/or TFRC genes ()) disrupted intracellular iron metabolism as evidenced by intracellular iron overload in transfected cells as compared with controls ()). Additionally, FTH1- and/or TFRC-silenced Hep-G2 cells experienced cell cycle arrest at the G2-M phase especially at 15 pmol siRNA ()). Significant levels of apoptosis (50%) were also observed in FTH1- and TFRC-silenced cells as compared with controls (12.8%) ()). Similarly, E2 treatment alone also showed disruption of iron metabolism, cell cycle arrest and significant apoptosis (). To confirm whether enhanced oxidative stress was associated with anticancer effects of E2, total cellular ROS level was measured in Hep-G2 cells transfected with siRNA (siFTH1, siTFRC or siERα) with or without E2 (20 nM) treatment. The data suggested increased ROS production in cells treated with siFTH1 and/or siTFRC with or without E2 and this effect was abolished in cells transfected with siERα (Supplementary figure S1a). Silencing of FTH1, TFRC or ESR1 (ERα) was associated with reduced cell proliferation at 72 hours’ post-transfection (). Lastly, we performed apoptosis, cell growth and ROS assay in Hep-G2 cells transfected with siRNA for ERα and co-treated with E2 (20 nM). The results showed a complete reversal of the inhibitory effect of E2, confirming the role of ERα (Supplementary Fig. S1). Taken together, these observations suggest that FTH1 and TFR1 are critically required for the proper growth and survival of liver cancer cells. Hence E2-induced epigenetic silencing of these two genes might be a protective mechanism against carcinogenesis.
Figure 7. The silencing of FTH1 and/or TFRC disrupts intracellular iron metabolism and induces adverse consequences in Hep-G2 cells. (a) Expression status of FTH1, TFR1 proteins in lysates obtained from Hep-G2 cells transfected with 15 or 30 pmol of siRNA against FTH1 and/or TFRC genes. Cells were harvested and lysates were prepared at 48 hours’ post-transfection. Data shown are representative of at least two separate experiments; Actin was used as a loading control. (b) Labile iron content in FTH1- and/or TFRC-silenced Hep-G2 cells using the CA-AM/CA-AM+DFO-staining based flow cytometry and expressed as %∆MFI as explained in the methods section. (c) Cell cycle phase distribution in FTH1- and/or TFRC-silenced Hep-G2 cells; transfection control cells were analysed for comparison. (d) Mean ± SD of percentage apoptosis in FTH1- and/or TFRC-silenced Hep-G2 cells as compared with controls at 48 hours’ post-transfection based on two separate experiments. (e) Cell growth in FTH1- and/or TFRC-silenced Hep-G2 cells as observed by Bright filed microscopy imaging at 72 hours’ post-transfection. Images were taken at a 20X magnification. (f) Mean ± SD of percentage cell growth in FTH1- and/or TFRC-silenced Hep-G2 cells at 24, 48 and 72 hours of post-transfection. For each experiment, E2 (20 nM) treated Hep-G2 cells were used to compare its effect on labile iron, cell cycle arrest, apoptosis, and cell growth. Data shown are representative of at least two separate experiments. *P < 0.01, and **P < 0.001 compared with siControl
FTH1 and TFRC are highly expressed in human primary liver tumours and a lower expression is associated with better survival
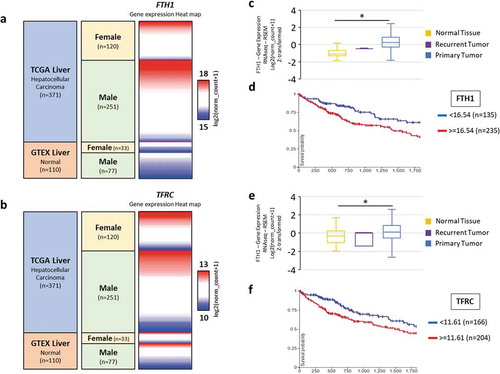
The in vitro findings in this study are fully supported by FTH1 and TFRC gene expression analysed using GTEX and TCGA data sets. Both FTH1 and TFRC are highly expressed in human primary liver tumours compared with those in normal liver tissues. For both the genes, the heat map shows the expression of FTH1/TFRC in the TCGA hepatocellular carcinoma and GTEX normal liver in relation to patients’ gender. High expression of FTH1 was observed in 56.5% of males versus 48.3% of females, and high expression of TFRC was seen 52.2% of males versus 51.6% of females. A slightly smaller number of females showed high FTH1 and TFRC expression in hepatocellular carcinoma samples as compared with that in males; possibly due to the inhibitory effects of high E2 in females (). The Z-score for FTH1 in normal liver tissue is −1.14 versus 0.245 for primary liver tumour and survival probability was reduced to less than 50% over 5 years when higher FTH1 expression (*p < 0.0001; ). Similarly, for TFRC, the Z-score of normal liver tissue is −0.286 versus 0.123 for primary liver tumour and this high TFRC expression is also associated with a ~ 50% reduction in patient survival rate to over 5 years. (; *p < 0.0001). Additionally, the TCGA and GTEX datasets were evaluated for the expression of the ESR1 gene in primary liver tumours. The analysis showed significantly lower ESR1 expression in tumour samples compared to the normal liver (Supplementary figure S2). This suggests that tumour cells may downregulate ESR1 expression as a way of evading the inhibitory effects of E2.
Figure 8. Expression of FTH1 and TFRC gene in human liver tissue. A total of 481 cases (110 normal livers and 371 Hepatocellular carcinomas including 2 recurrent tumours and 369 primary liver tumour) from GTEX and TCGA datasets were included in this analysis. (a, b) Heat maps showing datasets, sample types, gender demographics and gene expression profile across those tissue samples. Red and blue colours represent high and low expression, respectively. (c-f) Boxplots were generated to compare the gene expression in normal versus tumour samples and Kaplan-Meier (KM) survival plot was generated for both the genes to analyse overall survival in these patients with a 5-years follow-up threshold. (c) FTH1: Z-score of normal liver tissue: −1.14 vs primary liver tumour: 0.245 (*p < 0.0001). (e) TFRC: Z-score of normal liver tissue: −0.286 vs primary liver tumour: 0.123 (*p < 0.0001). (Figures were generated by analysis of the datasets using UCSC Xena browser)
Discussion
In this study, we showed that E2 disrupts intracellular iron homoeostasis by downregulating the expression of FTH1 and TFRC genes in Hep-G2 and Huh7 cells but not in MCF-7 or AGS cells; suggesting that this effect of E2 is tissue/cell-specific. This was consistent with previous work, which has established that E2 treatment differentially alters the expression of key iron metabolism-related genes in different types of cells [Citation29]. Our findings suggest that E2-induced suppression of FTH1 and TFRC expression is DNA methylation and/or histone methylation-dependent. Previous work has shown that E2 treatment disrupts iron metabolism by either downregulating hepcidin synthesis in MCF7 and SKOV-3 cells [Citation25] or upregulating hepcidin synthesis in Hep-G2 cells [Citation30]. Other studies have demonstrated that E2 disrupts iron metabolism by downregulating the expression of FPN in PMA-differentiated THP-1 cells [Citation24].
Findings presented here are consistent with previous studies that have demonstrated that E2 regulates iron metabolism in different types of cells including breast (MCF7 and MDA-MB-231), liver (Hep-G2) and ovarian (SKOV3) cancer cells by directly downregulating HAMP and FPN expression [Citation25]. The inhibitory effects of E2 on HAMP and FPN gene expression were attributed to direct E2-ER complex interaction with EREs in the respective gene promoters [Citation22–24]. Our findings are consistent with previous work, which has demonstrated that E2 treatment reduces expression of the key IRGs, such as inhibition of hepcidin synthesis by upregulating the expression of the hypoxia-inducible factor 1 (HIF-1α) [Citation31,Citation32]. In vivo studies using ovariectomized mice have also demonstrated that E2 disrupts intracellular iron metabolism by upregulating the expression of hepatic FPN [Citation24] or HAMP gene expression [Citation30]. Moreover, E2 was reported to modulate the expression of multiple genes involved in iron metabolism in the uterine tissue [Citation33,Citation34].
E2 binds to ER and translocates into the nucleus where it recognizes Estrogen response elements located near the promoter region of target genes. Intracellular localization of the E2-ER complexes could act as a transcription factor or activate other nuclear proteins as a means of regulating target genes [Citation35]. QcGenomics analysis of the ChIP-seq data set (GSM1263819) of liver tissue obtained from ovariectomized-mouse treated with E2 revealed the presence of E2-ERα binding sites in both FTH1 and TFRC genes [Citation36]. We show that Hep-G2 cells are expressing more ERα than ERβ and that this expression increases with E2 treatment. Furthermore, with the use of ER agonists and antagonists, we show that ERα activation mediates DNA and histone methylation. Also, by the siRNA knockdown of ERα, we confirm that ERα is required for E2-induced epigenetic silencing FTH1 and TFRC genes.
Epigenetic mechanisms such as DNA methylation and histone modifications can regulate gene expression [Citation37,Citation38]. To our knowledge, this is the first study to demonstrate that E2-induced epigenetic modifications, which include both DNA and Histone methylation, are involved in the regulation of intracellular iron metabolism. Studies have suggested that DNA methylation may or may not influence histone modification, or it could be vice versa. Histone methyltransferases are found attached to methyl-CpG-binding proteins [Citation39], or methylation of histones can recruit DNMTs inducing gene promoter hyper-methylation [Citation40–42]. Zhao et al., showed that methylation of histone served as a target for binding of DNMT3A, leading to promoter methylation of the β-globin gene in the human myelogenous leukaemia cell line [Citation43]. Our data showed that E2-induced FTH1 inhibition was dependent on both, H4R3 methylation via PRMT5 and DNA methylation via DNMT3B, However, E2-induced TFRC silencing is only dependent on DNMT3B-mediated DNA methylation (Graphical Abstract).
Numerous reports have addressed the issue of epigenetic regulation of iron metabolism in the liver, breast, and other human cancers [Citation44]. Previous work has shown that iron chelation downregulates the synthesis of several chromatin remodeling proteins including the histone H3K9 demethylase Jumonji domain-containing protein 2A in MCF7 and MDA-MB-231 cells and the H3K4 demethylase lysine-specific demethylase 1 in MDA-MB-231 cells [Citation45]. Furthermore, it has been reported that Aza-induced demethylation increased TFR2 and hepcidin expression in the Huh7 cell line [Citation46]. We also found that E2 treatment to Huh7 cells downregulates FTH1 and TFRC expression and showed an increase in methylation levels in the promoter regions of both the genes. Deletion of Methyl-CpG binding domain protein 5 (Mbd5), which encodes a member of the methyl-CpG binding domain under the control of the lysine acetyltransferase KAT2A, was also reported to induce H4 acetylation near the FTH1 promoter, reduce FTH1 mRNA levels and precipitate iron overload in the liver and serum in Mbd5(-/-) mice [Citation47]. Taken together, these findings suggest that epigenetic modifications at the histone or DNA levels could regulate the expression of multiple key IRGs.
Our findings also demonstrated that the silencing of FTH1 and/or TFRC was associated with disrupted cell cycle, increased ROS levels, reduced growth and enhanced apoptosis in Hep-G2 cells. Abnormally increased percentage of cells in the G2/M phase in FTH1/TFRC silenced Hep-G2 cells is indicative of the increased percentage of cells that may become apoptotic unless stressors like oxidative stress and DNA damage are relieved [Citation48]. This is consistent with the fact that the storage of intracellular iron by ferritin and reducing iron import through TFR1 are key protective mechanisms against oxidative stress and cellular damage [Citation49]. Reduced FTH1 expression has been shown to precipitate iron overload and oxidative damage in liver cells [Citation46]. TFRC knockout in mice was reported to associate with catastrophic consequences in various tissues including the liver [Citation50]. Similar to our findings, Babu et al. showed that TFR1 knockdown decreased HCC cell proliferation [Citation51].
Bioinformatics analyses showed that both FTH1 and TFRC are highly expressed in primary liver tumours relative to normal liver tissue and that male liver tumours express both genes at higher levels than liver tumours in females. Higher expression of these two genes in liver tumours is suggestive of oncogenic activity in the form of increased cell survival. Consistent with the observation that E2 signalling exerts a negative effect on FTH1 and TFRC gene expression. In that, elevated levels of E2 may protect premenopausal women against hepatocellular cancers [Citation5–9] possibly by suppressing the expression of FTH1 and TFRC; among other genes of oncogenic potential. This is in line with previous work which has shown that upregulated expression of FTH1 alters the expression of tumour suppressor genes and micro-RNAs that modulate multiple metabolic pathways in cancer cells [Citation52–54].
In conclusion, numerous studies have established that HCC is far more prevalent in males than in females and that E2 plays a protective role against HCC in premenopausal women [Citation2–4]. E2 replacement therapy was reported to associate with reduced risk of HCC and increased overall survival of HCC patients [Citation55]. Moreover, the treatment of liver cancer cells with E2 or ER agonists has been reported to suppress cell growth by regulating genes related to apoptosis, cell cycling, and metabolism [Citation16]. Therefore, the ability of E2 to induce epigenetic silencing of FTH1 and TFRC genes in liver cells may -at least- partially explain the protective effects of E2 against the carcinogenic transformation of hepatocytes in premenopausal women.
Materials and methods
Cell lines and treatment protocols
Human hepatoblastoma-derived (Hep-G2; RRID: CVCL_0027) cell line (CLS Cell Lines Service GmbH, Eppelheim, Germany) was used as the main cell line in this study. Hepatocellular carcinoma (Huh7; RRID: CVCL_0336), Human gastric cancer (AGS; RRID: CVCL_0139) and breast adenocarcinoma (MCF7; RRID: CVCL_0031) cell lines (all from CLS Cell Lines Service GmbH) were used as additional cell lines. All cell lines were mycoplasma-free cells and were authenticated using short tandem repeat (STR) genotyping within the last three years and were verified to be identical with the STR profile in comparing databases (CLS Cell Lines Service GmbH). Cells were maintained in appropriate media (DMEM or RPMI 1460) supplemented with 2 mM Glutamine, 1 mM sodium pyruvate, 10% FBS, 1% antibiotics (penicillin/streptomycin) (all from Sigma Aldrich, St. Louis, MO, USA) at 37° C and 5% CO2. Cells were seeded at 5 × 10⁵ cells/ml in 25 cm2 flasks; at ~70% confluency cells were treated with 17-β oestradiol (E2) (Sigma Aldrich) at 5, 10 or 20 nM diluted in 70% ethanol and cultured for 6 hours up to 48 hours. Cells were also treated with Propyl pyrazole triol (PPT) at 1 µM, an ERα selective agonist with 410-fold selectivity for ERα over ERβ [Citation56] and ICI182,780 (ICI) at 10 µM, a high-affinity ER antagonist [Citation57] (both from Tocris Bioscience, Bristol, United Kingdom). Control cells were either left untreated or treated with an equal volume of 70% ethanol as the vehicle. For all the experiments, results were normalized to the effects of cell culture media on the control cells. Hence, this excluded the effects of any trace amounts of Estrogen that might be present in the cell culture media.
Selection criteria for candidate IRGs responsive to E2
To analyse the presence of CpG islands (CGI) in the promoter region of IRGs, we used publicly available database University of California Santa Cruz Genome Browser (http://genome.ucsc.edu/) on GRCh38/hg38 assembly (Genome Reference Consortium). At first, the key IRGs (Supplementary Table 1) were filtered based on the presence of CGI at least 200bp upstream of transcription start site with GC content of >50%, length >200bp and ratio >0.6 of observed/expected number of CG dinucleotides and based on the number of Gs and Cs in the DNA segment [Citation58]. Genes fulfiling these criteria were analysed for their interactivity with E2 using the Comparative Toxicogenomics Database (http://ctd.mdibl.org/), and for the presence of iron response elements (IRE) in the gene coding sequence of those genes using the IRE Prediction Server (http://ccbg.imppc.org/sires/index.html).
Quantitative real-time reverse transcription (RT)-PCR
Total RNA and genomic (g)DNA were extracted using Allprep DNA/RNA mini kit (Qiagen, Hilden, Germany). Complementary cDNA was synthesized using the QuantiTect Reverse Transcription Kit (Qiagen) from 1 μg of RNA according to the manufacturer’s protocol. RT-PCR was performed using 1 μl of cDNA, specific primers (Supplementary Table 2), Promega GoTaq® qPCR Master Mix (Promega, Madison, WI, USA) and Qiagen Rotor-gene qPCR machine (Qiagen). Expression levels of target genes were normalized to GAPDH. GAPDH expression Ct value was always within 0.5 cycles if derived from the same cDNA sample, and cDNA samples from different treatment varied only by 1–2 cycles between samples. To ensure accurate normalization on every real-time assay, the ‘gene of interest’ amplification data was always normalized with housekeeping data derived from the same cDNA sample.
Quantitative Methylation-specific PCR (qMSP), and de-methylation treatment
An aliquot of genomic DNA (gDNA; 2 µg) was treated with EpiTect Bisulphite Kit (Qiagen). qMSP was conducted using 1 µl of the sodium bisulphite-treated DNA, primers specifically designed for methylated and unmethylated DNA sequence of the promoter region of FTH1 and TFRC genes (Supplementary Table S2), Promega GoTaq® qPCR Master Mix (Promega) and Qiagen Rotor-gene qPCR machine (Qiagen). Fully methylated and fully unmethylated control DNAs were purchased from Qiagen and were used as positive and negative controls respectively. DNA methylation levels were calculated, and de-methylation treatment was performed using 1.0 µM 5-Aza-2ʹ-deoxycytidine (Aza), both were described previously [Citation59].
Western blotting
Cells were lysed with ice-cold radio-immunoprecipitation assay buffer containing protease cocktail inhibitor tablets (Sigma). Whole-cell lysate protein concentration was quantified using the standard Bradford method (BioRad, Hercules, CA, USA). Lysate aliquots containing 30 µg protein were separated by SDS-PAGE gel electrophoresis and transferred onto a Polyvinylidene difluoride membrane (BioRad). The membrane was blocked with 5% skimmed milk powder (Sigma) for 1 hour at room temperature, washed with T-TBST and reacted with primary antibody (anti-FTH1, anti-TFR1, anti-DNMT1, anti-DNMT3A, anti-DNMT3B, anti-PRMT5, anti-Histone H4, anti-Histone H4R3me2s, anti-ERα and anti-ERβ (all antibodies from Abcam, Cambridge, UK) at 1:1000 dilution overnight at 4° C. The specific Horseradish Peroxidase-labelled secondary antibodies (Abcam) were then reacted with the membrane at 1:4000 dilutions for 1 hour at room temperature. Chemiluminescence was detected using Enhanced Chemiluminescence western blotting detection reagent (BioRad). Actin was used as the standard for western blotting.
Chromatin immunoprecipitation (ChIP) assay and qPCR
ChIP assay was performed using SimpleChIP Plus Enzymatic Chromatin IP Kit according to the manufacturer’s protocol (Cell Signalling Technology, Danvers, MA, USA). Briefly, cells were crosslinked with 1% formaldehyde for 15 minutes at room temperature and then treated with micrococcal nuclease to obtain fragments with a length of ~150-1000 base pairs. Fragmented chromatin was incubated with ChIP-grade antibodies (Anti-Histone H4R3me2s and Anti-PRMT5 antibody – Abcam). Normal rabbit IgG was used as an internal negative control. Purified immune-precipitated chromatin, input chromatin, and control-IP (IgG) were subjected to PCR amplification for the candidate genes. The binding patterns were examined by qPCR as described above using the primer sequences (Supplementary Table 2). Immunoprecipitated chromatin binding affinity was normalized to that of input chromatin using the formula ‘2 – Ct IP – Ct input’. Binding affinity enrichment for the gene of interest or known positive control region was normalized using the formula: Enrichment = gene of interest or positive control/negative control region. Amplified DNA was also visualized using 2% agarose gel electrophoresis.
RNA interference
Silencer Select small interfering RNA (siRNA) for knock-down of target genes (DNMT3B ‘s4221’, PRMT5 ‘s20375’, ESR1/ERα ‘s4824’, FTH1 ‘s5385’, and TFRC ‘s725’) were purchased from Thermo Fisher Scientific (Waltham, MA, USA). These Silencer Select siRNAs are pre-designed and pre-validated for 100-fold potency and 90% less off-target effects. The reverse transfection method was used to perform high-throughput transfection. Lipofectamine 2000 and Opti-MEM Reduced Serum Medium (Thermo Fisher) were used to transfect siRNA at a final concentration of 100 nM. Silencer Select Negative Control siRNA (Thermo Fisher, catalogue number: 4390843) was used as a negative control.
Immunofluorescence
Hep-G2 cells were seeded at 104/ml on sterile poly-L-lysine-coated glass coverslips in 12-well culture plates. After treatment with E2 (20 nM, 6 hours) cells were washed with PBS and fixed with 4% paraformaldehyde for 15 min at room temperature and treated with 0.1% Triton X-100 for 10 min. Fixed and permeabilized cells were blocked with BSA at 3% for 1 hour, rinsed with 1X PBS and incubated with unlabelled primary antibodies at 1:250 overnight at 4° C. Cells were then washed with 1X PBS and reacted with the Alexafluor®488- or Alexafluor®680-labelled secondary antibody (Abcam) for 1 hr at 37° C; excess reagent was rinsed with 1X PBS. Mounting media with ProLong gold antifade mountant with 4′,6′-diamidino-2-phenylindole (DAPI) (Invitrogen, Carlsbad, CA, USA) was added to stain the nucleus. Slides were visualized by fluorescence microscopy using an Olympus BX51 fluorescence microscope (Olympus Corporation, Tokyo, Japan).
Measurement of the intracellular labile iron pool (LIP)
Intracellular LIP was qualitatively assessed as previously described [Citation19]. Briefly, after the treatment cells were washed twice with PBS; an equal amount of cell from each sample was incubated for 15 minutes at 37° C in the presence of 0.125 μM calcein acetoxymethyl ester (Sigma-Aldrich), or incubated for 15 minutes at 37° C with desferrioxamine methanesulfonate, (Novartis, Switzerland) at 100 mM, or both together. After wash, cells were analysed by flow cytometry (BD FACSAria III; Becton-Dickinson, Franklin Lakes, NJ, USA) at a rate of 1000 events/second applying a 488-nm laser beam for excitation. A minimum of 25,000 events was collected/sample, and the percentage of cells staining positive was computed to the 99% level of confidence.
Apoptosis assay
Approximately 1 × 10⁵ cells collected at 48 hours post-transfection were re-suspended in 500 μl of Annexin-V (1X) Binding Buffer (Biolegend, USA). Cells were reacted with 5 µl of Annexin V-FITC and 5 μl 7-Aminoactinomycin D (7AAD) and incubated at room temperature for 15 minutes in the dark. Analysis with Flow cytometer (FACSAria III, BD) was performed using the FITC channel (515 nm) and 7AAD at PerCP detector (640 nm); 30,000 events/sample were collected for the analysis. Compensation was performed by using single-colour controls for Annexin FITC and 7AAD. Data were analysed using FLOWJo or FACSDiva software.
Cell proliferation assay
Cell proliferation was evaluated for up to 72 hours post-transfection using Cell Counting Kit-8 (CCK-8; by Dojindo, Rockville, MD, USA) according to the manufacturer’s instructions and as described previously [Citation60]. Since the CCK-8 assay contains highly water-soluble tetrazolium salt and is based on the dehydrogenase activity detection in viable cells, this assay was used to measure the number of viable cells over a period after treatment. Briefly, 5000 cells/well were dispensed in a 96-well plate. After 24 hours of incubation, cells were washed with PBS for three times and fresh medium was added. The cells were then treated with various concentrations of siRNA’s and E2 for the stated time point. At the endpoint, CCK-8 reagents were added and optical density (OD) was measured at 450 nm using a microplate reader. Results were analysed after correction with OD from blank and untreated wells. The OD was calculated as an absorbance unit (AU). Data is expressed as a percentage of viable cells. Bright-field microscopy was used to obtain cell images at 72 hours post-transfection.
Cell cycle analysis
At 48 hours’ post-transfection, 1 × 10⁶ cells harvested/sample were fixed dropwise with ice-cold 70% ethanol and incubated at 4° C overnight. Fixed cells were washed twice with PBS, labelled with Propidium Iodide and RNAse and incubated at room temperature for 20 minutes. Samples were analysed by flow cytometry (BD Accuri C6; Becton-Dickinson, Franklin Lakes, NJ, USA); data were collected on FL3 detector or PI channel on a linear scale. Doublet discrimination was performed by PI area vs height (FlowJo LLC, Ashland, OR, USA).
Measurement of ROS
The total cellular ROS level was measured using 2′,7′-Dichlorofluorescin diacetate (DCFDA) dye (Sigma Aldrich). Hep-G2 cells transfected with siRNA for FTH1, TFRC or ERα, with or without E2 (20 nM) treatment were stained with 15 μM DCFDA for 15 min at 37°C. H2O2 (200 μM) treatment was used as a positive control. The cells were then subjected to fluorescence measurement at an excitation wavelength of 492 nm and emission of 520 nm using Synergy™ HTX Multi-Mode Microplate Reader (BioTek Instruments, VT, USA).
Gene expression analysis in human liver tissue samples using publicly available datasets
Bioinformatics analyses were performed based on the TCGA and GTEX cohort using the UCSC Xena Browser (https://xenabrowser.net/). Data from a sample set of 110 cases of normal liver, 2 cases of the recurrent tumour and 369 cases of the primary liver tumour samples were included in gene expression profiling and are shown as heat-maps and boxplots. Z-score was generated to assess differential expression of FTH1 and TFRC genes in normal versus primary liver tumour tissues. Kaplan-Meier survival plot was generated for the same samples to analyse overall survival in these patients with a 5-years follow-up threshold.
Statistical analysis
Student’s t-test was used to evaluate the significance of differences between two samples (control versus treated); Microsoft Excel 2018 (Microsoft Office, 2018) was used for all statistical calculations. At least two independent replicates were assessed in each experiment, and pooled data were presented as mean ± SEM. A p-value of <0.01 was considered significant. For protein expression, one representative image out of at least two independent experiments is presented. Quantification analysis of western blotting data was performed using ImageJ software. One-way ANOVA was used to compare the means of sample groups analysed by UCSC Xena. A p-value of <0.0001 was considered significant.
Author contributions
Conceptualization, J.S.M. and M.H.; methodology, J.S.M.; software, J.S.M.; validation, J.S.M.; formal analysis, J.S.M. and K.B.; investigation, J.S.M., K.B. and J.S.; data curation, J.S.M., K.B. and J.S; original draft preparation, J.S.M.; review and editing, J.S.M. and M.H.; funding acquisition, J.S.M. and M.H. All authors have read and agreed to the published version of the manuscript.
Supplemental Material
Download MS Word (18.1 KB)Supplemental Material
Download MS Word (93.3 KB)Acknowledgments
We wish to thank Dr. Ghalia Khoder for making available the AGS cell line, Mr. Manju N. Jayakumar and Ms. Hema Unnikannan for their technical assistance and the Sharjah Institute for Medical Research for their generous in-house support.
Disclosure statement
The authors declare no conflict of interest.
Supplementary material
Supplemental data for this article can be accessed here.
Additional information
Funding
References
- Torre LA, Bray F, Siegel RL, et al. Global cancer statistics, 2012. CA Cancer J Clin. 2015;65(2):87–108.
- Wands J. Hepatocellular carcinoma and sex. N Engl J Med. 2007;357(19):1974–1976.
- Liu P, Xie SH, Hu S, et al. Age-specific sex difference in the incidence of hepatocellular carcinoma in the United States. Oncotarget. 2017;8(40):68131–68137.
- Yeh SH, Chen PJ. Gender disparity of hepatocellular carcinoma: the roles of sex hormones. Oncology. 2010;78(Suppl 1):172–179.
- Qiu S, Vazquez JT, Boulger E, et al. Hepatic estrogen receptor alpha is critical for regulation of gluconeogenesis and lipid metabolism in males. Sci Rep. 2017;7(1):1661.
- Jordan VC. The new biology of estrogen-induced apoptosis applied to treat and prevent breast cancer. Endocr Relat Cancer. 2015;22(1):R1–31.
- Naugler WE, Sakurai T, Kim S, et al. Gender disparity in liver cancer due to sex differences in MyD88-dependent IL-6 production. Science. 2007;317(5834):121–124.
- Shen M, Estradiol SH. Estrogen receptor agonists oppose oncogenic actions of leptin in HepG2 cells. PLoS One. 2016;11(3):e0151455.
- Xu Z, Liu J, Jianxin C, et al. 17beta-Estradiol inhibits testosterone-induced cell proliferation in HepG2 by modulating the relative ratios of 3 estrogen receptor isoforms to the androgen receptor. J Cell Biochem. 2018;119(10):8659–8671.
- LaCroix AZ, Chlebowski RT, Manson JE, et al. Health outcomes after stopping conjugated equine estrogens among postmenopausal women with prior hysterectomy: a randomized controlled trial. JAMA. 2011;305(13):1305–1314.
- Early Breast Cancer Trialists’ Collaborative G. Effects of chemotherapy and hormonal therapy for early breast cancer on recurrence and 15-year survival: an overview of the randomised trials. Lancet. 2005;365(9472): 1687–1717. .
- Ellis MJ, Gao F, Dehdashti F, et al. Lower-dose vs high-dose oral estradiol therapy of hormone receptor-positive, aromatase inhibitor-resistant advanced breast cancer: a phase 2 randomized study. JAMA. 2009;302(7):774–780.
- Ryu WS, Kim JH, Jang YJ, et al. Expression of estrogen receptors in gastric cancer and their clinical significance. J Surg Oncol. 2012;106(4):456–461.
- Fan P, Griffith OL, Agboke FA, et al. c-Src modulates estrogen-induced stress and apoptosis in estrogen-deprived breast cancer cells. Cancer Res. 2013;73(14):4510–4520.
- Mobley JA, Brueggemeier RW. Estrogen receptor-mediated regulation of oxidative stress and DNA damage in breast cancer. Carcinogenesis. 2004;25(1):3–9.
- Shen M, Cao J, Shi H. Effects of estrogen and estrogen receptors on transcriptomes of HepG2 cells: a preliminary study using RNA sequencing. Int J Endocrinol. 2018;2018:5789127.
- Pinnix ZK, Miller LD, Wang W, et al. Ferroportin and iron regulation in breast cancer progression and prognosis. Sci Transl Med. 2010;2(43):43ra56.
- Torti SV, Torti FM. Iron and cancer: more ore to be mined. Nat Rev Cancer. 2013;13(5):342–355.
- Bajbouj K, Shafarin J, Abdalla MY, et al. Estrogen-induced disruption of intracellular iron metabolism leads to oxidative stress, membrane damage, and cell cycle arrest in MCF-7 cells. Tumour Biol. 2017;39(10):1010428317726184.
- Hamad M, Bajbouj K, Taneera J. The case for an estrogen-iron axis in health and disease. Exp Clin Endocrinol Diabetes. 2019. DOI:10.1055/a-0885-1677
- Zhou L, Zhao B, Zhang L, et al. Alterations in cellular iron metabolism provide more therapeutic opportunities for cancer. Int J Mol Sci. 2018;19:5.
- Yang Q, Jian J, Katz S, et al. 17beta-Estradiol inhibits iron hormone hepcidin through an estrogen responsive element half-site. Endocrinology. 2012;153(7):3170–3178.
- Hou Y, Zhang S, Wang L, et al. Estrogen regulates iron homeostasis through governing hepatic hepcidin expression via an estrogen response element. Gene. 2012;511(2):398–403.
- Qian Y, Yin C, Chen Y, et al. Estrogen contributes to regulating iron metabolism through governing ferroportin signaling via an estrogen response element. Cell Signal. 2015;27(5):934–942.
- Bajbouj KJS, Hamad M. Estrogen-dependent disruption of intracellular iron metabolism augments the cytotoxic effects of doxorubicin in select breast and ovarian cancer cells. Cancer Manag Res. 2019;11:4655–4668.
- van der Weijden VA, Floter VL, Ulbrich SE. Gestational oral low-dose estradiol-17beta induces altered DNA methylation of CDKN2D and PSAT1 in embryos and adult offspring. Sci Rep. 2018;8(1):7494.
- Schwarz JM, Nugent BM, McCarthy MM. Developmental and hormone-induced epigenetic changes to estrogen and progesterone receptor genes in brain are dynamic across the life span. Endocrinology. 2010;151(10):4871–4881.
- Anderson GJ, Frazer DM. Current understanding of iron homeostasis. Am J Clin Nutr. 2017;106(Suppl6):1559S–66S.
- Hamad M, Bajbouj K, Taneera J. The case for an estrogen-iron axis in health and disease. Exp Clin Endocrinol Diabetes. 2020;128(4):270–277.
- Ikeda Y, Tajima S, Izawa-Ishizawa Y, et al. Estrogen regulates hepcidin expression via GPR30-BMP6-dependent signaling in hepatocytes. PLoS One. 2012;7(7):e40465.
- Hua K, Din J, Cao Q, et al. Estrogen and progestin regulate HIF-1alpha expression in ovarian cancer cell lines via the activation of Akt signaling transduction pathway. Oncol Rep. 2009;21(4):893–898. .
- Kazi AA, Molitoris KH, Koos RD. Estrogen rapidly activates the PI3K/AKT pathway and hypoxia-inducible factor 1 and induces vascular endothelial growth factor A expression in luminal epithelial cells of the rat uterus. Biol Reprod. 2009;81(2):378–387.
- Pentecost BT, Teng CT. Lactotransferrin is the major estrogen inducible protein of mouse uterine secretions. J Biol Chem. 1987;262(21):10134–10139.
- Stuckey R, Aldridge T, Lim FL, et al. Induction of iron homeostasis genes during estrogen-induced uterine growth and differentiation. Mol Cell Endocrinol. 2006;253(1–2):22–29.
- Yasar P, Ayaz G, User SD, et al. Molecular mechanism of estrogen-estrogen receptor signaling. Reprod Med Biol. 2017;16(1):4–20.
- Palierne G, Fabre A, Solinhac R, et al. Changes in gene expression and estrogen receptor cistrome in mouse liver upon acute E2 treatment. Mol Endocrinol. 2016;30(7):709–732.
- Surani MA, Hayashi K, Hajkova P. Genetic and epigenetic regulators of pluripotency. Cell. 2007;128(4):747–762.
- Joh RI, Palmieri CM, Hill IT, et al. Regulation of histone methylation by noncoding RNAs. Biochim Biophys Acta. 2014;1839(12):1385–1394.
- Johnson LM, Bostick M, Zhang X, et al. The SRA methyl-cytosine-binding domain links DNA and histone methylation. Curr Biol. 2007;17(4):379–384.
- Tamaru H, Zhang X, McMillen D, et al. Trimethylated lysine 9 of histone H3 is a mark for DNA methylation in Neurospora crassa. Nat Genet. 2003;34(1):75–79.
- Fuks F. DNA methylation and histone modifications: teaming up to silence genes. Curr Opin Genet Dev. 2005;15(5):490–495.
- Schotta G, Lachner M, Sarma K, et al. A silencing pathway to induce H3-K9 and H4-K20 trimethylation at constitutive heterochromatin. Genes Dev. 2004;18(11):1251–1262.
- Zhao Q, Rank G, Tan YT, et al. PRMT5-mediated methylation of histone H4R3 recruits DNMT3A, coupling histone and DNA methylation in gene silencing. Nat Struct Mol Biol. 2009;16(3):304–311.
- Wang Y, Yu L, Ding J, et al. Iron Metabolism in Cancer. Int J Mol Sci. 2018;20:1.
- Pogribny IP, Tryndyak VP, Pogribna M, et al. Modulation of intracellular iron metabolism by iron chelation affects chromatin remodeling proteins and corresponding epigenetic modifications in breast cancer cells and increases their sensitivity to chemotherapeutic agents. Int J Oncol. 2013;42(5):1822–1832.
- Sharp PA, Clarkson R, Hussain A, et al. DNA methylation of hepatic iron sensing genes and the regulation of hepcidin expression. PLoS One. 2018;13(5):e0197863.
- Tao Y, Wu Q, Guo X, et al. MBD5 regulates iron metabolism via methylation-independent genomic targeting of Fth1 through KAT2A in mice. Br J Haematol. 2014;166(2):279–291.
- Cuddihy AR, O’Connell MJ. Cell-cycle responses to DNA damage in G2. Int Rev Cytol. 2003;222:99–140.
- Shen Y, Li X, Dong D, et al. Transferrin receptor 1 in cancer: a new sight for cancer therapy. Am J Cancer Res. 2018;8(6):916–931.
- Barrientos T, Laothamatas I, Koves TR, et al. Metabolic catastrophe in mice lacking transferrin receptor in muscle. EBioMedicine. 2015;2(11):1705–1717.
- Babu KR, Muckenthaler MU. miR-148a regulates expression of the transferrin receptor 1 in hepatocellular carcinoma. Sci Rep. 2019;9(1):1518.
- Biamonte F, Battaglia AM, Zolea F, et al. Ferritin heavy subunit enhances apoptosis of non-small cell lung cancer cells through modulation of miR-125b/p53 axis. Cell Death Dis. 2018;9(12):1174.
- Yang DC, Jiang X, Elliott RL, et al. Antisense ferritin oligonucleotides inhibit growth and induce apoptosis in human breast carcinoma cells. Anticancer Res. 2002;22(3):1513–1524.
- Cozzi A, Levi S, Corsi B, et al. Role of iron and ferritin in TNFalpha-induced apoptosis in HeLa cells. FEBS Lett. 2003;537(1–3):187–192.
- Hassan MM, Botrus G, Abdel-Wahab R, et al. Estrogen replacement reduces risk and increases survival times of women with hepatocellular carcinoma. Clin Gastroenterol Hepatol. 2017;15(11):1791–1799.
- Harris HA, Katzenellenbogen JA, Katzenellenbogen BS. Characterization of the biological roles of the estrogen receptors, ERalpha and ERbeta, in estrogen target tissues in vivo through the use of an ERalpha-selective ligand. Endocrinology. 2002;143(11):4172–4177.
- Howell A, Osborne CK, Morris C, et al. ICI 182,780 (Faslodex): development of a novel, “pure” antiestrogen. Cancer. 2000;89(4):817–825.
- Gardiner-Garden M, Frommer M. CpG islands in vertebrate genomes. J Mol Biol. 1987;196(2):261–282.
- Muhammad JS, Nanjo S, Ando T, et al. Autophagy impairment by Helicobacter pylori-induced methylation silencing of MAP1LC3Av1 promotes gastric carcinogenesis. Int J Cancer. 2017;140(10):2272–2283.
- Tsukatani T, Suenaga H, Shiga M, et al. Rapid susceptibility testing for slowly growing nontuberculous mycobacteria using a colorimetric microbial viability assay based on the reduction of water-soluble tetrazolium WST-1. Eur J Clin Microbiol Infect Dis. 2015;34(10):1965–1973.