
ABSTRACT
Superoxide dismutase 3 (SOD3) is a secreted antioxidant enzyme that regulates reactive oxygen species in the microenvironment. It is also a potential tumour suppressor gene that is significantly downregulated in breast cancer. We have previously shown that its mRNA expression is inversely correlated with relapse free survival in breast cancer patients. This study aimed to investigate the correlation of SOD3 promoter DNA methylation with its expression in different molecular subtypes of breast carcinoma. We found that SOD3 expression was significantly reduced in breast carcinoma samples compared to normal tissues with the lowest levels observed in Luminal B subtype. Pyrosequencing analysis showed significant increase in methylation levels in the SOD3 promoter region (−108 and −19 from the TSS) in tumours vs normal tissues (53.6% vs 25.2%). The highest degree of correlation between methylation and SOD3 expression levels was observed in Luminal B subtype (Spearman’s R = −0.540, P < 0.00093). In this subtype, the −78 CpG position is the most significantly methylated site. The Spearman’s coefficient analysis also indicated the most significant correlation of DNA methylation at this site with SOD3 gene expression levels in tumours vs. normal tissues (R = −0.5816, P < 6.9E-12). Moreover, copy number variation analysis of TCGA database revealed that the more aggressive Triple Negative and Her2+ subtypes had higher levels of SOD3 gene deletion. The predominantly down-regulated expression pattern of SOD3 and the various genetic and epigenetic deregulations of its expression suggest that loss of this antioxidant promotes an advantageous tumour-promoting microenvironment in breast cancer.
Introduction
Breast cancer is the most prevalent cancer in women and it is the second leading cause of cancer-related death. It is estimated that one out of eight women will be diagnosed with breast cancer throughout their lifetime [Citation1]. On the molecular level, breast cancer is a complex and heterogeneous disease. Therapeutic strategies are mainly guided by tumour burden and molecular subtypes. The four main breast cancer subtypes are categorized based on the presence of receptor(s) and gene expression patterns that reflect the fundamental differences of the tumours at the molecular level. The subtypes include: Luminal A (oestrogen receptor, ER+ and/or progesterone receptor, PR+, Her2-, and low ki67 index), Luminal B (ER/PR+, Her2+, and high Ki67 index), Her2-enriched (ER/PR-, Her2+, and high Ki67 index), and triple-negative or basal-like (TNBC) (ER-, PR-, Her2-, and high Ki67 index) [Citation2]. Another less commonly referred to category is the normal-like subtype, which accounts for 7.8% of all breast cancer cases in a lymph-node negative cohort [Citation3]. This subtype shares a similar IHC status with the luminal A subtype and is characterized by a normal breast tissue gene signature [Citation4]. The standard management of breast cancer is a multidisciplinary approach that involves local resection of the tumour, systemic therapies (anti-hormonal, anti-Her2, or chemotherapies), and radiation therapies [Citation5]. Inhibitors of Poly (ADP- ribose) polymerase (PARP) are also used for BRCA mutation carriers [Citation6].
Our previous study indicated that down-regulation of extracellular superoxide dismutase (EcSOD, a.k.a. SOD3) is frequently detected in breast carcinomas and re-expression of SOD3 in TNBC cell lines significantly suppressed tumour growth and metastasis in vivo [Citation7]. SOD3 is the only secreted member of the superoxide dismutase (SOD) family, which are the primary antioxidant enzymes involved in regulating reactive oxygen species (ROS) [Citation8]. These SODs utilize metal cofactors for catalysing one-electron oxidation followed by one-electron reduction of two superoxide (O2•-) anions to form hydrogen peroxide, H2O2, which is further reduced into water molecules by catalase and glutathione peroxidases [Citation9,Citation10]. While the three mammalian SODs catalyse the same dismutation reaction at the same rate (5 x 10⁹ M−1 s−1), the individual isoforms are expected to provide specific and non-redundant biological functions, due to their distinctive cellular localizations and the membrane impermeability of their substrate, O2•-. In contrast to the other SODs, which are ubiquitously expressed, SOD3 is expressed in a tissue and cell type-specific manner [Citation11]. The presence of SOD3 is also detectable in milk, plasma, synovium, and lymph [Citation12,Citation13]. Most importantly, loss of SOD3 expression is associated with decreased breast cancer patient survival, suggesting a potential tumour suppressive function [Citation14,Citation15].
Hypermethylation of CpG islands within the promoter region of a gene is recognized as an important epigenetic mechanism of transcriptional silencing of tumour suppressor genes during cancer development [Citation16]. The fact that SOD3 expression is tightly controlled in a cell type and tissue-specific manner [Citation17], and with a promoter that shows a CpG structure similar to other genes silenced by aberrant cytosine methylation [Citation18] indicates a potential association of epigenetic regulation via DNA methylation with SOD3 gene expression in breast cancer. The SOD3 promoter (−550 bp upstream to 100 bp downstream) has 18 CpG sites, which have been shown to be hypermethylated in breast and lung cancer tissues when compared to the normal control tissues [Citation7,Citation19]. Due to the limited number of tissues analysed in our previous study, the association of SOD3 promoter methylation could not be determined in a subtype-specific manner for breast cancer. This study, therefore seeks to enrich those results via pyrosequencing analysis of the SOD3 promoter using a subset of the cohort from the Breast Cancer Collaborative Registry, collected under the Northern Great Plains Personalized Breast Cancer Program (NGPPBCP). Our study indicates that SOD3 expression is significantly down-regulated in breast tumours compared to normal breast tissues. Moreover, there is an inverse correlation between the expression levels and the % methylation in breast cancer patient samples. Pam 50-based subtype analysis further revealed that SOD3 is most significantly down-regulated via DNA methylation in Luminal B breast cancers.
Results
SOD3 expression is downregulated in breast tumours
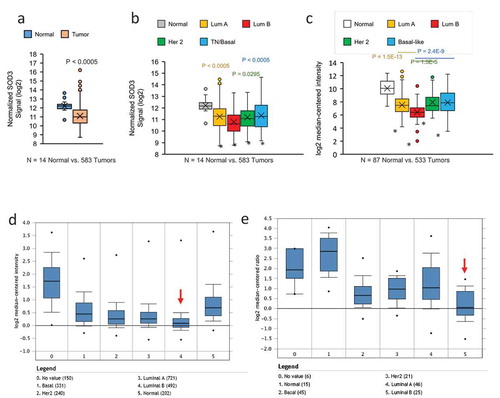
Agendia gene array analysis performed on clinical specimens collected from the BCCR showed that there was a significant decrease in SOD3 expression in breast tumours when compared to the normal tissues (Median = 10.991 vs. 12.215 or 2.33 fold reduction), as shown in ). In the tumour subset where molecular subtypes were identified, we observed that the lowest SOD3 expression was seen in the Luminal B subtype ()). A similar trend was observed when we analysed the TCGA datasets, as shown in ). Furthermore, we have queried the expression data of SOD3 from Oncomine platform. Two breast cancer datasets in Oncomine, the Curtis Breast [Citation20] ()) and Gluck Breast [Citation21] ()) also show that the lowest SOD3 expression levels were detected in Luminal B breast cancers (red arrow).
Figure 1. SOD3 expression is downregulated in breast cancer. (a) Comparison of SOD3 expression in breast tumours versus normal breast tissues with Agendia array analysis. N = 14 normal and 583 tumours. (b) Subtype-specific expression levels of SOD3. (c) Analysis of the SOD3 expression in the publicly available RNA seq data from TCGA comparing normal breast tissues versus breast tumours of various subtypes. In (B) and (C), * represents P < 0.0005 vs the normal tissues; individual P-values shown are comparison between the specific subtype vs the Luminal B subtype. Error bars indicate standard deviations. Oncomine analysis showing subtype specific expression of SOD3 from the Curtis Breast dataset (d) and Gluck Breast dataset (e). Numbers in brackets represent the numbers of tissue sample analysed
SOD3 expression levels are inversely correlated with its promoter CpG methylation
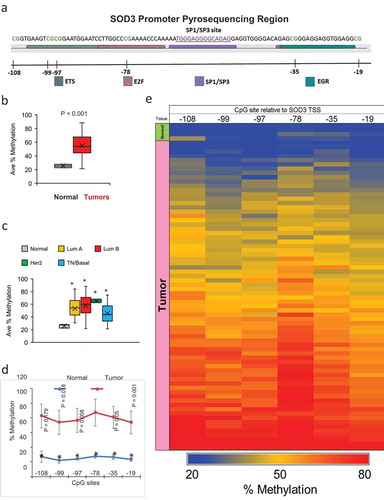
Next, we analysed six CpG sites within the SOD3 promoter as depicted in ). These sites were selected as they occur within known transcription factor binding sites or adjacent to them [Citation7,Citation19]. In comparison to the normal breast tissues, breast tumours showed significantly higher levels of CpG methylation in the SOD3 promoter region (Average of the 6 CpG sites = 53.6% in tumours vs. 25.2% in normal), as presented in ). A high % methylation is predicted to be associated with a suppression of SOD3 gene expression. In support of this, our results in ) show lower SOD3 expression levels in breast tumours relative to normal tissues. ) shows the methylation pattern of SOD3 gene across the clinical subtypes while ) shows the methylation pattern at each of the queried CpG site. The pyrosequencing analysis indicates most tumours having significantly increased methylation levels across all of the 6 CpG sites while the normal tissue showed predominantly lower levels of methylation in this SOD3 promoter region (p < 0.05). The highest methylation levels were seen at position −78 in both the normal and tumour tissues. Methylation at this site is known to interfere with Sp1/Sp3 binding, thereby leading to a suppression of SOD3 gene expression [Citation19]. The methylation pattern at the queried CpG sites for each sample is also shown in the heatmap in ).
Figure 2. Methylation Status of the SOD3 Promoter. (a) A diagram depicting the pyrosequencing region of the SOD3 gene. The binding sites of known transcription factors are highlighted in sequence. The CpG sites are indicated by the blank lines and the number of bases away from the transcription start site for SOD3. (b) The average methylation across all 6 CpG sites tested by pyrosequencing comparing normal to tumour tissues. (c) The average methylation of the SOD3 promoter comparing the different breast cancer subtypes. * represents P < 0.05 vs normal tissues. (d) Methylation profile for each individual CpG sites in tumour tissues and normal tissues. * represents P < 0.005 vs normal tissues. Individual P-values shown are the P-values of the CpG position vs the −78 position. Error bars indicate standard deviations. (e) A heatmap indicating the methylation status of each CpG site for all the samples tested. The tissue type is indicated on the left edge of the heatmap
Luminal B subtype shows the highest correlation of SOD3 methylation with its expression
We then determined the correlation between the % methylation and SOD3 expression (from the Agendia microarray) with Spearman’s correlation coefficient analysis (R values). As shown in ), there was a moderate inverse correlation in all the tumour samples analysed regardless of the molecular subtype (R = −0.383). A strong correlation was observed in the Luminal B subtype (R = −0.540), which is followed by the Luminal A subtype (R = −0.417) (,)). A weak correlation was observed in the TN/basal-like subtype (R = −0.3652) as shown in ). Correlation analysis was not determined for Her2+ subtype in our cohort since the number of samples available was too low to generate a statistically meaningful result. These pyrosequencing analyses suggest that promoter DNA methylation of SOD3 is likely a major contributor to the reduced expression levels of this antioxidant in Luminal B breast cancers but less influential on the triple-negative/basal-like subtype.
Figure 3. Correlation of SOD3 Expression with Promoter Methylation. (a-i) Spearman’s correlation between the % methylation of the SOD3 promoter and expression levels of SOD3 was used to determine the strength and direction of their association. Each graph indicates in the upper left corner which data set was used, either the BCCR cohort (A-D in the left panels) or the TCGA database (E-I in the right panels). The subtype of breast cancers is also indicated on the top of graph
TCGA database analysis showed similar SOD3 promoter methylation patterns
These methylation data trends in our cohort are also seen in the breast carcinoma samples from the TCGA database. The right panels in (e–i) show the TN/basal-like subtype having the lowest correlation (R = −0.192) while the Luminal B having the highest correlations (R = −0.561) with the gene expression levels. Good to moderate correlations were also seen in the Luminal A subtype (R = −0.507) and Her2+ subtype from the TCGA database (R = −0.388), respectively. The TCGA methylome analysis (Illumina 450 K array analysis) only covers two overlapping CpG sites as our pyrosequencing region (−97 and −78 from the TSS shown in )). The TCGA methylome sites are marked chr4:24795366_cg03577139 and chr4:24795385_cg11372436. These data suggest that pyrosequencing analysis of the chosen SOD3 promoter area with the 323 nucleotides region used in this study is a potential predictive region and a more cost effective approach in determining the association of this epigenetic mechanism with its gene expression in breast carcinomas. This methylation study also suggests that there are likely other factors leading to down-regulation of SOD3 expression in the triple-negative/basal-like subtype.
Specific CpG methylation status in breast cancer subtypes
When the correlation between methylation patterns of each CpG site and the mRNA expression of SOD3 was further analysed in individual breast cancer subtypes, we observed that Luminal B subtype shows the highest correlation coefficient at the −78 position while the −19 CpG location shows the highest correlations in the Luminal A and TN/basal-like subtypes (). These observations suggest that the association of site-specific methylation with the SOD3 mRNA expression is subtype dependent.
Table 1. Correlation between specific SOD3 CpG methylation sites and mRNA expression in clinical subtypes
SOD3 gene deletion is detected in the most aggressive subtypes of breast cancers
Another known mechanism of SOD3 silencing in cancer is genetic deletion. Therefore, we analysed SOD3 copy number variation (CNV) in the TCGA database. shows that shallow deletion is more prevalent than a gain/amplification of the SOD3 gene copy number in breast tumours. Amongst the subtypes, SOD3 is deleted most often in basal (51.3%) and Her2-enriched (44.2%) cancers, suggesting gene deletion is playing a more prominent role in regulating gene expression in these aggressive diseases.
Table 2. Subtype-specific copy number variation of SOD3. This table indicates the various alterations of the SOD3 gene in breast cancer subtypes from the TCGA database. The percent of samples with SOD3 gene deletion is included at the bottom
Discussion
The discovery that tumour suppressor genes are often epigenetically silenced during cancer development [Citation16] has served as a foundation for the use of small molecule epigenetic modifiers in novel cancer therapy strategies. DNA promoter methylation is significantly associated with the development of various human tumours. SOD3 lacks a standard CpG island but contains a cluster of 18 CpG sites surrounding the transcriptional start site (−550 bp upstream to 100 bp downstream) with known transcription factor binding sites, such as Sp1/Sp3. SOD3 CpG sites have been reported to be hypermethylated in tumour tissue from gallbladder, liver, prostate, lung, and a small subset of breast cancer samples [Citation7,Citation19,Citation22–24]. SOD3 is also hypermethylated and downregulated in other diseases, such as coronary artery disease [Citation25]. Highlighting the functional role of epigenetic silencing of SOD3, treatment with 5-aza-2ʹ-deoxycytidine (5-aza-dC), an inhibitor of DNA methylation, increased its expression in both normal and cancer cells [Citation7,Citation19,Citation26–29]. This methyltransferase inhibitor increased DNA accessibility via nucleosome remodelling thereby increasing RNA polymerase II and Sp3 binding to the SOD3 promoter [Citation28].
In this study, we focused on the differential methylation of CpG sites, which are located in the TSS −19 to −108 region of the SOD3 gene. We found that methylation of the six CpG sites in this region is highly associated with an inverse correlation of the SOD3 mRNA expression levels in breast tissues. While the normal breast tissues showed low levels of methylation in the SOD3 promoter, higher levels of methylation were found in breast tumours of all molecular subtypes. Interestingly, the highest extent of this negative correlation was detected in the Luminal B subtype and the lowest correlation was seen in the TN/basal-like subtype. Moreover, we showed that SOD3 expression is most significantly down-regulated in the Luminal B subtype of breast cancer.
Luminal subtypes are the most commonly diagnosed breast cancers (60–70%). In comparison to the Luminal A subtype, the Luminal B cancers are associated with higher grade (26% grade III in luminal B compared to 8% in luminal A), micropapillary histology, and high frequency of nodal metastasis (54 vs. 43%) [Citation30]. Patients with the Luminal B subtype also has a higher proportion of local recurrence and bone metastasis than in patients in the non-luminal groups [Citation31]. The landscape of breast cancer methylomes have been shown to be different between biologically distinct subtypes. Stefansson et al [Citation32] showed that DNA methylation patterns linked to the Luminal B subtype are characterized by CpG island promoter methylation events while a large fraction of basal-like tumours are mainly characterized by hypomethylation events occurring within the gene body.
In addition to DNA methylation, alterations of SOD3 expression, tissue distribution, and/or function can also occur via single nucleotide polymorphisms (SNPs). The SOD3 SNPs that have been associated with cancer risk and progression include rs1799895, rs2536512, rs2284659, and rs699473, and their effects are reviewed in Griess et al [Citation33]. However, SNPs were found to be rare within our cohort to determine if they are associated with gene expression. Several reports indicate the SOD3 gene, located on chromosome 4p15.3–4p15.1, is a hotspot for loss of heterozygosity in cancer. The deletion of chromosome 4p15.1–15.3 has been observed in many types of solid cancers, such as cervical, breast, head and neck, liver, colorectal, lung, and bladder [Citation19,Citation34–43]. These loses range from 30% in bladder cancer up to 60% in lung cancer [Citation39,Citation43]. Our copy number variation analyses indeed revealed a higher association of SOD3 gene deletion in the basal-like subtype compared to the other subtypes. This data also matches previous data indicating that deletion of chromosome 4p is most common in basal-like breast cancers [Citation44].
In conclusion, this study expands upon the data examining the role of promoter DNA methylation in regulating SOD3 gene expression. These data provide clear evidence of the negative correlation of promoter methylation and down-regulation of SOD3 expression in our cohort of breast cancer specimens. This study also highlights that despite reduction of SOD3 in all breast cancer subtypes, there are key differences in the silencing mechanism for each subtype. Promoter methylation of SOD3 is more prevalent in the Luminal B cancers while SOD3 gene silencing is affected mostly via CNV in TN/basal-like cancers. Analysis of breast cancer data by Kaplan-Meier Plotter (http://kmplot.com) showed that low SOD3 expression is significantly associated with poor outcome (relapse free survival, RFS) in breast cancer patients, where the median survival rate in the low expression cohort (N = 469) is 61 months vs. 173.2 months in the high expression cohort (N = 1412) (HR = 0.46, p < 1E-16) [Citation14,Citation33]. This suggests that loss of this extracellular redox regulator may promote a conducive microenvironment that favours cancer progression. The vast array of genetic and/or epigenetic mechanisms reported in mediating dysregulation of SOD3 expression, function, and cellular distribution [Citation33] further supports that loss of this extracellular antioxidant provides a selective advantage to cancer development.
Methods
Tissue samples and sample preparation
Excess DNA samples collected through the Breast Cancer Collaborative Registry (BCCR) (IRB# 253–13 EP, PI: Dr. Kenneth Cowan) were used for pyrosequencing analysis. BCCR is a web-based biomedical data and biospecimen repository developed by the Fred & Pamela Buffett Cancer Centre. The BCCR provides a critical platform for the Northern Great Plains Personalized Breast Cancer Program (NGPPBCP) funded by The Leona M. and Harry B. Helmsley Charitable Trust. Seventy one locations across the U.S. including seven cancer centres in the Northern Great Plains that are actively enrolling patients on the BCCR. Formalin fixed tissue blocks collected from the cancer centres were sent to the Fred & Pamela Buffett Cancer Centres (FPBCC) for centralized review. Specimens that are deemed adequate for whole exome DNA sequence studies were then sent to the tissue facility at the FPBCC for sectioning. Trained tissue technologist then performed macro-dissection on each specimen to concentrate the number of tumour cells and reduce the contamination of adjacent normal breast tissue. DNA isolation from the FFPE tumour specimens was performed by the FPBCC’s Molecular Biology/High-Throughput Screening Facility. Normal tissues used are not the adjacent tissues of tumour samples, but are breast tissues isolated from normal patients. DNA was extracted and purified using QIAamp DNA FFPE Tissue (QIAGEN) kits, quantified by Nanodrop 2000, followed by double-stranded DNA assessment using Qubit (3.0) dsDNA HS Assay kit (Invitrogen). Following the extraction of DNA from each patient’s breast cancer, the quality and quantity of DNA in each sample is determined. RNAs were extracted by using the QIAGEN RNeasy FFPE kit.
Agendia microarray analysis
The gene array expression profiling was performed by Agendia Inc. USA. Gene expression profiles were obtained for breast tissue with ≥30% invasive carcinoma. Total RNA was extracted from FFPE tissue using the Qiagen RNeasy FFPE Kit. The total RNA was DNase treated, ss-cDNA was synthesized and amplified using RT-PCR. The amplified cDNA was purified, labelled with Cy3-dUTP and hybridized onto custom gene expression microarrays (Agilent Technologies, Palo Alto, CA, US, Platform ID GPL20,078*). For analysis involving MammaPrint and BluePrint test indices, the microarray data were log2 transformed and then normalized using Lowess normalization. For analysis of the full-genome expression data, the microarray data were log2 transformed and then normalized using 75th percentile normalization, as recommended by Agilent**.
*For Platform ID GPL 20078, here is the GEO submission from an earlier study: https://www.ncbi.nlm.nih.gov/geo/query/acc.cgi?acc=GPL20078
**75th percentile normalization: http://genespring-support.com/content/q3-percentile-normalization-why-default-set-75th-percentile.
SOD3 pyrosequencing
Only the DNA samples with available gene expression profiling data were used for the correlation analysis between the expression levels of SOD3 and its promoter methylation pattern (N = 75 tumour samples and 14 normal tissues). Approximately 500 ng of breast tumour genomic DNA were treated with sodium bisulphite using the EZ DNA Methylation-Direct kit (Zymo Research, Irvine CA). This process deaminates unmethylated cytosine residues to uracil leaving methylated cytosine residues unchanged. A 323 base pair region of the SOD3 promoter was captured from each sample using PCR and custom designed primers: sense strand 5ʹ-TGTTGTGTGTTGAAGGTTATTGGTTATA-3ʹ, and pyrosequencing primer 5ʹ-TGTTGAAGGTTATTGGTTATAA-3ʹ. Methylation percentage of each CpG (−19 to −108 relative to transcription start site) was determined using the PCR product generated using Roche Diagnostic Corporation (Indianapolis, IN) High Fidelity FastStart Taq DNA Polymerase kit and a Qiagen (Valencia, CA) Pyromark Q96 pyrosequencer utilizing the pyrosequencing primer 5ʹ- TGTTGAAGGTTATTGGTTATAA-3ʹ, according to manufacturer’s recommendations. Along with the samples a positive (high methylation level) control, Roche Diagnostic Corporation (Indianapolis, IN) human lymphocyte genomic DNA was methylated using M. SssI (CpG) methylase kit (New England Biolabs, Ipswich, MA) and untreated Roche human lymphocyte genomic DNA served as a negative (low methylation level) control were sequenced to access proper sequencing performance. The area of the SOD3 promoter examined includes the Sp1/Sp3 transcription factor binding site as previously described [Citation19].
TCGA database analysis
Expression of SOD3 within the Cancer Genome Atlas (TCGA) breast carcinoma samples were queried upon data generated by the TCGA Research Network: https://www.cancer.gov/tcga.
Oncomine analysis
The Oncomine platform was used to query the expression analysis for SOD3 in the Curtis Breast [Citation20] (Figure 1(d)) and Gluck Breast [Citation21] (https://www.oncomine.org/resource/main.html).
Copy number variation analysis
Copy number and expression of SOD3 within the Cancer Genome Atlas (TCGA) breast carcinoma samples were queried using the cBioPortal for Cancer Genomics multidimensional cancer genomics data sets search engine (http://www.cbioportal.org/).
Statistical analysis
All statistical analyses were performed using the GraphPad Prism 5 software (GraphPad Software, USA). Differences were considered statistically significant when p value < 0.05.
Unpaired t test or Mann-Whitney test was applied when comparing two groups. When comparing three or more groups, one-way ANOVA and post-hoc test were used. Spearman test was used for correlation analyses.
Authors’ contributions
BG and MTF analyzed most of the data, assembled results, generated majority of the figures, and wrote the manuscript. DK designed the pyrosequencing primers, performed the pyrosequencing analysis and the TCGA database queries, as well as generated the methylation heatmap figure. MF contributed in identifying the CpG sites for the pyrosequencing studies and generated the figure illustrating these six CpG sites in the SOD3 promoter region. MD, AK, and KC coordinated sample acquisitions and clinical data verification. All authors read and approved the final manuscript.
Ethics approval and consent to participate
The Institutional Review Board at the University of Nebraska Medical Center approved the use of anonymized human DNA samples (IRB #030-17-EP).
Acknowledgments
We thank Oleg Shats (Assistant Director for Cancer Informatics at UNMC), Dr. David Kelly (Director, Molecular Biology Core Facility, Eppley Cancer Institute, UNMC) for clinical data verification. We also acknowledge the contribution by Dr. Peng Xiao (Director, Bioinformatics and Systems Biology Core, UNMC) for analyzing the Agendia microarray data and providing bioinformatics supports. We thank the Epigenomic Core Facility and the director, Dr. David Klinkebiel at UNMC for performing the pyrosequencing analysis. In addition, we thank Agendia Inc. USA for performing the gene array expression profiling.
Availability of data and materials
The datasets used and/or analysed during the current study are available from the TCGA network (https://www.cancer.gov/tcga), Oncomine platform (https://www.oncomine.org/resource/main.html) or from the corresponding author on reasonable request.
Disclosure statement
The authors declare no conflict.
Additional information
Funding
References
- National Cancer Institute. Bethesda M. seer cancer statistics review. 2019 April; Available from: https://seer.cancer.gov/csr/1975_2016/.
- Prat A, Pineda E, Adamo B, et al. Clinical implications of the intrinsic molecular subtypes of breast cancer. Breast. 2015;24(Suppl 2):S26–35.
- Smid M, Wang Y, Zhang Y, et al. Subtypes of breast cancer show preferential site of relapse. Cancer Res. 2008;68(9):3108–3114.
- Perou CM, Sørlie T, Eisen MB, et al. Molecular portraits of human breast tumours. Nature. 2000;406(6797):747–752.
- Furrukh M, Qureshi A. Treatment of breast cancer; review and updates. J Ayub Med Coll Abbottabad. 2018;30(2):264–274.
- Faraoni I, Graziani G. Role of BRCA mutations in cancer treatment with poly(ADP-ribose) polymerase (PARP) inhibitors. Cancers (Basel). 2018;10(12):487.
- Teoh-Fitzgerald ML, Fitzgerald MP, Zhong W, et al. Epigenetic reprogramming governs EcSOD expression during human mammary epithelial cell differentiation, tumorigenesis and metastasis. Oncogene. 2014;33(3):358–368.
- Griess B, Tom E, Domann F, et al. Extracellular superoxide dismutase and its role in cancer. Free Radic Biol Med. 2017;112:464–479.
- Sies H. Hydrogen peroxide as a central redox signaling molecule in physiological oxidative stress: oxidative eustress. Redox Biol. 2017;11:613–619.
- Perry JJ, Shin DS, Getzoff ED, et al. The structural biochemistry of the superoxide dismutases. Biochim Biophys Acta. 2010;1804(2):245–262.
- Marklund SL. Extracellular superoxide dismutase in human tissues and human cell lines. J Clin Invest. 1984;74(4):1398–1403.
- Marklund SL, Holme E, Hellner L. Superoxide dismutase in extracellular fluids. Clin Chim Acta. 1982;126(1):41–51.
- Hicks CL. Occurrence and consequence of superoxide dismutase in milk products: a review. J Dairy Sci. 1980;63(7):1199–1204.
- Golden BO, Griess B, Mir S, et al. Extracellular superoxide dismutase inhibits hepatocyte growth factor-mediated breast cancer-fibroblast interactions. Oncotarget. 2017;8(64):107390–107408.
- O’Leary BR, Fath MA, Bellizzi AM, et al. Loss of SOD3 (EcSOD) expression promotes an aggressive phenotype in human pancreatic ductal adenocarcinoma. Clin Cancer Res. 2015;21(7):1741–1751.
- Jones PA. DNA methylation and cancer. Oncogene. 2002;21(35):5358–5360.
- Ho-Yen CM, Jones JL, Kermorgant S. The clinical and functional significance of c-Met in breast cancer: a review. Breast Cancer Res. 2015;17:52.
- Laukkanen MO, Mannermaa S, Hiltunen MO, et al. Local hypomethylation in atherosclerosis found in rabbit ec-sod gene. Arterioscler Thromb Vasc Biol. 1999;19(9):2171–2178.
- Teoh-Fitzgerald ML, Fitzgerald MP, Jensen TJ, et al. Genetic and epigenetic inactivation of extracellular superoxide dismutase promotes an invasive phenotype in human lung cancer by disrupting ECM homeostasis. Mol Cancer Res. 2012;10(1):40–51.
- Curtis C, Shah SP, Chin S-F, et al. The genomic and transcriptomic architecture of 2,000 breast tumours reveals novel subgroups. Nature. 2012;486(7403):346–352.
- Glück S, Ross JS, Royce M, et al. TP53 genomics predict higher clinical and pathologic tumor response in operable early-stage breast cancer treated with docetaxel-capecitabine ± trastuzumab. Breast Cancer Res Treat. 2012;132(3):781–791.
- Sharma P, Bhunia S, Poojary SS, et al. Global methylation profiling to identify epigenetic signature of gallbladder cancer and gallstone disease. Tumour Biol. 2016;37(11):14687–14699.
- Divyya S, Naushad SM, Murthy PVLN, et al. GCPII modulates oxidative stress and prostate cancer susceptibility through changes in methylation of RASSF1, BNIP3, GSTP1 and Ec-SOD. Mol Biol Rep. 2013;40(10):5541–5550.
- Chiba T, Yokosuka O, Fukai K, et al. Cell growth inhibition and gene expression induced by the histone deacetylase inhibitor, trichostatin A, on human hepatoma cells. Oncology. 2004;66(6):481–491.
- Lakshmi SV, Naushad SM, Reddy CA, et al. Oxidative stress in coronary artery disease: epigenetic perspective. Mol Cell Biochem. 2013;374(1–2):203–211.
- Kamiya T, Machiura M, Makino J, et al. Epigenetic regulation of extracellular-superoxide dismutase in human monocytes. Free Radic Biol Med. 2013;61:197–205.
- Zelko IN, Stepp MW, Vorst AL, et al. Histone acetylation regulates the cell-specific and interferon-gamma-inducible expression of extracellular superoxide dismutase in human pulmonary arteries. Am J Respir Cell Mol Biol. 2011;45(5):953–961.
- Zelko IN, Mueller MR, Folz RJ. CpG methylation attenuates Sp1 and Sp3 binding to the human extracellular superoxide dismutase promoter and regulates its cell-specific expression. Free Radic Biol Med. 2010;48(7):895–904.
- Chaiswing L, Zhong W, Oberley TD. Increasing discordant antioxidant protein levels and enzymatic activities contribute to increasing redox imbalance observed during human prostate cancer progression. Free Radic Biol Med. 2014;67:342–352.
- Hashmi AA, Aijaz S, Khan SM, et al. Prognostic parameters of luminal A and luminal B intrinsic breast cancer subtypes of Pakistani patients. World J Surg Oncol. 2018;16(1):1.
- Li Z-H, Hu P-H, Tu J-H, et al. Luminal B breast cancer: patterns of recurrence and clinical outcome. Oncotarget. 2016;7(40):65024–65033.
- Stefansson OA, Moran S, Gomez A, et al. A DNA methylation-based definition of biologically distinct breast cancer subtypes. Mol Oncol. 2015;9(3):555–568.
- Griess B, Tom E, Domann F, et al. Extracellular superoxide dismutase and its role in cancer. Free Radic Biol Med. 2017;112:464–479.
- Singh RK, Indra D, Mitra S, et al. Deletions in chromosome 4 differentially associated with the development of cervical cancer: evidence of slit2 as a candidate tumor suppressor gene. Hum Genet. 2007;122(1):71–81.
- Beder LB, Gunduz M, Ouchida M, et al. Genome-wide analyses on loss of heterozygosity in head and neck squamous cell carcinomas. Lab Invest. 2003;83(1):99–105.
- Dallol A, Da Silva NF, Viacava P, et al. SLIT2, a human homologue of the drosophila Slit2 gene, has tumor suppressor activity and is frequently inactivated in lung and breast cancers. Cancer Res. 2002;62(20):5874–5880.
- Kim G-J, Cho S-J, Won N-H, et al. Genomic imbalances in Korean hepatocellular carcinoma. Cancer Genet Cytogenet. 2003;142(2):129–133.
- Pershouse MA, El-Naggar AK, Hurr K, et al. Deletion mapping of chromosome 4 in head and neck squamous cell carcinoma. Oncogene. 1997;14(3):369–373.
- Polascik TJ, Cairns P, Chang WY, et al. Distinct regions of allelic loss on chromosome 4 in human primary bladder carcinoma. Cancer Res. 1995;55(22):5396–5399.
- Sherwood JB, Shivapurkar N, Lin WM, et al. Chromosome 4 deletions are frequent in invasive cervical cancer and differ between histologic variants. Gynecol Oncol. 2000;79(1):90–96.
- Shivapurkar N, Maitra A, Milchgrub S, et al. Deletions of chromosome 4 occur early during the pathogenesis of colorectal carcinoma. Hum Pathol. 2001;32(2):169–177.
- Shivapurkar N, Sood S, Wistuba II, et al. Multiple regions of chromosome 4 demonstrating allelic losses in breast carcinomas. Cancer Res. 1999;59(15):3576–3580.
- Shivapurkar N, Virmani AK, Wistuba II, et al. Deletions of chromosome 4 at multiple sites are frequent in malignant mesothelioma and small cell lung carcinoma. Clin Cancer Res. 1999;5(1):17–23.
- Kwei KA, Kung Y, Salari K, et al. Genomic instability in breast cancer: pathogenesis and clinical implications. Mol Oncol. 2010;4(3):255–266.