
ABSTRACT
DNA methylation (DNAm) is a key epigenetic regulator of gene expression across development. The developing prenatal brain is a highly dynamic tissue, but our understanding of key drivers of epigenetic variability across development is limited. We, therefore, assessed genomic methylation at over 39 million sites in the prenatal cortex using whole-genome bisulfite sequencing and found loci and regions in which methylation levels are dynamic across development. We saw that DNAm at these loci was associated with nearby gene expression and enriched for enhancer chromatin states in prenatal brain tissue. Additionally, these loci were enriched for genes associated with neuropsychiatric disorders and genes involved with neurogenesis. We also found autosomal differences in DNAm between the sexes during prenatal development, though these have less clear functional consequences. We lastly confirmed that the dynamic methylation at this critical period is specifically CpG methylation, with generally low levels of CpH methylation. Our findings provide detailed insight into prenatal brain development as well as clues to the pathogenesis of psychiatric traits seen later in life.
Introduction
DNA methylation (DNAm) plays an important role in the epigenetic regulation of gene expression, tissue differentiation, and development from prenatal life through adolescence and likely beyond. It has been shown that in the human brain, DNAm is particularly plastic during the first 5 years of postnatal life, both at CpG and CpH (H = A, T, or C) sites [Citation1]. Methylation levels at key sites change over time and these changes lead to adjustments in gene expression and splicing. These key regions have also been linked to neurodevelopmental disorders such as schizophrenia, in which early dysregulation plays a vital role [Citation2,Citation3]. DNAm is an attractive epigenetic mechanism to study in post-mortem human brain tissue, because it represents an interaction between genetic and environmental effects. External factors such as changes in diet [Citation4], exposure to cigarette smoking [Citation5], and exposure to arsenic [Citation6] have been associated with both global and site-specific changes to DNAm levels.
In order to better understand the causes and consequences of deviant DNAm patterns in psychiatric disease development, we must first understand the normal landscape. Illuminating typical methylation changes in prenatal development will both provide insight into gene expression and molecular pathways active in the postnatal developing brain, and provide a baseline for identification of aberrant DNAm in postnatal disease states, as the pathological changes that lead to symptoms of psychiatric disease may precede the onset of illness by several decades [Citation7].
The dorsolateral prefrontal cortex (DLPFC) is a dynamic region of the brain throughout development, essential for motor planning, conceptual organization, and working memory, and is often functionally dysregulated in patients with schizophrenia [Citation8]. Previous studies using microarrays to quantify DNAm have revealed that there are many DNAm changes in the DLPFC around the time of birth [Citation9], but the dynamics of the prenatal brain are far less characterized. Previous work assessing prenatal brain DNAm has largely used microarrays, and sampled from the whole brain rather than a specific region [Citation10]. Furthermore, unlike the adult DLPFC which is a mixture of different cell types [Citation11,Citation12], the majority of cells in the developing brain are neuronal [Citation13]. Research has further previously shown that neuronal DNA methylation is especially dynamic in the earliest stages of postnatal life [Citation9,Citation14]. These data together suggest that profiling the DLPFC in prenatal samples could identify important patterns of neuronal development that could relate to risk for neuropsychiatric disorders [Citation1].
In the present report, we use whole-genome bisulfite sequencing (WGBS) to capture an unbiased map of the DNAm landscape and to characterize both CpG and CpH methylation during prenatal brain development. Dynamic regions of DNAm even in the early developmental context are likely to be associated with psychiatric risk-associated genes, and connection to gene expression data can validate the importance of these genomic regions. These important regions will help point to pathways and mechanisms of normal brain development as well as psychiatric and neurodevelopmental conditions.
Results
Whole-genome bisulfite sequencing in the prenatal human cortex
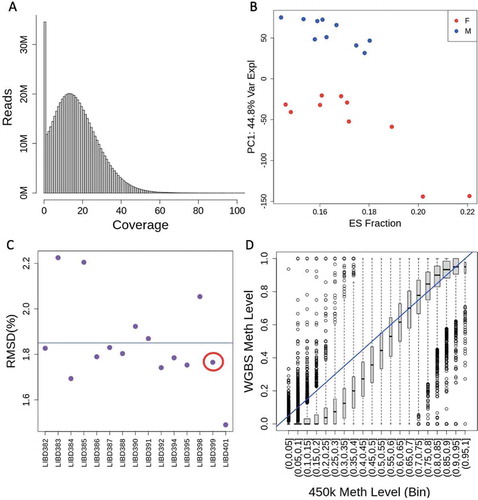
We performed whole-genome bisulfite sequencing (WGBS) to better characterize the shifting DNAm landscape in the developing human dorsolateral prefrontal cortex (DLPFC) in 20 prenatal samples during the second trimester in utero (Table S1). After data processing and quality control (see Methods), we analysed 28,612,402 CpG and 13,166,520 CpH (H = A, T, or C) sites across the epigenome. We first focused on CpG DNAm and performed a series of quality control analyses. We quantified read coverage at every CpG, which after processing and alignment resulted in an average of 17.7 reads per CpG ()). Most of these sites were methylated (>80% DNAm) and a minority were unmethylated (<20% DNAm) (Table S2). We then performed principal component analysis (PCA) on the DNAm levels across these high-coverage CpGs and found that the top principal components were most associated with sex and estimated embryonic stem cell (ESC) fractions (which likely represent radial glia) via statistical deconvolution (); Figure S1; see Methods), in line with our previous work [Citation9]. We lastly compared the DNAm levels from WGBS to levels from Illumina 450k microarray measured on 15 of the 20 samples for the subset of CpGs in common to both technologies (N = 456,305), and found that overall, CpG methylation levels were highly concordant regardless of CpG read coverage (). These analyses together suggested that our DNAm data were of high quality for subsequent methylation analyses.
Figure 1. WGBS Data. (a) Coverage levels across all CpGs. The mean coverage level was 17.7 reads per CpG. (b) PCA on all CpG DNAm levels shows that the top principal component – accounting for 10.3% of variance, is sex. However we can also see that there is another factor separating the two clusters of females, shown here to be embryonic stem (ES) cell fraction. (c) Root-mean-square deviation (RMSD) of WGBS measurements from 450k measurements for each sample. Mean RMSD is shown. (d) WGBS measured DNAm for each site on 450k, organized by 450k methylation measurement, of sample LIBD399, shown in the red circle in (C)
DNAm associations and their characterization
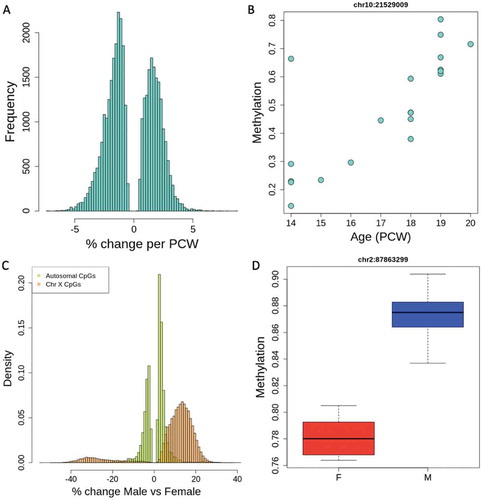
To understand the changes in the prenatal epigenetic landscape, we performed linear modelling across all CpG sites. We found that DNAm changes were abundant even during this relatively restricted period in prenatal development, with 36,546 CpG sites associating with age across 14–20 post-conception weeks (PCW, at FDR < 0.05, Table S3). On average, each week of development was associated with a 1.8% change in DNAm (interquartile range (IQR): 1.18–2.33%, ) among these significant age-associated CpGs, with some significant sites changing as much as 8.7% per week. These age-associated CpGs were not evenly distributed across the genome, and there was a noted depletion of signal on the sex chromosomes (0 on chrY and 339 on chrX, see Table S4). There was also some non-random distribution across the autosomes, with some chromosomes having up to 2.5x higher frequency of age-associated CpGs than others (Table S4). With regard to genomic features, 2,743 of these CpGs lie in previously annotated CpG islands, with 5,933 in shores, defined as 2 kb from island ends. Unlike microarray platforms, which are biased towards gene promoters, the vast majority (73%) of our age-associated CpGs lie within genes, consistent with previous findings on age-associated methylation using WGBS [Citation1], and mostly in introns. Additionally, 2,932 age-associated CpGs lie within 1 kb of a transcription start site and thus potentially in promoters. A small percentage of these age-associated CpGs (6.5%) were annotated to intergenic sequences. Sites were fairly evenly split in the direction of methylation change by age, with 46% increasing in methylation as the cortex develops. These sites were fairly robust to confounding by ethnicity, as sensitivity analyses further adjusting for self-reported race showed little impact on age-associated CpG sites (Table S5). Additionally, less than half of these age-associated CpG sites are significantly associated with the estimated ESC proportion in the sample, suggesting that many of these CpG sites have true prenatal age changes in methylation rather than reflecting effects of maturing cell type composition.
Figure 2. Methylation associations across ages and between sexes. (a) Percent change in methylation per post-conception week (PCW) across all significantly age-associated CpGs (FDR < 0.05). A positive % change indicates hypermethylation with increasing age. (b) An example of an age-associated CpG on chromosome 10. (c) Percent change in methylation between sexes at sex-associated CpGs, showing that the X chromosome tends to have greater percentage differences than autosomal CpGs. A positive % change indicates hypermethylation in males. (d) An example of a sex-associated CpG on chromosome 2
We further explored whether these sites could be organized into differentially methylated regions (DMRs), which have been shown to be more functionally relevant than individual CpGs. We, therefore, used a ‘bumphunting’ technique adapted to WGBS data [Citation15] to identify regions of methylation with 1.5% DNAm changes per week (corresponding to 10.5% changes across our developmental window) change in DNAm levels across adjacent CpGs, and calculated statistical significance using 1000 bootstrap-based permutations [Citation16]. Using a cut-off of family-wise error rate (FWER) <0.2, there were 34 DMRs across prenatal development, though a less conservative cut-off (p < 0.05) identified 3,446 DMRs (Table S6, Figure S2A for DMR plot). The DMRs are similarly unevenly distributed throughout the genome as the CpGs, being far less frequent on chrX and variable among the autosomes. The DMRs on average had a width of 1696 bp (IQR: 921–2181), 75% overlap with annotated genes, and 12% overlap with annotated CpG islands. Like the CpGs, the DMRs were split between hypo- and hypermethylation, wherein 49% of the DMRs, methylation increased with age.
We also found differentially methylated sites and regions between the sexes in these prenatal samples. There were 618,978 significantly associated CpGs by sex and as expected, the vast majority (95%) of these were on the sex chromosomes. There were still 30,823 significant autosomal CpGs (, Table S7), and while 993 of them were in regions homologous to the sex chromosomes, the majority (97%) had no homology to chrX or chrY. Among these, we found conservatively 28 DMRs with a 10% methylation change between sexes (Table S8, Figure S2B for DMR plot). Again we saw that these were not global, but regional changes in methylation, with equal numbers of DMRs being hypo- and hypermethylated in males and females. These data show that there are many differences in the DNAm landscape throughout second-trimester development, and between sexes prenatally.
Previously, many studies of brain DNA methylation have used the Illumina Infinium® HumanMethylation450 BeadChip (‘450k’) and more recent Infinium MethylationEPIC (‘850k’) microarray technologies. While these platforms can sensitively measure DNAm levels without the high coverage/sequencing requirements of WGBS, they assay a limited number of sites. To better contrast the tradeoffs between breadth (assaying more sites) and depth (assaying a given site more accurately), we compared our WGBS findings to analogous statistics calculated using these arrays on the same DNA extractions. First, using the probe coordinates alone, the 450k array does not measure DNAm levels at 35,401 (97%) of the significant age-correlated CpGs or 610,578 (98.7%) of the significant sex-correlated CpGs we identified. The 450k DNAm data validated 566 (49%) out of the 1,145 age-correlated sites that were covered. Performing the same age model on the 450k data, our WGBS data validated 279/423 (66%) of the significant results. The effects of age on methylation were generally directionally concordant between the two datasets (Figure S3). Though DMRs have much wider spans, the 450k does not cover 10 (30%) and 12 (43%) of DMRs for age and sex, respectively. The newer 850k microarray had almost twice the number of probes, yet we found that it does not measure 95% of our significant sites for age and 98% of sites for sex. Additionally, this microarray design failed to capture 24% of age DMRs and 36% of sex DMRs. Prevalent microarray platforms are therefore potentially missing a great deal of dynamic DNAm sites across the genome, and further highlight the tradeoffs between breadth, depth, cost, and complexity of generating and analysing DNAm data for epigenomic analyses.
Functional characterization of associated sites
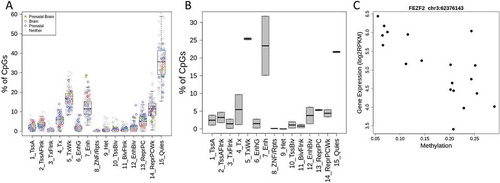
While methylation analyses provided detailed information about changes in the methylation landscape across brain prenatal development and between the sexes, we wanted to better understand the molecular consequences of these changes. We performed gene set enrichment analyses using Gene Ontology (GO) sets to better understand in which processes the genes containing significant CpGs were involved. The top biological processes associated with genes containing age-associated CpGs were related to axon development and guidance, and regulation of neuron projection (, Table S9). These sites were also shown to be enriched for enhancers in prenatal brain tissue as well as enriched for transcription start site regions in brain tissue from the Epigenome Roadmap project [Citation17], implying that these areas are likely functional in prenatal brain [Citation17] ()). To better assess the putative functionality of the methylation at these CpGs and DMRs, we correlated these DNAm associations with nearby expression levels using RNA-seq data from the same cortical dissection. Among the 36,546 age-related CpGs, 59% were within an RNA-seq-measured gene (corresponding to 1,648 unique genes), and 7,983 (37%) of these CpGs had methylation levels significantly correlated to expression of the gene they lie directly within (at p < 0.05, corresponding to 653 unique genes, 40%, see Methods). Correlations were seen in both positive and negative directions, depending on the CpG, with a slight skew towards negative correlation, though we see that in CpGs that lie in promoters, correlation is mostly negative, as one would expect ()). These expression-correlated CpGs did not have any differential gene set enrichment from the overall group of proximal genes. These sites were mostly in weak transcription, enhancer, and quiescent chromatin states in prenatal brain tissue ()) [Citation17]. A total of 24,679 (66%) CpGs were within an expanded window of 5 kb around genes, and 8,759 (35%) correlated to the nearest gene’s expression levels. It is important to note that this procedure only tested sites within actual genes, and only the effect on the same gene, so this did not account for potential enhancer, upstream, and trans-acting effects.
Figure 3. Gene Ontology (GO) and gene set enrichment for age-associated CpGs. The top 20 GO hits for all categories are plotted in order of significance (indicated by bar colour), showing the gene count for each GO category
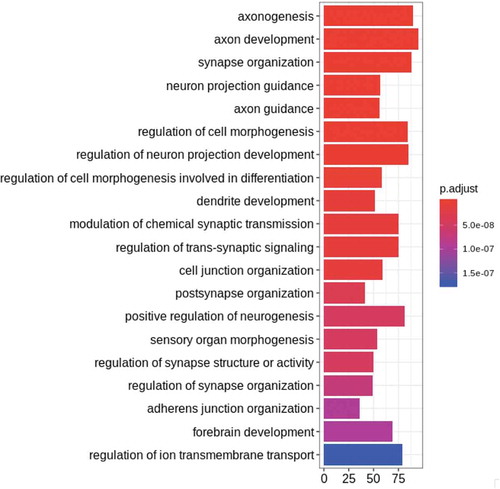
Figure 4. Functional consequences of differential methylation (a) Chromatin states of age-associated CpGs in various tissues. We show the distribution of chromatin states from the 15-state model of our CpGs in various tissues from the Roadmap Epigenomics Consortium. In Roadmap prenatal brain tissues, our sites are enriched for enhancer regions, and in all brain tissues, our sites are enriched for TSS sites. (b) Chromatin state of CpGs correlated to expression in prenatal brain tissue. We see that in prenatal brain tissue, most of our age-associated and expression-correlated CpGs are in weak transcription or enhancer states. Chromatin states are defined as follows. 1: Active TSS 2: Flanking Active TSS 3: Transcription at gene 5ʹ and 3ʹ 4: Strong transcription 5: Weak transcription 6: Genic enhancers 7: Enhancers 8: ZNF genes & repeats 9: Heterochromatin 10: Bivalent/Poised TSS 11: Flanking Bivalent TSS/Enhancer 12: Bivalent Enhancer 13: Repressed PolyComb 14: Weak Repressed PolyComb 15: Quiescent/Low (c) An example of correlation between methylation level at a promoter and gene expression. Gene expression from RNA-seq is plotted against DNAm level at a correlated site, showing a decrease in gene expression with increasing methylation in example gene FEZF2
The correlation to expression was much lower for sex-related CpGs, at 5% and 9% significant correlation depending on inclusion or exclusion of sex chromosomes. The lack of correlation to expression here is unsurprising because there are almost no transcriptomic differences between the sexes in these samples. Gene set enrichment on autosomal sex-related CpGs found genes involved with synaptic transmission and signalling, regulation of GTPase activity, and the glutamate receptor signalling pathway (Table S10).
Age-related DMRs were most enriched for genes related to stem cell proliferation and various cell fate specifications (Table S11). Among the DMRs across age, 21% were significantly correlated with gene expression. The genes represented by this are OTX1, AC246817.1, CYP2E1, PLEKHH3, and DUX4L32. We also find that 33% of the DMRs overlap with one or more enhancers defined by psychENCODE [Citation18]. There was no enrichment for any gene category among the sex-related DMRs, but it is worth noting that many of these genes coded for lncRNAs. Twenty-five per cent of sex-related DMRs were correlated to gene expression within their own gene and these genes were LINC01606, LINC01166, SPATC1L, and RFPL2. To compare this rate of correlation to the rest of the genome, we looked at non-DMRs: regions that fit bumphunter’s clustering criteria but were not differentially methylated. Correlation to gene expression overall was not different between differentially methylated regions and non-differentially methylated regions; the DMRs we found were not enriched for highly correlated regions. These results provide potential starting points for further understanding the DNA methylation landscape of the developing brain, allowing us to better understand which processes are active during normal and disordered development.
CpH methylation changes
While DNA methylation occurs exclusively in the CpG context in almost all somatic cell types, neurons in the human brain uniquely have high levels of DNA methylation in other cytosine contexts (predominantly CpA) [Citation19]. We, therefore, investigated the potential role of CpH methylation across brain development. Only 2.4% (IQR: 2.33–2.49) of sites in a CHG context and 1.71% (IQR: 1.61–1.79) of sites in a CHH context were methylated. For comparison, around 10% of CpH sites are methylated in postnatal neurons, so it is likely as previously suggested [Citation1] that CpH methylation accumulates beginning around the time of birth. This contrasted with CpG sites, which were predominantly methylated across the genome (Table S2). Because there are many more CpH than CpG sites in the genome, there were actually comparable numbers of methylated CpG and CpH sites (N = 13,166,520), despite the vastly different proportions. However, the DNAm levels at these sites were much lower in the CpH context (mean = 10%), likely resulting from the low proportion of mature post-mitotic neurons that contribute to this signal.
Using the same linear model as on CpGs above, no CpHs were significantly associated with age within this time period when accounting for the large multiple testing burden. However, 51 autosomal CpHs were significantly associated with sex (at FDR < 0.05, Table S12). Additionally, there were 40 associated CpHs on the sex chromosomes, though most of these were on chrY, overall very proportionally different from CpG methylation. There was no enrichment for any more specific trinucleotide context in these significant sites over the whole genome. These CpHs were less likely to be in or near genes than the CpGs, but of the 17 autosomal CpHs that were in or near genes, only 1 was significantly correlated (p < 0.05) with expression of the nearest gene within 10 kb. It is notable that the majority of these CpHs are relatively far from a gene. Additionally, the effect size of the CpH methylation at these significant sites was independent of the effect of CpGm in the surrounding area in most cases. Five of the CpHs’ effects were reduced when accounting for the methylation of the nearest CpG (Figure S4), showing that these few were dependent on the local CpG landscape, but most function independently. These loci were found both in and outside of genes and their surrounding regions. Overall, CpH methylation did not seem to be very dynamic or functional in prenatal second-trimester development, in contrast to its dynamic nature after birth [Citation1].
Enrichments for neuropsychiatric conditions and their genetic risk
Lastly, we assessed the clinical relevance of age- and sex-associated DNA methylation changes across prenatal brain development. We therefore performed enrichment testing of the 1,648 genes represented by prenatal age-associated CpGs, and found enrichment for bipolar disorder- (p = 0.014, odds ratio (OR) = 2.15), neurodevelopmental disorder- (p = 1.9e-4, OR = 7.66), and schizophrenia (p = 9.7e-6, OR = 2.96)-associated genes [Citation20]. The set of age-associated CpG genes was particularly enriched for autism spectrum disorder (ASD)-associated genes (p = 1.6e-40, OR = 4.14) [Citation21]. To refine this finding, we looked to a recent exome study by Satterstrom et al. [Citation22] which stratifies its gene set by clinical symptoms. While our genes are enriched for genes associated with ASD-dominant traits (p = 2.5e-4, OR = 4.59), they are far more strongly enriched for genes associated with neurodevelopmental delay (p = 7.7e-7, OR = 10.97). Sex-associated CpGs were also enriched for ASD-associated genes (p = 6e-29, OR = 2.9), but not for genes associated with other psychiatric disorders. We also tested enrichment for differentially expressed genes in ASD, bipolar disorder, and schizophrenia [Citation23] and found that our age-associated genes are enriched for genes that are both up- and down-regulated in ASD and schizophrenia (Table S13). We additionally assessed whether the subset of genes that were correlated with age-associated CpG DNAm levels (N = 653) showed differential enrichment compared to the full set of 1,648 proximal genes among these brain disorders. We found no differential enrichment, suggesting that many of DNAm changes might be functional without directly influencing proximal gene expression, in line with Roadmap Epigenomics enrichment analyses above.
Our age-associated DMRs represented a greater portion of the genome than CpGs, and may further have different functional effects. To further understand what clinical phenotypes may be linked to our DMRs, we performed stratified LD score regression [Citation24]. Our DMR sets represented a fairly small portion of the genome, but at 5.8 Mb, the less stringent age-based DMRs were wide enough to detect enrichment of BMI- and Subjective Well-Being (SWB)-associated markers (Table S14). These DMRs were also shown to be enriched for brain-linked traits overall, compared to non-brain-linked traits. Additionally, the DMRs overlap with 15 of 108 schizophrenia loci from Psychiatric Genetics Consortium 1 [Citation25], which we are particularly interested in due to the neurodevelopmental hypothesis. These results suggest that dynamic methylation states in prenatal development may play a role in many disease and non-disease phenotypes that manifest later in life.
Discussion
Here we demonstrate that CpG methylation changes are associated with prenatal cortical development, are likely functionally relevant, and may play a role in developmental psychiatric disorders such as autism spectrum disorder (ASD).
The shifting DNAm landscape during this restricted prenatal time period – the second trimester – likely plays a role in neurogenesis of the developing human brain. Following current dogma, changes in DNAm at these critical sites presumably lead to altered gene expression which promotes the formation of new neural connections in the cortex. At this point in time, we see that it is CpGs that are the important sites in the DNAm landscape, as opposed to CpHs. This is in line with previous research which finds that most CpHm is established around birth and postnatally [Citation1,Citation14], later in neuron differentiation and development [Citation26]. We also see that much – but not all – of this regulation is occurring in cis – within the site’s own gene. We do not currently understand the trans effects of our developmentally dynamic sites, but they may explain the effects of the methylation that does not correlate to its nearest gene’s expression. The fact that the age-associated CpG sites and DMRs we identified are often in enhancer regions in prenatal brain is further evidence that these sites may be regulating from a distance, reflecting the growing importance of higher-order chromatin structures in the developing brain [Citation27]
Our findings are in line with previous findings based on microarray-derived data [Citation10], but using WGBS allows us to assess methylation at far more loci than the more commonly used Illumina microarrays. We have shown that these microarrays do not even measure the majority of sites that are dynamic in neural development. Despite potentially less precision, we also show that WGBS has enough coverage to assess DNAm dynamics and that its findings were consistent with deeper-coverage assays. Additionally, we present novel loci due to our narrower developmental age range, which means that we can detect more subtle changes in the second trimester but also means that we do not replicate all the findings of studies done across wider timespans [Citation10]. Confining our samples to just cortex tissue rather than whole brain tissue also allows us to detect more regionally specific changes. Substantial methylation variation in our homogenate data likely comes from profiling mixtures of neuronal cells at different maturation states in the developing cortex, which are becoming identified and profiled with increasing resolution [Citation13]. As this cellular heterogeneity was incorporated into our methylation analyses of age, we were able to identify that most age-associated sites were not associated with cellular composition, suggesting these age affects may be shared across many neuronal cell states and not reflective of the shifting cellular landscape of the brain. Future single nuclei WGBS profiling can ideally improve our broad deconvolution-estimated cell classes, which was based on a very small number of samples in culture using microarrays [Citation28].
We also find that there are autosomal differences in DNAm between the sexes, though by our assessment they seem less functionally significant. They may be acting more in trans which makes it more difficult to assess significance, but there are also just generally far fewer transcriptomic differences between sexes than between ages. Sex-differential DNAm later in life has been linked to psychiatric genes, which has been proposed as a mechanism for sex differences in psychiatric disorders [Citation29], so perhaps the early changing DNAm is laying the groundwork for future effects. Like Xia et al. [Citation29], we found that ASD-associated genes are differentially methylated between the sexes, but this does not readily translate into transcriptomic differences.
Given the consistent enrichment in our developmentally associated sites for psychiatric-linked genes, these data support the notion of early neurodevelopmental components for disorders such as schizophrenia [Citation7,Citation30,Citation31]. Genes implicated in bipolar disorder, schizophrenia, and ASD are clearly dynamic at this time point in life, so dysregulation at this stage could lead to vulnerabilities to these disorders later in life. Our data also imply that BMI and subjective well-being – non-disease traits – could be linked to neural development at this stage of life.
As more data are generated, particularly through genome-scale methods like WGBS, we will be able to establish normal ranges of DNAm at all ages, which will undoubtedly provide insight into molecular dynamics in this hard-to-study period and organ, as well as give clues to where deviation from the norm is important. Unfortunately, WGBS still does not distinguish between methylation (5mC) and hydroxymethylation (5hmC), another chemical modification thought to be an important state in active demethylation. However, previous research has suggested that levels of 5hmC are very low in this developmental time period [Citation32], suggesting that 5mC is likely driving the vast majority of our age-associated methylation differences.
Our findings are only the beginning of what may be found given the limited sample size of our study, but even here we reveal important processes. There is room for much more characterization of these epigenetic marks, but it is clear that they are worth understanding. DNA methylation serves as an exciting potential avenue to understand neural development and psychiatric disorders. There are clear and functional changes in the neuronal DNAm landscape over this important window of brain development and between sexes, and further investigation will help elucidate unknown mechanisms in the brain.
Materials and methods
Study samples
Brain tissue from these second-trimester prenatal samples was obtained via a Material Transfer Agreement with the National Institute of Child Health and Human Development Brain and Tissue Bank. All specimens were flash-frozen, then brain pH was measured and post-mortem interval (PMI, in hours) was calculated for every sample (mean = 2.85 hours). Post-mortem tissue homogenates of the dorsolateral prefrontal cortex (DLPFC) were obtained from all subjects. Samples were obtained from the developing prefrontal cortex from the dorsolateral convexity of the frontal lobe half-way between the frontal pole and temporal pole, 4 mm lateral to the central sulcus. Specimens extended from the surface of the brain to the ventricular zone. There were 10 of each male and female subjects, and 17 subjects were of African American ancestry and 3 were of European ancestry (Table S1), and the samples had no observable neuropathological insults.
Data generation
Genomic DNA was extracted from 100 mg of pulverized DLPFC tissue with the phenol-chloroform method. DNA was subjected to bisulfite conversion followed by sequencing library preparation using the TruSeq DNA methylation kit from Illumina. Lambda DNA was spiked in prior to bisulfite conversion to assess its rate, and we used 20% PhiX to better calibrate Illumina base calling on these lower complexity libraries. Resulting libraries were pooled and sequenced on an Illumina HiSeq X Ten sequencer with paired end 150bp reads (2x150bp), targeting 90Gb per sample. This corresponds to 30x coverage of the human genome as extra reads were generated to account for the addition of PhiX. These WGBS libraries were constructed and sequenced independently from the same DNAs described in Price et al., 2019 [Citation1]
Data processing
The raw WGBS data were processed using FastQC to control for quality of reads [Citation33], Trim Galore to trim reads and remove adapter content [Citation34], Arioc for alignment to the GRCh38.p12 genome (obtained from ftp://ftp.ncbi.nlm.nih.gov/genomes/all/GCA/000/001/405/GCA_000001405.27_GRCh38.p12/GCA_000001405.27_GRCh38.p12_assembly_structure/Primary_Assembly/assembled_chromosomes/) [Citation35], duplicate alignments were removed with SAMBLASTER [Citation36], and the Bismark methylation extractor to extract methylation data from the sequencing data [Citation37]. We then used the bsseq R/Bioconductor package (v1.18) to process and combine the DNA methylation proportions across the samples for all further manipulation and analysis [Citation15]. After initial data metrics were calculated, the methylation data were smoothed using BSmooth for modelling. CpGs were filtered to those that had ≥3 coverage in all samples, and CpHs were filtered to those that had ≥3 coverage and non-zero methylation in at least half (≥10) of the samples.
Comparison to 450k
In order to compare WGBS methylation levels to 450k methylation levels, we used data from the same samples using the two methods (from GEO: GSE74193), and compared their methylation levels at the same sites both graphically () and assessing the mean differences and root-mean-square deviation (). We then validated our model’s findings by applying the same model to the microarray data to overlapping sites and considered loci significant at FDR < 0.05 and validated if its association had p < 0.05 in the validating set (Figure S3).
Gene set enrichment
We annotated our data using Gencode v. 29 on hg38. We performed gene set enrichment using clusterProfiler (v3.12) [Citation38] for Gene Ontology [Citation50] sets with a p-value cut-off of 0.01 and q-value cut-off of 0.05. We used SFARI 2.0, accessed on 5/16/2019 [Citation21] for an autism spectrum disorder gene set, and a set of clinical gene sets defined by Birnbaum et al. for other neuropsychiatric and neurodevelopmental disorders: four schizophrenia sets based on copy number variants, GWAS, and meta-analysis, two ASD sets based on GWAS and copy number variants, and one set each for neurodegenerative disorders, neurodevelopmental disorders, intellectual disability, and bipolar disorder [Citation20]. We also tested for enrichment using an ASD-exome gene set [Citation22], differentially expressed gene sets [Citation23,Citation39], and transcriptome-wide association study signals [Citation23,Citation40]. Enrichment was calculated on a background of genes expressed in our samples, to avoid brain bias. We performed LD score regression as described by Finucane et al. [Citation24] and with data from recent GWAS [Citation41,Citation42].
Data analysis
We performed cellular deconvolution on our WGBS data using microarray-based reference datasets, which was adapted from Jaffe et al., 2015 [Citation43] and Jaffe et al., 2016 [Citation9]. Briefly, this approach uses 5 different cell classes from Illumina 450k microarray data: (1) ESCs, (2) NPCs derived from ESCs, and (3) dopamine neurons derived from ESCs, from Kim et al. [Citation28] and (4) neurons and (5) non-neurons obtained by NeuN+ sorting from adult DLPFC from Kaminsky et al., 2013 [Citation12]. Importantly, these five cell types were estimated in a single deconvolution model, and we previously showed in the above manuscripts that DNAm and gene expression in prenatal samples was strongly associated with the estimated ESC and NPC cell fractions. Here, we first filtered those sites on the Illumina 450k that were well covered in our WGBS data (N = 324,225), and then constructed the deconvolution model (CpGs of interest and corresponding model parameters) following the strategy of Jaffe & Irizarry 2014 [Citation44]. We then applied this model to our WGBS data at these sites to estimate the fraction of each of the five cell types in each sample.
Differential methylation analyses for age were performed using linear regression modelling, accounting for sex, age, and estimated ESC fraction. The association between sex and DNAm was extracted from this same model, those significant sex-associated CpGs (and their surrounding sequence, 150 bp window) were re-aligned to the genome with Bowtie2 [Citation45] to check for homology to ensure that detected autosomal regions were not potentially misaligned homologous regions from the sex chromosomes. The regression analyses above were formed using limma (v3.30) [Citation46,Citation47] which employed empirical Bayes and returned moderated T-statistics, which were used to calculate p-values and estimate the false discovery rate (FDR, via Benjamini-Hochberg approach [Citation48]).
RNA-seq comparison analysis
The homogenate RNA-seq samples were also part of a larger study of RNA-seq data from homogenate DLPFC tissue (BrainSeq Consortium Phase I) [Citation49]. We compared a site’s methylation or mean methylation (for DMRs) to the expression level from RNA-seq using a linear model adjusting for the strongest covariates, including sex, age, and estimated embryonic stem cell (ESC) fraction.
Authors’ contributions
KAPM, AJP, JEK, and AEJ conceptualized the project and methodology. KAPM and AEJ investigated and analyzed the data and wrote the paper. LCT, ASS, RW, and NJE provided software support. AJP, RT, TMH, and RW curated data. JEK, RT, and TMH provided resources. AJP, LCT, AEJ, and DRW reviewed and edited the paper. DRW provided supervision, and AEJ was the principal investigator and oversaw experimental design and analysis. All authors read and approved the final manuscript.
Ethics approval and consent to participate
Postmortem brain tissue was obtained via a Material Transfer Agreement with the National Institute of Child Health and Human Development Brain and Tissue Bank which collected the tissue under an IRB-approved protocol and consent of the next-of-kin (https://www.medschool.umaryland.edu/btbank/).
Supplemental Material
Download MS Word (495.2 KB)Supplemental Material
Download MS Excel (6.1 MB)Acknowledgments
The authors thank the UMB Brain Bank at the Department of Pediatrics in the University of Maryland School of Medicine for the tissue provided. This project was supported by the Lieber Institute for Brain Development and by NIH grants R21MH102791, R01MH112751, and T32GM781437. Finally, we are indebted to the generosity of the families of the decedents, who donated the brain tissue used in these studies.
Availability of data and materials
Raw and processed nucleic acid sequencing data generated to support the findings of this study are part of the PsychENCODE Consortium and the Brainseq Consortium data releases. Specifically, WGBS data have been deposited at www.Synapse.org along with the other PsychENCODE data, under the accession code syn5842535. The homogenate RNA-seq samples were also part of a larger study of RNA-seq data from homogenate DLPFC tissue (BrainSeq Consortium Phase I) [50], which was also deposited at www.synapse.org and summarized in http://eqtl.brainseq.org/phase1. The processed, homogenate RNA-seq data for this study have additionally been deposited via Globus under the jhpce#brainepi-cellsorted collection at the following location: http://research.libd.org/globus/jhpce_brainepi-cellsorted/. NeuN-sorted RNA-seq data were originally published as part of phase II of the Brainseq Consortium (http://eqtl.brainseq.org/phase2/) and have also been deposited via Globus under the jhpce#brainepi-polyA collection at the following location: http://research.libd.org/globus/jhpce_brainepi-polyA/. Publicly available data reprocessed in support of the conclusions in this work were downloaded from the Gene Expression Omnibus under GEO accession GSE47966 and GSE74193.
Disclosure statement
The authors declare no competing interests.
Supplementary material
Supplemental data for this article can be accessed here.
Additional information
Funding
References
- Price AJ, Collado-Torres L, Ivanov NA, et al. Divergent neuronal DNA methylation patterns across human cortical development reveal critical periods and a unique role of CpH methylation. Genome Biol. 2019;20(1):196.
- Kang HJ, Kawasawa YI, Cheng F, et al. Spatio-temporal transcriptome of the human brain. Nature. 2011;478:483–489.
- Jakovcevski M, Akbarian S. Epigenetic mechanisms in neurological disease. Nat Med. 2012;18:1194–1204.
- Heijmans BT, Tobi EW, Stein AD, et al. Persistent epigenetic differences associated with prenatal exposure to famine in humans. Proc Natl Acad Sci USA. 2008;105:17046–17049.
- Breitling LP, Yang R, Korn B, et al. Tobacco-smoking-related differential DNA methylation: 27K discovery and replication. Am J Hum Genet. 2011;88:450–457.
- Reichard JF, Schnekenburger M, Puga A. Long term low-dose arsenic exposure induces loss of DNA methylation. Biochem Biophys Res Commun. 2007;352:188–192.
- Birnbaum R, Weinberger DR. Genetic insights into the neurodevelopmental origins of schizophrenia. Nat Rev Neurosci. 2017;18:727–740.
- Callicott JH, Mattay VS, Verchinski BA, et al. Complexity of prefrontal cortical dysfunction in schizophrenia: more than up or down. Am J Psychiatry. 2003;160:2209–2215.
- Jaffe AE, Gao Y, Deep-Soboslay A, et al. Mapping DNA methylation across development, genotype and schizophrenia in the human frontal cortex. Nat Neurosci. 2016;19:40–47.
- Spiers H, Hannon E, Schalkwyk LC, et al. Methylomic trajectories across human fetal brain development. Genome Res. 2015;25:338–352.
- Montaño CM, Irizarry RA, Kaufmann WE, et al. Measuring cell-type specific differential methylation in human brain tissue. Genome Biol. 2013;14:R94.
- Guintivano J, Aryee MJ, Kaminsky ZA. A cell epigenotype specific model for the correction of brain cellular heterogeneity bias and its application to age, brain region and major depression. Epigenetics. 2013;8:290–302.
- Polioudakis D, de la Torre-ubieta L, Langerman J, et al. A single-cell transcriptomic atlas of human neocortical development during Mid-gestation. Neuron. 2019;103(785–801):e8.
- Lister R, Mukamel EA, Nery JR, et al. Global epigenomic reconfiguration during mammalian brain development. Science. 2013;341:1237905.
- Hansen KD, Langmead B, Irizarry RA. BSmooth: from whole genome bisulfite sequencing reads to differentially methylated regions. Genome Biology. 2012;13(10):R83.
- Jaffe AE, Murakami P, Lee H, et al. Bump hunting to identify differentially methylated regions in epigenetic epidemiology studies. Int J Epidemiol. 2012;41:200–209.
- Kundaje A, Meuleman W, Ernst J, et al.; Roadmap Epigenomics Consortium. Integrative analysis of 111 reference human epigenomes. Nature. 2015;518:317–330..
- Wang D, Liu S, Warrell J, et al. Comprehensive functional genomic resource and integrative model for the human brain. Science. 2018;362. DOI:10.1126/science.aat8464..
- Guo JU, Su Y, Shin JH, et al. Distribution, recognition and regulation of non-CpG methylation in the adult mammalian brain. Nat Neurosci. 2014;17:215–222.
- Birnbaum R, Jaffe AE, Hyde TM, et al. Prenatal expression patterns of genes associated with neuropsychiatric disorders. Am J Psychiatry. 2014;171:758–767.
- Abrahams BS, Arking DE, Campbell DB, et al. SFARI Gene 2.0: a community-driven knowledgebase for the autism spectrum disorders (ASDs). Mol Autism. 2013;4:36.
- Satterstrom FK, Kosmicki JA, Wang J, et al. Large-scale exome sequencing study implicates both developmental and functional changes in the neurobiology of autism. Cell. 2020;180:568–584.e23.
- Gandal MJ, Zhang P, Hadjimichael E, et al. Transcriptome-wide isoform-level dysregulation in ASD, schizophrenia, and bipolar disorder. Science. 2018;362. DOI:10.1126/science.aat8127.
- Finucane HK, Bulik-Sullivan B, Gusev A, et al. Partitioning heritability by functional annotation using genome-wide association summary statistics. Nat Genet. 2015;47:1228–1235.
- Schizophrenia working group of the psychiatric genomics consortium. Biological insights from 108 schizophrenia-associated genetic loci. Nature. 2014;511:421–427.
- Sharma A, Klein SS, Barboza L, et al. Principles Governing DNA Methylation during Neuronal Lineage and Subtype Specification. J Neurosci. 2016;36:1711–1722.
- Won H, de la Torre-ubieta L, Stein JL, et al. Chromosome conformation elucidates regulatory relationships in developing human brain. Nature. 2016;538:523–527.
- Kim M, Park Y-K, Kang T-W, et al. Dynamic changes in DNA methylation and hydroxymethylation when hES cells undergo differentiation toward a neuronal lineage. Hum Mol Genet. 2014;23:657–667.
- Xia Y, Dai R, Wang K, et al. Sex-differential DNA methylation and associated regulation networks in human brain implicated in the sex-biased risks of psychiatric disorders. Mol Psychiatry. 2019. DOI:10.1038/s41380-019-0416-2.
- Fatemi SH, Folsom TD. The neurodevelopmental hypothesis of schizophrenia, revisited. Schizophr Bull. 2009;35:528–548.
- Weinberger DR. Implications of normal brain development for the pathogenesis of schizophrenia. Arch Gen Psychiatry. 1987;44:660–669.
- Spiers H, Hannon E, Schalkwyk LC, et al. 5-hydroxymethylcytosine is highly dynamic across human fetal brain development. BMC Genomics. 2017;18:738.
- Babraham Bioinformatics. FastQC; 2016. [cited 2018 Mar 20]. https://www.bioinformatics.babraham.ac.uk/projects/fastqc/
- FelixKrueger/TrimGalore: A wrapper around Cutadapt and FastQC to consistently apply adapter and quality trimming to FastQ files, with extra functionality for RRBS data. [cited 2019 Feb 15]. https://github.com/FelixKrueger/TrimGalore
- Wilton R, Li X, Feinberg AP, et al. Arioc: GPU-accelerated alignment of short bisulfite-treated reads. Bioinformatics. 2018;34:2673–2675.
- Faust GG, Hall IM. SAMBLASTER: fast duplicate marking and structural variant read extraction. Bioinformatics. 2014;30:2503–2505.
- Krueger F, Andrews SR. Bismark: a flexible aligner and methylation caller for Bisulfite-Seq applications. Bioinformatics. 2011;27:1571–1572.
- Yu G, Wang L-G, Han Y, et al. clusterProfiler: an R package for comparing biological themes among gene clusters. OMICS. 2012;16:284–287.
- Collado-Torres L, Burke EE, Peterson A, et al. Regional heterogeneity in gene expression, regulation, and coherence in the frontal cortex and hippocampus across development and schizophrenia. Neuron. 2019;103(203–216):e8.
- Jaffe AE, Hoeppner DJ, Saito T, et al. Profiling gene expression in the human dentate gyrus granule cell layer reveals insights into schizophrenia and its genetic risk. Nat Neurosci. 2020. DOI:10.1038/s41593-020-0604-z.
- Brainstorm Consortium, Anttila V, Bulik-Sullivan B, Finucane HK, et al. Analysis of shared heritability in common disorders of the brain. Science. 2018:360. DOI:10.1126/science.aap8757.
- Rizzardi LF, Hickey PF, Rodriguez DiBlasi V, et al. Neuronal brain-region-specific DNA methylation and chromatin accessibility are associated with neuropsychiatric trait heritability. Nat Neurosci. 2019;22:307–316.
- Jaffe AE, Shin J, Collado-Torres L, et al. Developmental regulation of human cortex transcription and its clinical relevance at single base resolution. Nat Neurosci. 2015;18:154–161.
- Jaffe AE, Irizarry RA. Accounting for cellular heterogeneity is critical in epigenome-wide association studies. Genome Biol. 2014;15:R31.
- Langmead B, Salzberg SL. Fast gapped-read alignment with Bowtie 2. Nat Methods. 2012;9:357–359.
- Ritchie ME, Phipson B, Wu D, et al. limma powers differential expression analyses for RNA-sequencing and microarray studies. Nucleic Acids Res. 2015;43:e47.
- Phipson B, Lee S, Majewski IJ, et al. Robust hyperparameter estimation protects against hypervariable genes and improves power to detect differential expression. Ann Appl Stat. 2016;10:946–963.
- Benjamini Y, Hochberg Y. Controlling the false discovery rate: A practical and powerful approach to multiple testing. J Royal Statist Soc. 1995;57:289–300.
- Jaffe AE, Straub RE, Shin JH, et al. Developmental and genetic regulation of the human cortex transcriptome illuminate schizophrenia pathogenesis. Nat Neurosci. 2018;21:1117–1125.
- The Gene Ontology Consortium, The Gene Ontology Resource: 20 years and still GOing strong, Nucleic Acids Research, Volume 47, Issue D1, 08 January 2019, Pages D330–D338, https://doi.org/10.1093/nar/gky1055