
ABSTRACT
Alterations in environmentally sensitive epigenetic mechanisms (e.g., DNA methylation) influence axonal regeneration in the spinal cord following sharp injury. Conventional DNA methylation detection methods using sodium bisulphite treatment do not distinguish between methylated and hydroxymethylated forms of cytosine, meaning that past studies report a composite of 5-methylcytosine (5mC) and 5-hydroxymethylcytosine (5hmC). To identify the distinct contributions of DNA methylation modifications to axonal regeneration, we collected spinal cord tissue after sharp injury from untreated adult F3 male rats with enhanced regeneration of injured spinal axons or controls, derived from folate- or water-treated F0 lineages, respectively. Genomic DNA was profiled for genome-wide 5hmC levels, revealing 658 differentially hydroxymethylated regions (DhMRs). Genomic profiling with whole genome bisulphite sequencing disclosed regeneration-related alterations in composite 5mC + 5hmC DNA methylation levels at 2,260 differentially methylated regions (DMRs). While pathway analyses revealed that differentially hydroxymethylated and methylated genes are linked to biologically relevant axon developmental pathways, only 22 genes harbour both DhMR and DMRs. Since these differential modifications were more than 60 kilobases on average away from each other, the large majority of differential hydroxymethylated and methylated regions are unique with distinct functions in the axonal regeneration phenotype. These data highlight the importance of distinguishing independent contributions of 5mC and 5hmC levels in the central nervous system, and denote discrete roles for DNA methylation modifications in spinal cord injury and regeneration in the context of transgenerational inheritance.
Introduction
The peripheral nervous system (PNS) is capable of repair following injury. In contrast, the regenerative properties of the central nervous system (CNS) are strikingly limited following spinal cord injury, stroke, and other conditions of the CNS [Citation1–3]. The unique capacity for functional recovery in the PNS is linked to the rapid response of transcription factors that are driven by both genetic and environmental contributions [Citation4–6]. These contributions implicate environmentally sensitive molecular marks, such as DNA methylation, in the regulation of gene expression related to functional recovery.
DNA methylation (5-methylcytosine [5mC]) is the most studied epigenetic modification, and is an environmentally sensitive component in wide-spread regulation of gene expression. While 5mC is found in every tissue and cell type, its abundance and distribution are both tissue- and cell-type specific, resulting in the precise regulation of gene expression for critical biological processes including neuronal survival and synaptic plasticity [Citation7–15]. 5mC predominantly resides at CpG dinucleotides in eukaryotes. However, recent reports have identified 5mC levels at CpH dinucleotide contexts (i.e., mCH: CpA, CpC, and CpT) [Citation16], suggesting a broader role for this modification. To date, the roles of non-canonical methylation marks have been incompletely characterized. The folate pathway significantly participates in methyl donor pathways, and DNA methylation levels are directly affected by folate abundance [Citation17]. Recent data showing that ancestral folate supplementation results in spinal cord axonal regeneration [Citation18] indicate that folate influences DNA methylation levels that may function by altering gene expression levels driving the regeneration processes.
While DNA methylation studies have primarily focused on 5mC, oxidation of 5mC by the ten-eleven translocation (TET) family of enzymes generates stable molecular derivatives, including 5-hydroxymethylcytosine (5hmC). Conventional DNA methylation detection methods, such as sodium bisulphite DNA sequencing, do not distinguish between 5mC and 5hmC. Recent introduction of genome-wide methods capable of discriminating between 5mC and 5hmC demonstrates that 5hmC may have central nervous system (CNS)-specific functions, in view of its greater than 10-fold enrichment in the CNS compared to peripheral tissues, its association with the regulation of neuronal activity, and its accumulation in the brain during neuronal development and maturation and the ageing process [Citation19,Citation20]. Moreover, perturbations in the genome-wide 5hmC landscape are linked to developmental (e.g., Rett syndrome) and neurodegenerative (e.g., Alzheimer’s) disorders, underscoring a role for 5hmC in the establishment, maintenance, and survival of the CNS [Citation21,Citation22].
The role of 5hmC in axonal regeneration remains unknown. Here, we examined genome-wide profiles of axon regeneration-related 5hmC levels in response to ancestral folate supplementation, and compared them to axon regeneration-related composite 5mC + 5hmC DNA methylation levels to determine the unique contributions of these DNA methylation modifications to the regeneration process. These data reveal that the large majority of axon regeneration-related 5hmC and 5mC sites are unique, and most probably have distinct functions in spinal cord injury and regeneration.
Results
5hmC levels are disrupted during axonal regeneration
Ancestral folate supplementation enhances transgenerational axonal regeneration of injured spinal axons in vivo and in vitro [Citation18]. To examine the role of 5hmC in the enhanced axonal regeneration phenotype, we collected spinal cord tissue from untreated adult F3 rats that showed statistically significant improvement in axonal regeneration following sharp spinal cord injury, in response to daily folic acid injections to their F0 progenitors compared to untreated F0 control [Citation18]. Genomic DNA from the spinal cord tissues of the untreated enhanced axonal regeneration and control F3 progeny were genome-wide profiled for 5hmC using a chemical labelling and affinity purification method [Citation23–26] coupled with high-throughput sequencing technology. This approach yielded an average of 26.5 million paired-end reads mapped from each genome (Methods; Supplementary Table 1). Read density mapping showed no visible differences among the chromosomes, except depletion on the X chromosome, which is consistent with previous observations [Citation23,Citation24,Citation26].
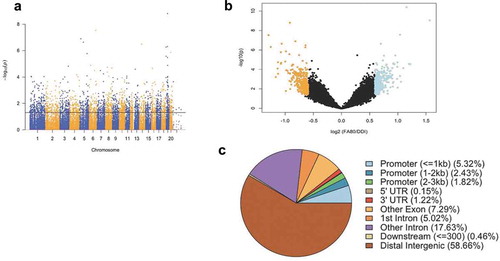
Significant accumulations of uniquely mapped reads represent hydroxymethylated regions throughout the rat genome. Differentially hydroxymethylated regions (DhMRs) associated with regeneration were identified in both enhanced axonal regeneration and control groups (Methods). Hydroxymethylated regions found in enhanced axonal regeneration rats were classified as hyper-DhMRs, and hydroxymethylated regions absent in enhanced axonal regeneration rats (present in control rats) were classified as hypo-DhMRs. A total of 658 differentially hydroxymethylated regions (DhMRs) were observed across the entire genome, except on the Y chromosome (P-value < 0.05, Fold change > 1.5; )). There was a similar number of hyper-DhMRs (N = 342) compared to hypo-DhMRs (N = 316; )). DhMR annotation to recognized genomic structures revealed that the majority (75%) of DhMRs reside either distal to annotated genes (58%) or within intronic regions of genes (17%; )). Annotation of the 658 DhMRs to genes revealed 255 unique genes, including 10 genes with known roles in axonal regeneration (e.g., Abca1, Adam10, Ank3, Cntf, and Tgif1) [Citation27]. Together, these findings suggest 5hmC levels influence the enhanced axonal regeneration phenotype.
Figure 1. Axonal regeneration-related changes in 5hmC after ancestral folate supplementation. (a) A Manhattan plot depicts genomic distribution of 5hmC across the genome. Correlated DhMRs are displayed with the -log10 of the P-value (y-axis) for each chromosome (x-axis). Significant DhMRs (P-value < 0.05) are displayed above the black line, while all DhMRs alternate between blue and orange to indicate each chromosome. (b) Volcano plot displays the relation of the log2(fold-change) of 5hmC (x-axis) and the statistical significance – log10(P-value) (y-axis). Hyper- and hypo-DhMRs (P-value < 0.05; fold-change > 1.5x) are depicted in blue and orange, respectively. Candidate regions that did not meet significance cut-offs are depicted in black. (c) Pie chart showing the per cent distribution of DhMRs to standard genomic features
Differential hydroxymethylation and methylation occur at distinct genomic loci
To discriminate the unique contributions of DNA methylation modifications (i.e., 5mC and 5hmC) to axonal regeneration, genomic DNA from the same tissues profiled for 5hmC was whole genome bisulphite sequenced, and approximately 432 million paired-end sequence reads were generated per sample (enhanced axonal regeneration [FA80]: N = 3, control [DDI]: N = 3). An average of 320 million paired-end sequence reads (~75%) successfully mapped to the Rattus norvegicus (rn6) genome (Methods; Supplementary Table 2). Following sequence read de-duplication processes and the removal of CpG dinucleotides with low read coverage, an average of 22.7 million CpG positions were analysed per sample. The average DNA methylation abundance across the entire genome did not significantly differ between groups (enhanced axonal regeneration: 74.7%; control: 75.8%, )), suggesting there are no global changes to DNA methylation (5mC + 5hmC) abundance related to axonal regeneration. Despite this finding, unsupervised hierarchical clustering of DNA methylation (5mC + 5hmC) levels across the entire genome revealed that enhanced axonal regeneration and control samples clustered away from each other ()), thereby indicating that DNA methylation (5mC + 5hmC) levels are able to distinguish enhanced axonal regeneration tissues from control tissues.
Figure 2. Axonal regeneration-related changes in 5mC after ancestral folate supplementation. (a) Bar graph depicts the per cent global 5mC levels in samples with enhanced axonal regeneration samples (FA80) and low axonal regeneration samples (DDI). (b) Unsupervised hierarchical clustering using global 5mC levels from samples that exhibit enhanced axonal regeneration (FA80) and low axonal regeneration (DDI). (c) Circos plot depicting the chromosomes (Outer ring) of the rat genome that were examined by whole-genome bisulphite sequencing. Each chromosomes is a different colour and the chromosome size is represented by the bar length. (Inner ring) Blue lines represent the relative location of differentially methylated regions (DMRs) across all chromosomes. (d) Scatterplot depicts the level of differential methylation between sample groups. The average per cent DMR methylation of the enhanced axonal regeneration samples (FA80; y-axis) and low axonal regeneration samples (DDI; x-axis) are shown. Hyper- and hypo-DMRs are shown in red and blue, respectively
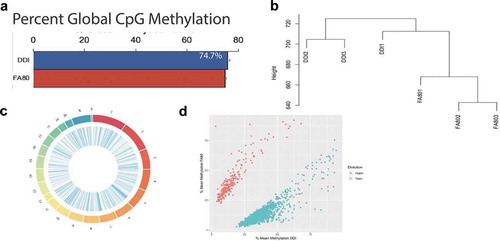
To investigate locus-specific DNA methylation (5mC + 5hmC) levels linked to axonal regeneration, whole genome methylation data were subjected to a smoothing process and dispersion shrinkage algorithm that provides enhanced sensitivity, accuracy, and biological plausibility compared with previous methods [Citation28]. This approach detected 1,636 differentially methylated regions (DMRs) distributed across the entire genome, except the Y chromosome (cluster of ≥5 CpGs with P-value < 0.00001 and >10% change in methylation; ); Supplementary Dataset 2; methods). A total of 225 hyper- and 1,411 hypo-DMRs were distinguished ()), indicating that the majority of sites that contribute to axonal regeneration have reductions in DNA methylation (5mC + 5hmC) levels, in keeping with previous reports [Citation29]. Annotation of the 1,636 DMRs to genes revealed 1,028 unique genes that harbour disruptions in DNA methylation (5mC + 5hmC), including over 70 genes known to participate in axon regeneration (e.g., Igf2, Pten, Vegfa, and Rxrb) [Citation30]. These data corroborate previous evidence that ancestral folate supplementation exhibits long-lasting transgenerational alterations to the epigenome through three generations of untreated progeny, and promotes enhanced axonal regeneration.
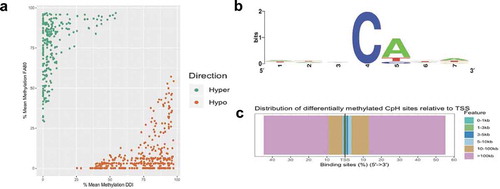
Whole genome sequence data also provide the opportunity to interrogate genome-wide levels of DNA methylation occurring at non-CpG sites (i.e., CpA, CpC, and CpT, collectively referred to as mCH sites). Differential methylation analysis of CpH sites identified 624 differentially methylated CpH (DmCH) sites associated with axonal regeneration, including 256 and 368 hyper- and hypo-DmCH sites (FDR P-value < 0.05; ); Supplementary Dataset 3). Sequence motif analysis of nucleotides immediately flanking the DmCH sites showed a significant over-representation of CpA dinucleotides (>80%; P-value < 0.05; )), which is consistent with previous reports [Citation31]. While annotation of the 624 DmCH sites to genes only revealed 66 genes, 20 of these function in neuronal growth and development, such as Nrg1, Robo1, and Slc8a1 [Citation27]. The large majority (~80%) of DmCH sites were located in distal intergenic regions of the genome more than 100 kilobases away from any annotated gene ()), illustrating that mCH methylation levels linked to axonal regeneration reside largely in unannotated regions of the genome.
Figure 3. Axonal regeneration-related changes in 5mC at CpH dinucleotides after ancestral folate supplementation. (a) Scatterplot depicts the level of differential methylation between sample groups. The average per cent DMR methylation of the enhanced axonal regeneration samples (FA80; y-axis) and low axonal regeneration samples (DDI; x-axis) are shown. Hyper- and hypo-DMRs are shown in green and orange, respectively. (b) A sequence motif plot depicts the relative abundance of nucleotides immediately flanking the DmCH site. The asterisk indicates that the CpA context is significantly more common compared to CpT or CpC (P-value < 0.05). (c) Modified bar plot depicts the relative abundances of DmCH sites in relation to gene transcription start sites (TSSs). The distance (legend colours) upstream or downstream of the TSS is shown from 5ʹ to 3ʹ (x-axis)
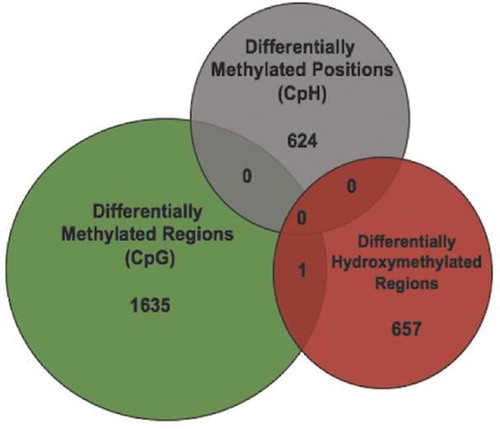
Because DMRs may represent differential 5mC or 5hmC, we overlaid the DMRs with the DhMRs to determine the origin of the DMR finding. Overlap would support a 5hmC contribution to the DMRs. Only 1 DMR overlapped with a DhMR, located in an exon of the Ush1 g gene (), and there were no overlaps between DhMRs and DmCH loci. In addition, 22 genes carry both DhMR and DMRs, differential modifications that were on average more than 60 kilobases away from one another. These data indicate that the large majority of axonal regeneration-related differential hydroxymethylation and methylation positions are unique, and likely have distinct functions in the axonal regeneration phenotype.
Figure 4. Differential 5hmC and 5mC occur at distinct genomic loci. (a) Venn diagram illustrates the overlap between genomic coordinates of DMRs (N = 1636; green), DmCH sites (N = 624; grey), and DhMRs (N = 658; red)
Identification of potentially functional DNA hydroxymethylation and methylation
To gain insight into the potential mechanism for axonal regeneration-related changes in DNA hydroxymethylation and methylation (DhMRs, DMRs, and DmCH), we examined the sequence motifs of the nucleotides immediately flanking the differential loci. Significant enrichment of known transcription factor binding sites was observed, including forkhead box (FOX), hypoxia-inducible factor 1-a (HIF1A), aryl hydrocarbon receptor nuclear translocator (ARNT), and interferon regulatory factor 4 (IRF4), all of which are linked to regeneration of DRG axons after peripheral nerve injury (P-value < 0.01; ); Dataset 4) [Citation32]. These findings suggest that regeneration-related DNA methylation (5hmC + 5mC) regulates gene expression by altering transcription factor binding affinity in the CNS.
Figure 5. Combined cytosine modifications display potential functions. (a) Venn Diagram depicts the overlap between modified cytosine regions in the rat genome (pink) with known neuronal enhancer regions in the mouse genome (yellow). (b) Venn diagram depicts the overlap between genes harbouring modified cytosine (DhMRs, DMRs, and DmCH sites) (blue) to axonal regeneration-related differentially expressed genes (orange). The asterisk denotes significant overlap (hypergeometric test; P-value < 0.05). (c) Potentially functional (PF) cytosine modifications. Genes with significant increases (green arrow) or decreases (red arrow) in expression levels (RNA) that have correlated significant increases (green arrow) or decreases (red arrow) in 5hmC and/or 5mC (CpG or CpH) levels (Methylation). The gene symbol (Gene) is shown for each scenario. (d) The top transcription factor motif enriched for each analysis is displayed. The specific cytosine modifications investigated is shown in the left panel (Modification), a logo plot depicts the top enriched sequence motif (P-value < 0.01) found for each modified cytosine in the centre panel (Motif), and the transcription factor known to bind the sequence motif are shown in the right panel (Transcription Factor). The lower panel depicts the top sequence motif (centre panel; Motif; P-value < 0.01) and corresponding transcription factor (right panel; Transcription Factor) found in all axonal regeneration-related differentially expressed genes (left panel; All RNA) and correlated axonal regeneration-related differentially cytosine modified and expressed genes (left panel; PF-modified cytosines)
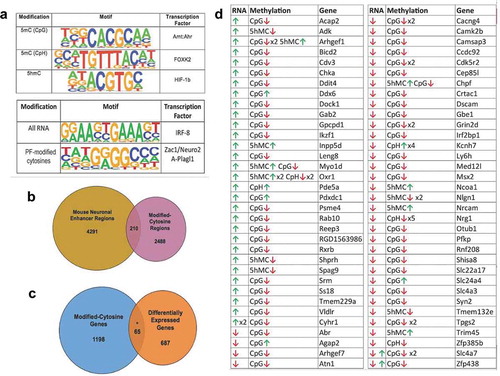
Since many DhMRs (58%), DMRs (43%), and DmCH (80%) reside distal to annotated genes, we investigated whether these genomic regions correlate with neuronal enhancer regions [Citation33]. Two hundred and ten of the differentially hydroxymethylated and methylated loci overlapped with known enhancers, and the large majority were DMRs (N = 207; )). Notably, the finding that DhMRs do not mark distal regulatory elements was supported by an independent approach (Methods). Because enhancer regions influence expression of genes more than one megabase away [Citation34], these data indicate that distal DMRs regulate gene expression by disrupting enhancer/promoter interactions.
Comparison of the DNA hydroxymethylation and methylation data to RNA sequencing (RNAseq) data generated from the same rats and spinal cord tissues [Citation18] identified a plurality of genes (N = 65) that have correlated differential hydroxymethylation/methylation and expression linked to neuronal regeneration, such as Rxrb, Syn2, and Dscam (P-value < 0.05; )). Investigation of the transcription factor motifs associated with these genes demonstrated significant enrichment of the ZAC1/Plagl1 transcription factor binding site (P-value < 0.01; )).
Differential hydroxymethylation and methylation are linked to axonal regeneration pathways
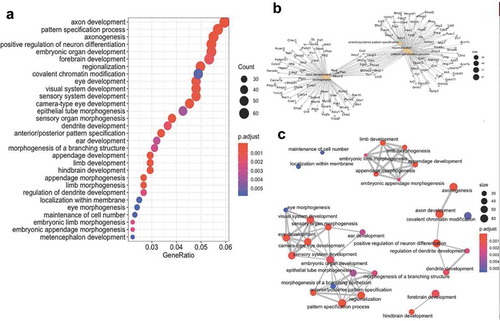
To further characterize genes and pathways linked to axonal regeneration, we next examined the gene ontologies (GO) of the differential hydroxymethylation- and methylation-associated genes. The analyses disclosed significant relationships between genes linked to processes involved in axon development, axonogenesis, and the regulation of neuron differentiation ()). Moreover, gene network mapping of the enrichment results identified three major gene network hubs: axonal/neuronal development; organ development; and appendage development ()). These data indicate that specific molecular pathways are influenced by changes in DNA hydroxymethylation and methylation during axonal regeneration.
Figure 6. Combined cytosine modification-associated genes pathways analysis. (a) Dot plot illustrating the top 30 gene ontological (GO) biological processes linked with the cytosine modification-associated genes (ordered by statistical significance from the top of the figure). The specific term (y-axis) and the ratio of genes contributing to each GO term (x-axis) are shown. The size of the dot is representative of the relative number of cytosine modification-associated genes contributing to each term. The colour of each dot represents the FDR P-value, shown in the legend, as determined by a Fischer test. (b) A gene-concept network plot shows the top five gene ontology terms (beige), the genes (grey) associated with each term, and the interconnectivity between genes and processes (lines). The size of the beige dot relates to the number of cytosine modification-associated genes contributing to that term. (c) An enrichment map plot depicts the connectivity of terms with each other, with hubs of similar processes clustering away from each other. Node (balls) sizes represent the relative number of cytosine modification-associated genes contributing to each term, while the colour represents the FDR P-value, shown in the legend, as determined by a Fischer test. The size of the edges (grey lines) depicts the strength of relatedness between terms
Discussion
Here, we report unique roles for 5hmC and 5mC in spinal cord injury and regeneration specific to a folate-induced transgenerational phenotype. In particular, we describe distinct regeneration-related 5hmC and 5mC levels at more than 2,800 sites throughout the genome, many of which appear to be functional (i.e., alter gene expression) by modulating transcription factor binding affinity and expression of genes related to axon growth and development. The genes and pathways marked by changes in these DNA methylation modifications, especially those that correlate to transcript levels, support insights into injury mechanisms and novel treatment targets for individuals suffering from spinal cord (and brain) trauma or disease.
Differential hydroxymethylation and methylation of axon regrowth genes
Our finding of close to zero overlap and only 22 genes that harbour both DhMR and DMRs (with an average distance of >60 kilobases from each other) strongly suggests that axonal regeneration-related DNA methylation modifications are unique with distinct functions (e.g., gene regulation) in the axonal regeneration phenotype. Genes having unique associations with DhMRs are biologically relevant to the axonal regenerative phenotype. For example, the DhMR with the lowest P-value is associated with the protein-O-fucosyltransferase-1 (Pofut1) gene [Citation35], whose product is required for Notch signalling critical for axon regeneration [Citation36]. In addition, another DhMR among the top 10 with the lowest P-value is linked to ankyrin-3 (Ank3), which functions at the axonal initial segment and nodes of Ranvier of neurons in the central and peripheral nervous systems [Citation37]. In turn, the top 10 DhMRs with the lowest P-value also are associated with genes known to function in injury-induced axon degeneration (e.g., Rreb1) [Citation38] and after traumatic brain injury (e.g., Abca1 [Citation39] and Kdm4a [Citation40]) pointing to distinct functions for 5hmC in spinal cord injury and regeneration.
Because they are strongly enriched in axon development- and axonogenesis-related gene ontology categories, genes with unique associations to DMRs also have biological relevance to the axonal regenerative phenotype. Important neurogenesis genes include Synapsin-2 (Syn2), which encodes a neuronal phosphoprotein associated with synaptic vesicles, is reported to be involved in improved epithelial organ regeneration [Citation41] and upregulated in lampreys following spinal cord injury, suggesting a role for Syn2 in neuronal regeneration [Citation42]. Our data further document methylation and transcriptional changes in glutamate ionotropic receptors, including NMDA type subset 2 C and 2D (Grin2 c and Grin2d), indicating that perturbation of glutamatergic signalling and synaptogenesis may be involved axonal regeneration, as previously suggested [Citation43].
Non-CpG methylation
In addition to investigating differential methylation in the canonical CpG dinucleotide context, we interrogated alterations in DmCH contexts. Notably, more than 500 of the 624 DmCH sites occurred in a CpA dinucleotide context, in line with previous studies showing that CpA methylation preferentially resides on actively transcribed neuronal genes, and with evidence that CpA methylation levels can be modulated by neuronal activity [Citation31]. The molecular mechanism of mCH methylation in axonal regeneration remains to be clarified, especially because a majority of differentially methylated sites occur in unannotated regions of the genome.
Hydroxymethylation and Methylation in enhancer regions
Much of the differential hydroxymethylation and methylation loci that we have identified reside in the distal intergenic regions of the genome. Gene expression enhancers are regulatory elements often located in the distal intergenic regions that affect the expression of genes greater than one megabase away [Citation34]. We investigated whether DhMRs and/or DMRs overlapped with annotated enhancers to account for changes in gene expression. Of the nearly 1,600 differential hydroxymethylation and methylation regions found in the distal intergenic regions in this study, only 210 coincided with the location of an annotated enhancer. Notably, these annotated neuronal enhancers were taken from the mouse genome, with limited relevant annotation of the rat genome. Conversion of the DhMR and DMR genomic coordinates to the mouse genome (mm9) is imperfect, and several regions (~25%) could not be converted due to poor sequence conservation between species. In addition, the genes neighbouring DhMRs/DMRs may be different between species. Thus, the 210 DhMRs and DMRs that overlapped with the mouse annotated neuronal enhancers likely represent an underestimate [Citation44].
Folate and DNA hydroxymethylation and methylation
Since the present axonal regeneration model was developed using untreated adult F3 male rats derived from an F0 lineage that was exposed to daily injections of folic acid, it is important to consider how folic acid may differentially affect 5hmC and 5mC levels. Folic acid is a primary donor of methyl groups in metabolic pathways [Citation45], suggesting that folate supplementation results in hypermethylation. Counterintuitively, the effect of folic acid on DNA methylation in injured spinal cord tissues was previously found to be dose-dependent and biphasic, with a gradual rise in global and gene-specific methylation at lower folate doses, reaching a maximum, after which higher folate doses lead to a gradual decline in methylation to baseline levels [Citation46]. While the effect of folic acid dose on inheritance of the spinal cord regeneration phenotype is unknown, the dose used here correlates fully with inheritance of the spinal cord regeneration phenotype in multiple generations of progeny. In this study, we found that ~90% of the DMRs are hypomethylated in the folate-derived group that exhibits enhanced axonal regeneration. In contrast, gross differences in hyper- or hypo-hydroxymethylation ratios were not found, suggesting that the observed bias is unique to 5mC. It was recently shown that demethylation is a key molecular feature of axonal regeneration [Citation29], which may underscore the importance of folate supplementation in axonal regeneration. Indeed, others have identified an inverse correlation between increasing intracellular folate concentrations and folate-dependent machinery [Citation47–50]; for example, a decreasing DNA methylation abundance was found in newborns with increasing maternal folic acid levels [Citation51]. While further investigation is needed to fully unravel the complex effects of folate on DNA hydroxymethylation and methylation and their inheritance, our investigation shows that ancestral folic acid has unique and long-lasting effects on 5hmC and 5mC.
Conclusions
We report that 5hmC and 5mC have distinct roles in spinal cord injury and regeneration specific to a folate-induced transgenerational phenotype. Axon regeneration-related changes in 5hmC and 5mC levels are prevalent and correlate with altered transcript levels, but very rarely overlap with each other. The majority of these changes are located far from coding sequences, and often overlap with known enhancer sites. Moreover, a significant enrichment of transcription factor binding sites among the differentially hydroxymethylated and methylation sites is observed, which jointly may explain disruptions in gene expression. Because levels of 5hmC and 5mC are modifiable over the lifespan, our findings support novel investigations into CNS injury mechanisms, and may one day provide candidate therapeutic substrates for individuals suffering from spinal cord and CNS injury and disease.
Methods
Animal care
A breeding lineage of rats from (IP) folate-supplemented vs. distilled de-ionized (DDI) water F0 progenitors was previously established and phenotyped for spinal axonal regeneration in vivo and in vitro [Citation18]. Specifically, male and female outbred Sprague-Dawley rats (SD) were used for the experiments. All animals were obtained from Harlan Laboratories Inc. (Madison, WI) and housed in approved facilities at the University of Wisconsin-Madison staffed by licenced staff veterinarians. All surgical procedures were conducted with approval of the University of Wisconsin Research Animal Resources and Care Committee, and in accordance with published NIH guidelines.
Folic acid and control lineages
As described previously [Citation18], 250 g Sprague-Dawley male (folic acid n = 3) and female (folic acid n = 3) rats were weighed and given daily intraperitoneal (IP) injections of 80 μg/kg of folic acid (APP Pharmaceuticals, Schaumberg, IL) as a 5 mg/mL solution diluted with DDI to 0.125 mg/mL, and injected daily in 20 μl volumes, based on the body weight obtained prior to the first injection. During pregnancy, the injections were made subcutaneously (SC) to avoid injury to the uterine contents. The animals were weighed before each injection. The injections took place between 9 am and 11 am, starting 3 days before the rats were mated in 3 separate cages. Injections in F0 males were continued daily until the pups were born. Injections in gravid F0 females were continued until pups were weaned at 21 days. Control F0 animals (n = 3 each gender) were injected with DDI using an identical protocol. Both control and enhanced axonal regeneration animals were fed identical diets (Harlan Rodent Diet #8604) that contains sufficient folate and all breeding was performed in a non-sibling manner. In the subsequent F1-F3 generations, females were used for breeding and males were used for either breeding or spinal cord injury but not both. Only males were phenotyped for axonal regeneration, because gender differences were not observed. The F3 rats in the current study were phenotyped for enhanced axonal regeneration prior to tissue collection [Citation18].
Surgery
A 10:1 mixture of ketamine/xylazine was administered IP under sterile conditions prior to surgery. The cervical cord was exposed by a C3 laminectomy and the dura opened under aseptic conditions. A 1-mm–deep dorsal column injury was made in both posterior columns using sharp jeweller forceps, severing the primary somatosensory axons ascending the spinal cord. A sciatic nerve graft was attached to the injury site to allow growth of injured spinal axons to re-grow into the permissive environment of the graft. Two weeks later, the animals were phenotyped for axonal elongation as previously described [Citation18]. In short, the wound was reopened under anaesthesia and a fluorescent retrograde tracer was placed at the free end of the nerve graft, tracking axons that have grown from the spinal cord into the graft. 48 h later animals were anesthetized, the fourth and fifth lumbar (L4–5) DRGs were removed bilaterally, fixed, sectioned, and scored for percentage of fluorescently labelled neuronal cells.
Tissue preparation and harvest
After the DRGs were removed for phenotyping, the animals were euthanized with 100 mg/kg IP of Beuthanasia-D Special (a combination of pentobarbital sodium and phenytoin sodium; Schering-Plough Animal Health Corp., Union, NJ). The spine was separated from the skull, and laminae were removed to expose the spinal cord. The intact spinal cord was divided into four equal parts that were stored separately at – 80ºC analysis. The 1-cm section below the injury site was used for the methylation studies, as well as the RNAseq studies previously reported [Citation18].
5hmC enrichment of genomic DNA
Chemical labelling-based 5hmC enrichment was described previously [Citation24,Citation25]. A total of 10ug of genomic DNA was sonicated to 300 bp and incubated for 1 h at 37°C in the following labelling reaction: 1.5 ul of N3-UDPG (2 mM); 1.5ulβ of -GT (60uM); and 3ul of 10X β-GT buffer, in a total of 30ul. Biotin was added and the reaction was incubated at 37°C for 2 h prior to capture on streptavidin-coupled dynabeads (Invitrogen, 65001). Enriched DNA was released from the beads during a 2-h incubation at room temperature with 100 mM DTT (Invitrogen, 15508013), which was removed using a Bio-Rad column (Bio-Rad, 732–6227). Capture efficiency was approximately 5–7% for each sample.
Library preparation and high-throughput sequencing
5hmC-enriched libraries were generated using the NEBNext ChIP-Seq Library Prep Reagent Set for Illumina sequencing, according to the manufacturer’s protocol. Briefly, the 5hmC-enriched DNA fragments were purified after the adapter ligation step using AMPure XP beads (Agencourt A63880). An Agilent 2100 BioAnalyzer was used to quantify the amplified library DNA and 20-pM of diluted libraries were used for sequencing. 50-cycle single-end sequencing was performed by the University of Wisconsin Biotechnology Centre. Image processing and sequence extraction were done using the standard Illumina Pipeline.
5hmC sequence alignment and peak calling
Raw FASTQ files were first inspected for quality using FastQC. Each paired-end mate file per sample was individually inspected. Because each sample was run on two lanes for sequencing, upstream-mates were concatenated to one file and downstream-mates were concatenated to a separate file. An average of 32.2 million paired-end reads was sequenced per sample. Alignment of paired-end mates to the rn6 genome was performed using Bowtie v1.2.2 [Citation52]. During alignment, only uniquely mapping reads with no more than 2 mismatches throughout the entire read and having the least amount of mismatches (-a – best – strata), with a maximum insertion length of 600 bp, were reported and used for downstream analysis. An average of 26.5 million (~82%) paired-end reads were successfully aligned to the genome. The Model-based Analysis of ChIP-Seq 2 (MACS2) algorithm v2.1.2 [Citation53] was used to estimate fragment size, call peaks, and identify peak summits from aligned paired-end reads using the following parameters: paired-end format, effective genome size of 1.9e9, bandwidth of 300 bp, a Benjamini-Hochberg false discovery rate (FDR) cut-off of 0.05, auto pair model process enabled, local bias computed in a surrounding one-kilobase window, and a maximum of one duplicate fragment to avoid PCR bias. Summits were extracted for each peak for each sample and extended ±500 bp for downstream analysis.
DhMR identification and genomic annotation
Peaks from control and treatment samples were imported into the R environment and converted to Granges objects. Peaks were redefined for each group for differential hydroxymethylation analysis as follows: peaks from each sample were pooled together, overlapping peaks were merged to form one region, peaks were extracted for further analysis if at least two samples had such an overlap. To form candidate regions for differentially hydroxymethylated region (DhMR) analysis, peaks from control and treatment groups were similarly pooled and merged. This produced 68,833 candidate regions for the comparison of enhanced axonal regeneration to control samples. DhMRs were identified using R package edgeR using Fisher’s exact [Citation54]. Reads from each sample were extended by the estimated fragment size determined by MACS2. Normalization factors, common dispersion, and tagwise dispersion were calculated, aimed at ameliorating differences in library size between samples. An FDR cut-off was tested for the DhMR detection and we found 22 DhMRs with a 0.05 cut-off (N = 181 DhMRs at FDR < 0.2), most distally intergenic and not annotated to any gene. While these data can be found in dataset 1, for downstream characterization and functional testing a cut-off was selected that included both a raw P-value <0.05 and a fold change in methylation level greater than 1.5X, which produced 658 DhMRs. DhMRs, DMRs, and DmCHs were annotated to the nearest genomic structure and gene using R package ChIPseeker and Bioconductor packages TxDb.Rnorvegicus.UCSC.rn6.refGene and org.Rn.eg.db [Citation55]. A ± 3,000 bp window surrounding the transcription start site was used termed the promoter region. Of note, differential hydroxymethylation and methylation positions/regions falling greater than 3,000 bp upstream of the transcription start site of the nearest gene or greater than 300 bp downstream of the nearest gene were deemed ‘Distal Intergenic’ and not associated to any gene.
Genomic annotations were confirmed using the R package MethylSeekR [Citation56] to identify partially methylated domains (PMDs), unmethylated regions (UMRs), and low-methylated regions (LMRs). Sequenced reads from biological replicates of DDI or FA80 groups were concatenated, aligned, deduplicated, and the methylation status was extracted, as described for differential analysis. Coverage files for DDI and FA80 groups were separately assessed by MethylSeekR. Using the distribution of alpha-values we found no evidence of PMDs for either group. UMRs and LMRs were independently found for each group using a false-discovery rate (FDR) P-value <0.05 and a methylation cut-off of 30%. These parameters identified UMRs (N = 16,454) and LMRs (N = 45,390) in the FA80 group and UMRs (N = 16,770) and LMRs (N = 44,984) in the DDI group. The output from MethylSeekR confirms our findings that the preponderance of DhMRs primarily reside in distal regulatory regions.
Library preparation and high-throughput sequencing of genomic DNA
Genomic DNA was extracted from spinal cord samples using Promega wizard genomic DNA purification kit (cat #A1120), following the manufacturer’s protocol. Genome-wide methylation data were generated by WuXi NextCode for each sample using whole-genome sequencing technologies from Illumina (HiSeq X). Briefly, genomic DNA (200 ng) was randomly fragmented, end-repaired, and ligated to NEBNext Methylated Adapter for Illumina following the manufacturer’s protocol (Illumina). Adapter-ligated DNA fragments, ranging from 200 to 400 base pairs (bp), were purified by Sample Purification Beads (Illumina) and then treated with sodium bisulphite (ZymoResearch EZ DNA methylation gold kit), which converts unmethylated cytosines to uracil, and leaves methylated cytosines unchanged. Libraries of converted DNA fragments were then amplified using KAPA HiFi Hot Start Uracil + Ready Mix (KAPA Biosystems KM2801), Index Primer for Illumina and Universal PCR Primer for Illumina (NEB E7336A), and amplicons were purified by Sample Purification Beads (Illumina) and sequenced on a Next-Generation sequencer (Illumina HiSeq X). This approach yielded 650–800 million 150 bp-reads for each library. Image processing and sequence extraction used the standard Illumina Pipeline.
Whole-genome bisulphite sequencing analysis
An average of 431.9 million paired-end reads were sequenced per sample. Raw FASTQ files of paired-end bisulphite sequenced reads were initially assessed for quality, and for evidence of bisulphite conversion using FastQC. Following quality control, paired-end mates were trimmed for adapter sequences, trimmed of the last nucleotide on the 3ʹ end of the reads, quality-filtered using a quality score of 30, and filtered out of analysis if either of the paired-end mates were shorter than 20 bp following trimming. An average of 424.5 million reads were used for downstream analysis. Paired-end mates were reassessed for quality following trimming, again using FastQC. Reads were aligned to the Rattus norvegicus (rn6) genome by employing Bismark v0.20.0 [Citation57], that used Bowtie2 v2.3.4.3 [Citation52] with a maximum insert length of 1000 base pairs for paired-end reads. An average of 320 million reads (~75%) were aligned per sample. To account for the potential of PCR bias, aligned reads were subjected to a deduplication process employed by Bismark. An average of ~78% of aligned reads remained following deduplication. Because Bismark reports methylation levels from CpGs from the top and bottom strand, CpGs were collapsed to report methylation calls for only one of these CpGs. Finally, methylation call and coverage values were accomplished through Bismark.
Differential methylation analysis
CpGs for each sample were discarded if the coverage did not exceed at least 2x, leaving an average of 22.7 million CpGs per sample for further analysis. R package DSS [Citation28] was used for differential methylation analysis, which models sequenced-read counts as a beta-binomial distribution to estimate variation of biological replicates, estimates dispersion based on a Bayesian hierarchical model, and determines differential methylation based on Wald testing at each genomic locus. Notably, DSS does not report FDR adjusted P-values for differentially methylated regions. Thus, CpGs were smoothed over a span of 500 bp and differentially methylated regions (DMRs) were called using the following parameters: a genomic region that contained at least five differentially methylated loci with a P-value <0.00001; >75% of CpGs in the region were differentially methylated; and a mean difference in methylation >10% between groups. This criteria identified 1,636 DMRs. Different parameters were placed for differential methylation at non-CpG sites (i.e., mCH sites, where H = A, C, or T). mCH loci were discarded from further analysis if their coverage did not exceed 30x, leaving an average of 24.2 million sites per sample for downstream analyses. Differentially methylated CpH sites (DmCHs) were identified using R package DSS with the following parameters: no smoothing of sites, Benjamini-Hochberg false discovery rate (FDR) adjusted P-value <0.05, differential methylation between groups was >10%. This approach identified 624 DmCHs.
Transcription factor Motif discovery and enhancer overlap analysis
Motif enrichment analysis was performed using the HOMER motif analysis algorithm [Citation58]. Genomic coordinates associated with DhMRs, DMRs, and DmCHs were used for analysis. Background sequences were extracted from the preparsed rn6 unmasked genome by HOMER. Motif discovery was performed over a window of 200 bp. Top known motifs/transcription factors were extracted from HOMER for each analysis.
To determine whether the differentially hydroxymethylated and methylated regions correlate with neuronal enhancer regions, a list of known enhancer regions (N = 23,452) derived from mouse brain tissue was acquired from the EnhancerAtlas [Citation59]. The genomic coordinates from all differentially hydroxymethylated and methylated regions were compared to enhancer coordinates to identify overlapping regions using R package GenomicRanges [Citation60].
Gene ontology analysis
Genes exhibiting differential hydroxymethylation and methylation at CpG or CpH sites were subjected to gene ontological analysis through the use of R package clusterProfiler [Citation61] to identify significant disruptions in biological processes, and to map enrichment terms. Genes subjected to differential analysis from each analysis was used as the background gene universe. Gene ontological terms were deemed significant if the Benjamini-Hochberg FDR adjusted P-value was <0.05.
Supplemental Material
Download Zip (14 KB)Acknowledgments
The authors would like to thank the UW biotechnology centre. This work was supported in part by the University of Wisconsin-Madison department of Neurological Surgery (RSA, BJI), the University of Wisconsin Fall Competition Award (BJI), March of Dimes Gene Discovery and Translational Research Grant #6-FY14-435 (BJI), NICHD 1R01HD047516 (BJI), NIH 3R01HD047516-04S1 ARRA Supplement (BJI), NARSAD Young Investigator Grant from the Brain & Behavioral Research Foundation #22669 (LP), and a Ruth L. Kirschstein National Research Service Award (MH113351-02) (AM). The authors declare no competing financial interests.
Disclosure statement
No potential conflict of interest was reported by the authors.
Supplementary material
Supplemental data for this article can be accessed here.
Additional information
Funding
References
- Huebner EA, Strittmatter SM. Axon regeneration in the peripheral and central nervous systems. Results Probl Cell Differ. 2009;48:339–351.
- Fagerholm ED, Hellyer PJ, Scott G, et al. Disconnection of network hubs and cognitive impairment after traumatic brain injury. Brain. 2015;138:1696–1709.
- Hinman JD. The back and forth of axonal injury and repair after stroke. Curr Opin Neurol. 2014;27:615–623.
- Arthur-Farraj PJ, Latouche M, Wilton D, et al. c-Jun reprograms Schwann cells of injured nerves to generate a repair cell essential for regeneration. Neuron. 2012;75:633–647.
- He Z, Jin Y. Intrinsic control of axon regeneration. Neuron. 2016;90:437–451.
- Neumann S, Skinner K, Basbaum AI. Sustaining intrinsic growth capacity of adult neurons promotes spinal cord regeneration. Proc Natl Acad Sci USA. 2005;102:16848–16852.
- Varley KE, Gertz J, Bowling KM, et al. Dynamic DNA methylation across diverse human cell lines and tissues. Genome Res. 2013;23:555–567.
- Day JJ, Childs D, Guzman-Karlsson MC, et al. DNA methylation regulates associative reward learning. Nat Neurosci. 2013;16:1445–1452.
- Day JJ, Sweatt JD. DNA methylation and memory formation. Nat Neurosci. 2010;13:1319–1323.
- Hashimshony T, Zhang J, Keshet I, et al. The role of DNA methylation in setting up chromatin structure during development. Nat Genet. 2003;34:187–192.
- Johnson AA, Akman K, Calimport SRG, et al. The role of DNA methylation in aging, rejuvenation, and age-related disease. Rejuvenation Res. 2012;15:483–494.
- Lewis J, Bird A. DNA methylation and chromatin structure. FEBS Lett. 1991;285:155–159.
- Li E, Beard C, Jaenisch R. Role for DNA methylation in genomic imprinting. Nature. 1993;366:362–365.
- Sanchez-Mut JV, Heyn H, Vidal E, et al. Human DNA methylomes of neurodegenerative diseases show common epigenomic patterns. Transl Psychiatry. 2016;6:e718.
- Sharp AJ, Stathaki E, Migliavacca E, et al. DNA methylation profiles of human active and inactive X chromosomes. Genome Res. 2011;21:1592–1600.
- Ziller MJ, Müller F, Liao J, et al. Genomic distribution and inter-sample variation of non-CpG methylation across human cell types. PLoS Genet. 2011;7:e1002389.
- Crider KS, Yang TP, Berry RJ, et al. Folate and DNA methylation: a review of molecular mechanisms and the evidence for folate’s role. Adv Nutr. 2012;3:21–38.
- Patel NJ, Hogan KJ, Rizk E, et al. Ancestral folate promotes neuronal regeneration in serial generations of progeny. Mol Neurobiol. 2020;57(4):2048–2071.
- Burggren WW. Dynamics of epigenetic phenomena: intergenerational and intragenerational phenotype ‘washout’. J Exp Biol. 2015;218:80–87.
- Mellen M, Ayata P, Heintz N. 5-hydroxymethylcytosine accumulation in postmitotic neurons results in functional demethylation of expressed genes. Proc Natl Acad Sci USA. 2017;114:E7812–e7821.
- Al-Mahdawi S, Virmouni SA, Pook MA. The emerging role of 5-hydroxymethylcytosine in neurodegenerative diseases. Front Neurosci. 2014;8:397.
- Chen L, Chen K, Lavery LA, et al. MeCP2 binds to non-CG methylated DNA as neurons mature, influencing transcription and the timing of onset for Rett syndrome. Proc Natl Acad Sci USA. 2015;112:5509–5514.
- Li S, Papale LA, Zhang Q, et al. Genome-wide alterations in hippocampal 5-hydroxymethylcytosine links plasticity genes to acute stress. Neurobiol Dis. 2016;86:99–108.
- Papale LA, Zhang Q, Li S, et al. Genome-wide disruption of 5-hydroxymethylcytosine in a mouse model of autism. Hum Mol Genet. 2015;24:7121–7131.
- Song CX, Szulwach KE, Fu Y, et al. Selective chemical labeling reveals the genome-wide distribution of 5-hydroxymethylcytosine. Nat Biotechnol. 2011;29:68–72.
- Szulwach KE, Li X, Li Y, et al. 5-hmC-mediated epigenetic dynamics during postnatal neurodevelopment and aging. Nat Neurosci. 2011;14:1607–1616.
- Zhao M, Rotgans B, Wang T, et al. REGene: a literature-based knowledgebase of animal regeneration that bridge tissue regeneration and cancer. Sci Rep. 2016;6:23167.
- Feng H, Conneely KN, Wu H. A bayesian hierarchical model to detect differentially methylated loci from single nucleotide resolution sequencing data. Nucleic Acids Res. 2014;42:e69.
- Weng YL, An R, Cassin J, et al. An intrinsic epigenetic barrier for functional axon regeneration. Neuron. 2017;94:337–346 e336.
- Sekine Y, Lin-Moore A, Chenette DM, et al. Functional genome-wide screen identifies pathways restricting central nervous system axonal regeneration. Cell Rep. 2018;24:269.
- Guo JU, Su Y, Shin JH, et al. Distribution, recognition and regulation of non-CpG methylation in the adult mammalian brain. Nat Neurosci. 2014;17:215–222.
- Loh YE, Koemeter-Cox A, Finelli MJ, et al. Comprehensive mapping of 5-hydroxymethylcytosine epigenetic dynamics in axon regeneration. Epigenetics. 2017;12:77–92.
- Visel A, Minovitsky S, Dubchak I, et al. VISTA enhancer browser–a database of tissue-specific human enhancers. Nucleic Acids Res. 2007;35:D88–92.
- Sanyal A, Lajoie BR, Jain G, et al. The long-range interaction landscape of gene promoters. Nature. 2012;489:109–113.
- Ajima R, Suzuki E, Saga Y. Pofut1 point-mutations that disrupt O-fucosyltransferase activity destabilize the protein and abolish Notch1 signaling during mouse somitogenesis. PloS One. 2017;12:e0187248.
- El Bejjani R, Hammarlund M. Notch signaling inhibits axon regeneration. Neuron. 2012;73:268–278.
- Yang Y, Ogawa Y, Hedstrom KL, et al. betaIV spectrin is recruited to axon initial segments and nodes of Ranvier by ankyrinG. J Cell Biol. 2007;176:509–519.
- Farley JE, Burdett TC, Barria R, et al. Transcription factor Pebbled/RREB1 regulates injury-induced axon degeneration. Proc Natl Acad Sci USA. 2018;115:1358–1363.
- Castranio EL, Mounier A, Wolfe CM, et al. Gene co-expression networks identify Trem2 and Tyrobp as major hubs in human APOE expressing mice following traumatic brain injury. Neurobiol Dis. 2017;105:1–14.
- Sen A, Gurdziel K, Liu J, et al. Smooth, an hnRNP-L homolog, might decrease mitochondrial metabolism by post-transcriptional regulation of Isocitrate Dehydrogenase (Idh) and other metabolic genes in the sub-acute phase of traumatic brain injury. Front Genet. 2017;8:175.
- Knox SM, Lombaert IMA, Haddox CL, et al. Parasympathetic stimulation improves epithelial organ regeneration. Nat Commun. 2013;4:1494.
- Medrihan L, Cesca F, Raimondi A, et al. Synapsin II desynchronizes neurotransmitter release at inhibitory synapses by interacting with presynaptic calcium channels. Nat Commun. 2013;4:1512.
- d’Aldin CG, Ruel J, Assie R, et al. Implication of NMDA type glutamate receptors in neural regeneration and neoformation of synapses after excitotoxic injury in the guinea pig cochlea. Int J Dev Neurosci. 1997;15:619–629.
- Ramisch A, Heinrich V, Glaser LV, et al. CRUP: a comprehensive framework to predict condition-specific regulatory units. Genome Biol. 2019;20:227.
- Pembrey ME, Bygren LO, Kaati G, et al. Sex-specific, male-line transgenerational responses in humans. Eur J Hum Genet. 2006;14:159–166.
- Iskandar BJ, Rizk E, Meier B, et al. Folate regulation of axonal regeneration in the rodent central nervous system through DNA methylation. J Clin Invest. 2010;120:1603–1616.
- Nakanishi M, Nomura J, Ji X, et al. Functional significance of rare neuroligin 1 variants found in autism. PLoS Genet. 2017;13:e1006940.
- Amir RE, Van den Veyver IB, Wan M, et al. Rett syndrome is caused by mutations in X-linked MECP2, encoding methyl-CpG-binding protein 2. Nat Genet. 1999;23:185–188.
- Demontis D, Nyegaard M, Buttenschøn HN, et al. Association of GRIN1 and GRIN2A-D with schizophrenia and genetic interaction with maternal herpes simplex virus-2 infection affecting disease risk. Am J Med Genet. 2011;156b:913–922.
- Kukreti R, Tripathi S, Bhatnagar P, et al. Association of DRD2 gene variant with schizophrenia. Neurosci Lett. 2006;392:68–71.
- Degano AL, Pasterkamp RJ, Ronnett GV. MeCP2 deficiency disrupts axonal guidance, fasciculation, and targeting by altering Semaphorin 3F function. Mol Cell Neurosci. 2009;42:243–254.
- Langmead B, Salzberg SL. Fast gapped-read alignment with Bowtie 2. Nat Methods. 2012;9:357–359.
- Zhang Y, Liu T, Meyer CA, et al. Model-based analysis of ChIP-Seq (MACS). Genome Biol. 2008;9:R137.
- Robinson MD, McCarthy DJ, Smyth GK. edgeR: a Bioconductor package for differential expression analysis of digital gene expression data. Bioinformatics. 2010;26:139–140.
- Yu G, Wang LG, He QY. ChIPseeker: an R/Bioconductor package for ChIP peak annotation, comparison and visualization. Bioinformatics. 2015;31:2382–2383.
- Burger L, Gaidatzis D, Schubeler D, et al. Identification of active regulatory regions from DNA methylation data. Nucleic Acids Res. 2013;41:e155.
- Krueger F, Andrews SR. Bismark: a flexible aligner and methylation caller for Bisulfite-Seq applications. Bioinformatics. 2011;27:1571–1572.
- Heinz S, Benner C, Spann N, et al. Simple combinations of lineage-determining transcription factors prime cis-regulatory elements required for macrophage and B cell identities. Mol Cell. 2010;38:576–589.
- Gao T, He B, Liu S, et al. EnhancerAtlas: a resource for enhancer annotation and analysis in 105 human cell/tissue types. Bioinformatics. 2016;32:3543–3551.
- Lawrence M, Huber W, Pagès H, et al. Software for computing and annotating genomic ranges. PLoS Comput Biol. 2013;9:e1003118.
- Yu G, Wang LG, Han Y, et al. clusterProfiler: an R package for comparing biological themes among gene clusters. OMICS. 2012;16:284–287.