
ABSTRACT
Fusaric acid (FA) is a food-borne mycotoxin that mediates toxicity with limited information on its epigenetic properties. p53 is a tumour suppressor protein that regulates cell cycle arrest and apoptotic cell death. The expression of p53 is regulated transcriptionally by promoter methylation and post-transcriptionally by N-6-methyladenosine (m6A) RNA methylation. We investigated the effect of FA on p53 expression and its epigenetic regulation via promoter methylation and m6A RNA methylation in human hepatocellular carcinoma (HepG2) cells. HepG2 cells were treated with FA [0, 25, 50, 104, and 150 µg/ml; 24 h] and thereafter, DNA, RNA, and protein was isolated. Promoter methylation and expression of p53 was measured using qPCR and Western blot. RNA immuno-precipitation was used to determine m6A-p53 levels. The expression of m6A methyltransferases (METTL3 and METTL14), demethylases (FTO and ALKBH5), and readers (YTHDF1-3 and YTHDC2) were measured using qPCR. FA induced p53 promoter hypermethylation (p < 0.0001) and decreased p53 expression (p < 0.0001). FA decreased m6A-p53 levels (p < 0.0001) by decreasing METTL3 (p < 0.0001) and METTL14 (p < 0.0001); and suppressed expression of YTHDF1 (p < 0.0001), YTHDF3 (p < 0.0001), and YTHDC2 (p < 0.0001) that ultimately reduced p53 translation (p < 0.0001). Taken together, the data shows that FA epigenetically decreased p53 expression by altering its promoter methylation and m6A RNA methylation in HepG2 cells. This study reveals a mechanism for p53 regulation by FA and provides insight into future therapeutic interventions.
Introduction
Fusaric acid (FA; 5-butylpicolinic acid) is a mycotoxin produced by the Fusarium species that parasitize agricultural foods and feeds and impacts on human and animal health. To date, little is known on the toxic and epigenetic effects of FA in humans and animals and the elucidation of cellular epigenetic mechanisms can lead to a better understanding of FA toxicity as well as assist in the development of preventative and therapeutic measures against FA toxicity. This is beneficial in underprivileged communities where the food supply and storage conditions are inadequate. Currently, the only epigenetic study on FA showed induction of DNA hypomethylation that led to genotoxicity and cytotoxicity in an in vitro model [Citation1].
FA has diverse toxicological effects in plants [Citation2–5] and animals [Citation6–9]; it exhibits phytotoxicity by causing necrosis and wilt disease symptoms in various plants [Citation5]. FA is also toxic to human and animal cells by inducing oxidative stress [Citation10], mitochondrial dysfunction [Citation11], DNA damage [Citation12,Citation13], and apoptotic cell death [Citation10–12,Citation14,Citation15]. It has neurochemical effects in mice [Citation16], rats [Citation17], and pigs [Citation18,Citation19]; and reduced aggressive behaviour and motor activity [Citation16]. Additionally, the toxicity of FA was associated with alterations in platelet function [Citation20], delayed bone ossification [Citation21], hypotension [Citation7,Citation22], and notochord malformation [Citation8]. Synergism between FA and other Fusarium-produced mycotoxins such as deoxynivalenol (DON) [Citation23], fumonisin B1 (FB1) [Citation24], and 4,15-diacetoxyscirpenol (DAS) [Citation25] have also been demonstrated.
The tumour suppressor protein, p53 is a transcription factor that is activated in response to cellular stress [Citation26]. The most common p53 activating stressors include oxidative stress, DNA damage, excessive oncogene activation, and hypoxia [Citation26,Citation27]. Once activated, p53 recruits core transcriptional machinery to its target promoters, enabling the transcription of genes, with cellular outcomes such as cell cycle arrest and apoptosis [Citation28,Citation29]. Dysregulation in p53 expression has been associated with several human diseases including neurodegenerative diseases [Citation30,Citation31] and cancer [Citation32].
Although previous studies have indicated that p53 is regulated at the post-translational level by ubiquitination, phosphorylation, and acetylation [Citation33–35], the expression of p53 is also regulated epigenetically at the transcriptional and post-transcriptional levels by promoter methylation and N-6-methyladenosine (m6A) RNA methylation.
Promoter methylation, methylation of CpG islands within the promoter regions of specific genes, is crucial in regulating gene transcription. The p53 promoter region was sequenced and basal promoter activity was localized to an 85bp region (nucleotides 760–844) that is indispensable for its full promoter activity [Citation36], and the p53 promoter has putative binding sites for transcription factors. Alterations in p53 promoter methylation have been linked with an array of p53 mutations, loss in tumour suppressor function, and cancer progression [Citation32]. Previously, it was shown that promoter hypermethylation of p53 prevents binding of transcription factors and is associated with a reduction in p53 expression, whereas promoter hypomethylation increases p53 expression [Citation37,Citation38].
Post-transcriptional regulation of messenger RNA (mRNA) expression involves RNA-protein and RNA-RNA interactions [Citation39]. M6A RNA methylation occurs in approximately 0.2–0.5% of adenines and is the most abundant post-transcriptional modification of mammalian mRNA [Citation40,Citation41]. M6A is commonly found in the coding region and 3ʹ untranslated region (3ʹUTR) of mRNA and is involved in regulating cellular processes including mRNA translation [Citation42,Citation43], degradation [Citation44], splicing [Citation45], and cellular localization [Citation46]. Dysregulation in the m6A methylation pattern has been associated with developmental abnormalities [Citation46–48], obesity [Citation49,Citation50], type 2 diabetes [Citation51], cancer [Citation52–54], and other human diseases [Citation55].
M6A is catalyzed by the methyltransferase complex which consists of methyltransferase-like 3 (METTL3), methyltransferase-like 14 (METTL14), and Wilm’s tumour 1-associated protein (WTAP) [Citation56,Citation57]. METTL3 is catalytically active and regulates m6A levels by binding to s-adenosyl methionine and catalyzing the transfer of a methyl group to the N-6 position of specific adenines on the target mRNA, METTL14 functions to maintain structure and substrate recognition by interacting with and stabilizing METTL3, whereas WTAP is catalytically inactive and facilitates RNA binding and m6A deposition by coordinating nuclear localization of the METTL3-METTL14 complex [Citation57]. The m6A demethylases, fat mass and obesity-associated protein (FTO) and ALKB homolog 5 (ALKBH5), are Fe2+ and alpha-ketoglutarate-dependent and function by oxidizing N-methyl groups of m6A to a hydroxymethyl group [Citation39,Citation58].
Chemical modifications of RNA transcripts alter the charge, base-pairing, secondary structure, and RNA-protein interactions, thereby, regulating gene expression by modulating RNA processing, localization, translation, and decay [Citation42,Citation44–46]. Similarly, m6A also affects RNA processing by recruiting specific reader proteins. The m6A readers such as the YT521-B homology domain containing proteins 1 and 2 (YTHDC1 and YTHDC2) and the YT521-B homology domain family proteins 1, 2, and 3 (YTHDF1, YTHDF2, and YTHDF3) specifically recognize m6A modified RNAs and regulate the expression and function of specific mRNAs and proteins. YTHDF1, YTHDF3, and YTHDC2 regulate mRNA translation [Citation42,Citation43], YTHDF2 regulates mRNA degradation [Citation44], and YTHDC1 regulates mRNA splicing and cellular localization [Citation45,Citation46].
Previously, we determined that FA (104 µg/ml) post-translationally activates p53 in response to DNA damage in human hepatocellular carcinoma (HepG2) cells [Citation12]; however, the mechanism underlying the effect of FA on p53 expression and its epigenetic regulation is not well understood. This study aimed to determine the effect of FA on p53 expression and its epigenetic regulation at the transcriptional and post-transcriptional levels by promoter methylation and m6A RNA methylation in HepG2 cells. Results from this study provide insight into a possible mechanism of FA mediated regulation of p53 at the epigenetic level that may serve as an alternative mechanism for FA toxicity.
Results
Fusaric acid decreased p53 expression in HepG2 cells
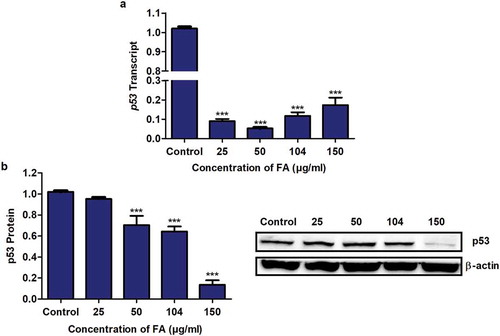
The tumour suppressor protein, p53 is activated during cellular stress and functions in cell cycle control and apoptosis [Citation27]. Previously, it was shown that FA activates p53 via phosphorylation and acetylation in HepG2 cells [Citation12]; however, its effect on p53 mRNA and protein expression is not well understood. We determined the effect of FA on p53 mRNA and protein expression in HepG2 cells using qPCR and Western blot, respectively. FA significantly decreased p53 mRNA (p < 0.0001; ) and protein (p < 0.0001; ) expression in HepG2 cells compared to the control.
Figure 1. The effect of FA on p53 expression in HepG2 cells. (a) RNA isolated from control and FA-treated HepG2 cells were reverse transcribed into cDNA and analyzed for p53 expression using qPCR. FA decreased the mRNA expression of p53 in HepG2 cells. (b) Protein expression of p53 was determined using Western blot. FA decreased the protein expression of p53 in HepG2 cells. Results are represented as mean fold-change ± SD (n = 3). Statistical significance was determined by one-way ANOVA with the Bonferroni multiple comparisons test (***p < 0.0001)
Fusaric acid altered p53 promoter methylation in HepG2 cells
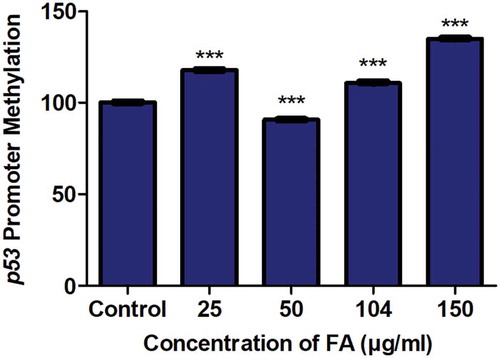
The promoter methylation of genes is essential in regulating transcriptional activity and gene expression. Previously, p53 promoter hypomethylation was shown to increase p53 expression [Citation59,Citation60], whereas p53 promoter hypermethylation was shown to decrease p53 expression [Citation37,Citation38]. We determined if the decrease in p53 mRNA expression observed in the FA-treated HepG2 cells was a result of alterations in p53 promoter methylation. FA significantly increased p53 promoter methylation in the 25, 104, and 150 µg/ml FA treatments; however, the promoter methylation of p53 was significantly decreased by the 50 µg/ml FA in HepG2 cells (p < 0.0001; ).
Figure 2. The effect of FA on the promoter methylation of p53 in HepG2 cells. DNA isolated from control and FA-treated HepG2 cells were assayed for p53 promoter methylation using the OneStep qMethyl Kit. FA altered p53 promoter methylation in HepG2 cells. Results are represented as mean fold-change ± SD (n = 3). Statistical significance was determined by one-way ANOVA with the Bonferroni multiple comparisons test (***p < 0.0001)
Fusaric acid decreased m6A-p53 levels in HepG2 cells
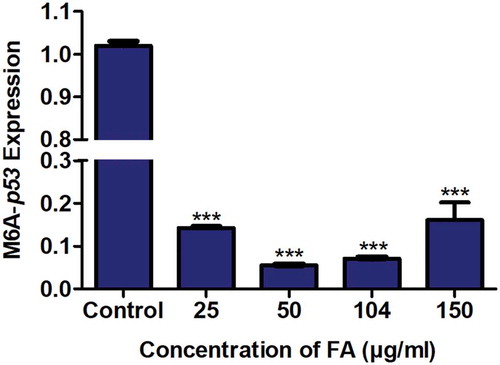
M6A, an abundant and dynamic post-transcriptional modification of mRNA, regulates mRNA degradation and translation [Citation42–44]. Due to the FA-induced decrease in p53 expression at both the transcript and protein levels, we determined the effect of FA on m6A-p53 levels in HepG2 cells using RNA immuno-precipitation. FA significantly decreased m6A-p53 expression in HepG2 cells (p < 0.0001; ) compared to the control.
Figure 3. The effect of FA on m6A-p53 levels in HepG2 cells. RNA immuno-precipitation using m6A antibody and quantification of p53 mRNA levels in control and FA-treated HepG2 cells. FA decreased m6A-p53 levels in HepG2 cells. Results are represented as mean fold-change ± SD (n = 3). Statistical significance was determined by one-way ANOVA with the Bonferroni multiple comparisons test (***p < 0.0001)
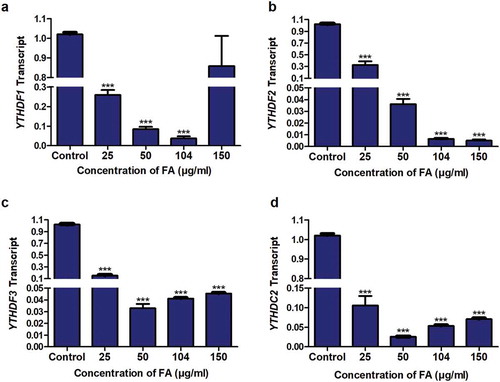
Fusaric acid decreased the expression of m6A methyltransferases and demethylases in HepG2 cells
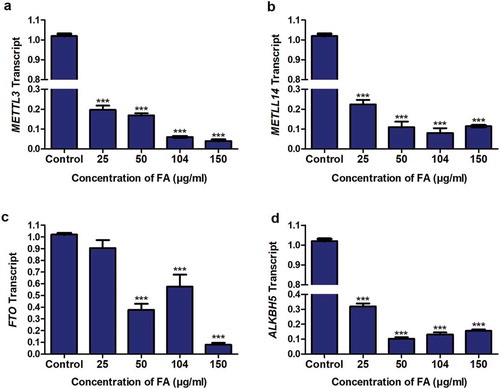
The m6A methyltransferases, METTL3 and METTL14, and demethylases, FTO and ALKBH5, regulate m6A levels of RNA transcripts. Due to the FA-induced decrease in m6A-p53 levels observed in the FA-treated HepG2 cells, we determined the effect of FA on the mRNA expression of METTL3, METTL14, FTO, and ALKBH5. FA significantly decreased the expression of METTL3 (p < 0.0001; ), METTL14 (p < 0.0001; ), FTO (p < 0.0001; ), and ALKBH5 (p < 0.0001; ) in HepG2 cells compared to the control. This suggests that FA may decrease m6A-p53 levels by modulating the expression of the m6A methyltransferases in HepG2 cells.
Figure 4. The effect of FA on the expression of m6A methyltransferases and demethylases in HepG2 cells. RNA isolated from control and FA-treated HepG2 cells were reverse transcribed into cDNA and analyzed for METTL3, METTL14, FTO, and ALKBH5 expression using qPCR. FA decreased the mRNA expression of METTL3 (a), METTL14 (b), FTO (c), and ALKBH5 (d) in HepG2 cells. Results are represented as mean fold-change ± SD (n = 3). Statistical significance was determined by one-way ANOVA with the Bonferroni multiple comparisons test (***p < 0.0001)
Fusaric acid decreased the expression of m6A readers in HepG2 cells
M6A plays a major role in RNA processing by recruiting specific readers which recognize m6A modified mRNAs and regulate the expression of the target mRNA and protein [Citation55]. The m6A readers, YTHDF1, YTHDF3, and YTHDC2 have been shown to regulate mRNA translation/protein expression [Citation42], whereas YTHDF2 was shown to regulate mRNA expression [Citation44]. Due to the decrease in p53 mRNA and protein expression observed in the FA-treated HepG2 cells as well as the FA-induced decrease in m6A-p53 levels, we determined the effect of FA on the mRNA expression of YTHDF1, YTHDF2, YTHDF3, and YTHDC2. FA significantly decreased the expression of YTHDF1 (p < 0.0001; ), YTHDF2 (p < 0.0001; ), YTHDF3 (p < 0.0001; ), and YTHDC2 (p < 0.0001; ) in HepG2 cells compared to the control.
Figure 5. The effect of FA on the expression of m6A readers in HepG2 cells. RNA isolated from control and FA-treated HepG2 cells were reverse transcribed into cDNA and analyzed for the expression of YTHDF1, YTHDF2, YTHDF3, and YTHDC2 by qPCR. FA decreased the expression of YTHDF1 (a), YTHDF2 (b), YTHDF3 (c), and YTHDC2 (d) in HepG2 cells. Results are represented as mean fold-change ± SD (n = 3). Statistical significance was determined by one-way ANOVA with the Bonferroni multiple comparisons test (***p < 0.0001)
Discussion
Exposure to mycotoxins causes adverse effects in humans and animals. FA is a common food-borne mycotoxin and chelator of divalent cations that alters cellular pathways in plants and animals [Citation3,Citation5,Citation7,Citation8,Citation61]; however, its epigenetic mechanisms of toxicity are unclear. Recently, FA was shown to induce global DNA hypomethylation as an epigenetic mechanism of genotoxicity and cytotoxicity in liver cells [Citation1]. Similarly, FB1 (a common mycotoxin found in corn) caused chromatin instability and liver tumourigenesis by inducing global DNA hypomethylation and histone demethylation [Citation62]. Zearalenone (a myco-oestrogen) also reduced cell viability and caused apoptotic cell death by inducing global DNA hypomethylation [Citation63] and histone demethylation [Citation64]. Despite several studies indicating the genotoxic and cytotoxic effects of mycotoxins, no studies have been conducted on mycotoxins and its effect on the epigenetic regulation of p53 expression at the transcriptional and post-transcriptional level.
Previously, FA was shown to inhibit cell proliferation and induce apoptosis in HepG2 cells by post-translational modifications of p53 [Citation12]; however, the effect of FA on p53 expression and its epigenetic regulation is not well understood. In addition to post-translational regulation of p53 protein stability and activity, the expression of p53 is also regulated at the transcriptional and post-transcriptional level by promoter methylation and m6A RNA methylation. In this study, we provide evidence for an epigenetic mechanism of FA-induced changes in p53 expression at both the transcript and protein levels by altering p53 promoter methylation and m6A RNA methylation in HepG2 cells.
Our results indicate that FA significantly decreased p53 mRNA () and protein () expression by inducing p53 promoter hypermethylation () and decreasing m6A-p53 expression levels () in HepG2 cells. This is in agreement with previous studies in which p53 promoter hypermethylation was associated with a decrease in p53 transcript levels [Citation37,Citation38] and p53 promoter hypomethylation was associated with an increase in p53 expression levels [Citation59,Citation60]. The data is also consistent with our previous findings in which FA decreased p53 protein expression in HepG2 cells [Citation12]. Although it is clear that FA decreased p53 expression at the mRNA and protein levels, the decrease in p53 protein expression was dose-dependent, whereas the mRNA expression displayed a stepwise increase (albeit still lower than the control) at 104 and 150 µg/ml FA. This implied possible regulation by a post-transcriptional modification and may be the result of the FA-induced decrease in m6A levels on p53 RNA transcripts.
As an epitranscriptomic marker, m6A is the most abundant post-transcriptional modification of mRNA that promotes translation efficiency and mRNA degradation by recruiting specific m6A-dependent readers [Citation43,Citation65,Citation66]. Previously, aberrant regulation of m6A RNA transcripts were shown to affect many biological processes including circadian rhythm and lipid metabolism [Citation67], adipogenesis [Citation49], cell differentiation [Citation41], and embryonic stem cell renewal [Citation47]. Additionally, modulation of m6A RNAs were associated with various cancers such as acute myeloid leukaemia [Citation68,Citation69], breast cancer [Citation70], liver cancer [Citation71], and lung cancer [Citation66].
Dietary factors have also been shown to affect RNA m6A levels [Citation72,Citation73], and studies on p53 and m6A have indicated that m6A located within the coding region (codon 273) of p53 pre-mRNA leads to the translation of mutant (R273H) p53 that alters the p53 signalling pathway and contributes to tumour formation and progression [Citation74]. Similarly, mutations in m6A regulatory genes were correlated with a reduction in wild-type p53 expression and the presence of p53 mutations in patients with acute myeloid leukaemia [Citation69]. A decrease in m6A levels was also associated with cytotoxicity via activation of p53 and apoptosis in arsenite-transformed human keratinocytes [Citation75].
In our study, we found that FA decreased m6A-p53 levels in HepG2 cells (). This occurred despite the significant decrease in both m6A methyltransferases (METTL3 () and METTL14 ()) and demethylases (FTO () and ALKBH5 ()) in the FA-treated HepG2 cells. The FA-induced decrease in FTO and ALKBH5 suggests that it may not necessarily be responsible for the decrease in m6A-p53 levels in the HepG2 cells, and that the decrease in m6A-p53 levels is rather a consequence of the FA-induced decrease in METTL3 and METTL14. This is in agreement with previous studies in which knockdown of METTL3 and/or METTL14 was associated with a substantial decrease in m6A mRNA levels [Citation57], whereas overexpression of METTL3 and/or METTL14 was associated with an increase in m6A mRNA levels [Citation67]. Additionally, knockdown of METTL3 and METTL14 was shown to downregulate the expression of several tumour suppressor genes including CDKN2A, BRCA2, and TP53I11 [Citation76], thereby, reducing cell proliferation, migration, and colony formation of cancer cells in vitro [Citation71]. The depletion of FTO and ALKBH5 was also found to reduce cell proliferation and invasiveness in vitro [Citation66,Citation77]. Interestingly, although FTO and ALKBH5 have been recognized as m6A demethylases, it was shown that FTO is highly co-expressed with the m6A methyltransferases in vitro, thereby, establishing a dynamic equilibrium between methylated and un-methylated RNA transcripts within the cells [Citation78], and this may account for the positive correlation observed between FTO and ALKBH5 and METTL3 and METTL14 expression in the FA-treated HepG2 cells. This simultaneous expression in both the m6A methyltransferases and demethylases has been observed in other studies [Citation79,Citation80]. However, further investigation is required to determine whether or not this simultaneous expression counteracts the effects of each other.
YTHDF1, YTHDF2, YTHDF3, and YTHDC2 specifically recognize m6A modified mRNAs and regulate mRNA degradation [Citation44] and translation [Citation42,Citation43]. In HepG2 cells, the FA-induced decrease in m6A-p53 levels led to a decrease in the expression of YTHDF1 (), YTHDF2 (), YTHDF3 (), and YTHDC2 (). YTHDF2 plays a major role in mRNA degradation; the carboxy-terminal domain of YTHDF2 selectively binds to m6A-containing mRNA, whereas the amino-terminal domain is responsible for the localization of the YTHDF2-mRNA complex to RNA decay sites such as processing bodies [Citation44]. The decrease in YTHDF2 expression, decrease in p53 mRNA expression, and increase in p53 promoter methylation observed in the FA-treated HepG2 cells suggests that FA may decrease p53 mRNA expression via promoter hypermethylation and inhibition in p53 transcription, and not YTHDF2-mediated degradation of p53 mRNA.
YTHDF1, YTHDF3, and YTHDC2 function by interacting with translational machinery and actively promote protein synthesis to ensure effective protein production from dynamic transcripts that are marked by m6A [Citation43]. Therefore, the FA-induced decrease in YTHDF1, YTHDF3, and YTHDC2, in addition to the FA-induced decrease in p53 transcription, may be responsible for the decrease in p53 protein expression observed in the HepG2 cells. Similar results were observed in a previous study where a decrease in YTHDF3 reduced the protein expression of FOXO3 without affecting the expression of FOXO3 mRNA [Citation81]. These results are also in agreement with the study by Wang et al (2015) in which ribosome profiling on METTL3 knockdown cells showed that YTHDF1 promotes translation efficiency in an m6A-dependent manner, and knockdown of YTHDF1 reduced ribosome occupancy and translation efficiency of m6A targeted transcripts [Citation43]. Similarly, YTHDF3 and YTHDC2 promote protein synthesis in synergy with YTHDF1 by interacting with ribosomal proteins and unwinding the 5ʹUTR of mRNA [Citation82–84].
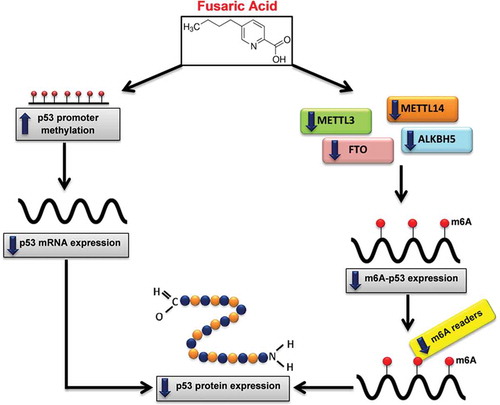
In conclusion, this study provides evidence for a possible mechanism of FA-induced changes in p53 expression at the epigenetic level. The results indicate that FA epigenetically decreases p53 expression at both the transcript and protein levels by increasing p53 promoter methylation and decreasing m6A-p53 methylation levels in HepG2 cells (). The results further indicate that the decrease in m6A-p53 expression levels was mediated by a decrease in the expression of METTL3 and METTL14, and may have occurred independently of FTO and ALKBH5. Together, these results may serve as an alternative mechanism of FA-induced toxicity in the liver and are beneficial in poverty stricken areas where there are high levels of FA contamination. This study provides insight for future studies on FA and p53 in an in vivo model as well as assessing the ability of FA to induce p53 mutant proteins by altering m6A levels.
Figure 6. Proposed mechanism of FA-induced decrease in p53 expression. FA decreases p53 expression at both the transcript and protein levels by inducing p53 promoter hypermethylation and decreasing m6A-p53 methylation levels. FA decreased m6A-p53 levels by decreasing METTL3 and METTL14; and suppressed expression of the m6A readers, YTHDF1, YTHDF3, and YTHDC2, which led to the decrease in p53 translation/protein expression. Furthermore, the decrease in p53 protein expression may be a consequence of the FA-induced decrease in p53 mRNA expression
Materials and methods
Materials
FA (Gibberella fujikuroi, F6513) was purchased from Sigma-Aldrich. The HepG2 cell line (HB-8065) was purchased from the American Type Culture Collection (ATCC). Cell culture reagents were purchased from Lonza Biotechnology. Western blot reagents were purchased from Bio-Rad. All other reagents were purchased from Merck.
Cell culture and treatment
HepG2 cells (1.5 X 10⁶, passage 3) were cultured (37°C, 5% CO2) to 90% confluency in 25 cm3 cell culture flasks containing complete culture media (CCM; Eagle’s Minimum Essentials Medium (EMEM) supplemented with 10% foetal calf serum, 1% penicillin-streptomycin fungizone, and 1% L-glutamine). A stock solution of FA (1 mg/ml) in 0.1 M phosphate buffered saline (PBS) was prepared and the cells were incubated (37°C, 5% CO2, 24 h) with a range of FA concentrations (25, 50, 104, and 150 µg/ml) [Citation1]. An untreated control (CCM only) was also prepared. The viability of the cells was assessed using the trypan blue cell exclusion method. All results were verified by performing two independent experiments in triplicate.
RNA isolation and quantitative polymerase chain reaction (qPCR)
Total RNA was extracted from control and FA-treated HepG2 cells using Qiazol Reagent (Qiagen, 79,306), as previously described [Citation1]. The RNA was quantified using the Nanodrop2000 spectrophotometer (Thermo-Fisher Scientific), standardized to 1,000 ng/µl, and reverse transcribed into complementary DNA (cDNA) using the Maxima H Minus First Strand cDNA Synthesis Kit (Thermo-Fisher Scientific, K1652). Thereafter, the mRNA expression of p53, METTL3, METTL14, FTO, ALKBH5, YTHDF1, YTHDF2, YTHDF3, and YTHDC2 was determined using the PowerUp™ SYBR™ Green Master Mix (Thermo-Fisher Scientific, A25742) and the CFX96 Real Time PCR System (Bio-Rad) with the following cycling conditions: initial denaturation (95°C, 8 min), followed by 40 cycles of denaturation (95°C, 15 s), annealing (Supplementary Table S1, 40 s), and extension (72°C, 30 s). Primer sequences and annealing temperatures are listed in Supplementary Table S1. GAPDH was used as the internal control to normalize mRNA expression. The comparative threshold cycle (Ct) method was used to determine relative changes in expression [Citation85].
Protein isolation and Western blot
The protein expression of p53 was determined using Western blot. Briefly, crude protein was isolated from control and FA-treated HepG2 cells using cytobuster reagent (200 µl; Novagen, 71,009) supplemented with protease and phosphatase inhibitors (Roche; 05892791001 and 04906837001, respectively). The bicinchoninic acid (BCA) assay was used to quantify the proteins and the samples were subsequently standardized to 1 mg/ml. The samples were then boiled (100°C, 5 min) in a 1:1 dilution with 1X Laemmli buffer [dH2O, 0.5 M Tris-HCl (pH 6.8), glycerol, 10% SDS, 5% β-mercaptoethanol, 1% bromophenol blue], separated in sodium dodecyl sulphate polyacrylamide gels (10% resolving gel, 4% stacking gel; 1 h, 150 V), and transferred onto nitrocellulose membranes using the Bio-Rad Trans-Blot® Turbo Transfer System (20 V, 30 min). The membranes were then blocked in 5% non-fat dry milk (NFDM) in Tris buffered saline with 0.05% Tween 20 [TTBS; 150 mM NaCl, 3 mM KCl, 25 mM Tris, 0.05% Tween 20, dH2O, pH 7.5; 1 h, RT] and probed overnight (4°C) with primary antibody [p53 (1:500; Santa Cruz, sc-6243)]. Membranes were rinsed five times in TTBS (10 min, RT) and incubated with a horse-radish peroxidase (HRP)-conjugated secondary antibody [goat anti-rabbit (1:5,000; Cell Signalling Technology, #7074 S); 1 h, RT]. Membranes were rinsed five times in TTBS (10 min, RT). Immunoblots were visualized using the Clarity™ Western ECL Substrate Kit (Bio-Rad, #170-5060) and the images were captured using the ChemiDoc™ XRS+ Molecular Imaging System (Bio-Rad). Following detection, membranes were quenched in hydrogen peroxide (5%, 37°C, 30 min) and probed with the housekeeping protein, anti-β-actin (1:5,000, 30 min, RT; Sigma-Aldrich, A3854) to normalize protein expression. Protein expression was determined using the Image Lab Software version 5.1 (Bio-Rad) and the results were represented as a fold-change in band density (RBD) relative to the control.
Promoter methylation of p53
Genomic DNA was extracted from control and FA-treated HepG2 cells using the Quick-g-DNA MiniPrep Kit (Zymo Research, D3007) and purified using the DNA Clean and Concentrator™-5 Kit (Zymo Research, D4003), as per manufacturer’s instructions. DNA concentration was determined using the Nanodrop2000 spectrophotometer and standardized to 4 ng/µl. The purity of the DNA was assessed using the A260/A280 absorbance ratio. The promoter methylation of p53 was determined using the OneStep qMethyl Kit (Zymo Research, 5310) in which 20 ng DNA was subject to a test and reference reaction containing specific primers. Primer sequences and annealing temperatures are listed in Supplementary Table S1. Cycling conditions were as follows: digestion by methyl sensitive restriction enzymes (37°C, 2 h), initial denaturation (95°C, 10 min), followed by 45 cycles of denaturation (95°C, 30 s), annealing (Supplementary Table S1, 60 s), extension (72°C, 60 s), final extension (72°C, 60 s), and a hold at 4°C. The percentage methylation was calculated using the supplied formula (Supplementary Information) and represented as a fold-change relative to the control.
RNA immuno-precipitation
Quantification of m6A-p53 levels were conducted using RNA immuno-precipitation. Briefly, control and FA-treated HepG2 cells were incubated in nuclear isolation buffer [500 µl; 1.28 M sucrose, 40 mM Tris-HCl (pH 7.5), 20 mM magnesium chloride, 4% Triton X-100; 4°C, 20 min] and centrifuged (2,500xg, 4°C, 15 min). Nuclear pellets were re-suspended in RNA immuno-precipitation buffer [1 ml; 150 mM potassium chloride, 25 mM Tris-HCl (pH 7.4), 5 mM EDTA, 0.5 mM DTT, 0.5% IGEPAL, 100 U/ml SUPERase IN™ RNase Inhibitor (Thermo-Fisher Scientific, AM2694), protease inhibitors (Roche, 05892791001), phosphatase inhibitors (Roche, 04906837001)] and the chromatin was mechanically sheared using a needle (20 gauge/20 strokes). Thereafter, the nuclear membrane and debris were pelleted by centrifugation (13,000xg, 4°C, 10 min). The supernatant containing RNA was separated into two fractions of 500 µl each. Qiazol Reagent (500 µl) was added to one fraction and stored at −80°C for reference RNA isolation. The second fraction was incubated with m6A antibody [1:100; Abcam, ab208577] overnight at 4°C and the antigen-antibody complex was precipitated using protein A beads [20 µl 50% bead slurry (Cell Signalling Technology, #9863), 4°C, 3 h]. Thereafter, the immuno-precipitates were recovered by centrifugation (2,500xg, 4°C, 60 s), washed three times in RNA immuno-precipitation buffer, followed by re-suspension in Qiazol Reagent (500 µl). RNA was isolated from both the reference and m6A-precipitated samples, as previously described [Citation1]. The RNA was quantified using the Nanodrop2000 spectrophotometer, standardized to 400 ng/µl, and reverse transcribed into cDNA using the Maxima H Minus First Strand cDNA Synthesis Kit (Thermo-Fisher Scientific, K1652). The expression of p53 was then determined using qPCR as mentioned above. The expression of p53 in the m6A-precipitated sample was normalized against the expression of p53 in the reference sample in order to determine the ratio of m6A methylated p53 relative to the total p53 expressed. Primer sequences and annealing temperatures are listed in Supplementary Table S1.
Statistical analysis
GraphPad Prism version 5.0 (GraphPad Prism Software Inc.) was used to perform all statistical analyses. The D’Agostino and Pearson tests were used to determine normality. All data was analyzed using the one-way analysis of variance (ANOVA), followed by the Bonferroni multiple comparisons test. Results were represented as a mean fold-change ± standard deviation (SD) (n = 3). Statistical significance was considered at p < 0.05.
Author contributions
TG and AC conceptualized and designed the study. TG conducted all laboratory experiments, analyzed the data, and wrote the manuscript. SN and AC revised the manuscript. All authors have read the manuscript prior to submission.
Data availability
All datasets generated in this study are available in Supplementary Information and from the corresponding author on reasonable request.
Supplemental Material
Download MS Word (17.4 KB)Disclosure statement
The authors report no conflict of interest.
Supplementary material
Supplemental data for this article can be accessed here
Additional information
Funding
References
- Ghazi T, Nagiah S, Naidoo P, et al. Fusaric acid-induced promoter methylation of DNA methyltransferases triggers DNA hypomethylation in human hepatocellular carcinoma (HepG2) cells. Epigenetics. 2019 Aug;14(8):1–14.
- D’Alton A, Etherton B. Effects of fusaric acid on tomato root hair membrane potentials and ATP levels. Plant Physiol. 1984 Jan;74(1):39–42.
- Diniz S, Oliveira R. Effects of fusaric acid on Zea mays L. seedlings. Phyton Int J Exp Bot. 2009 Jan;78:155–160.
- Pavlovkin J, Mistrik I, Prokop M. Some aspects of the phytotoxic action of fusaric acid on primary ricinus roots. Plant Soil Environ. 2004 Sept;50(9):397–401.
- Singh VK, Singh HB, Upadhyay RS. Role of fusaric acid in the development of ‘Fusarium wilt’ symptoms in tomato: physiological, biochemical and proteomic perspectives. Plant Physiol Biochem. 2017 Sept; 118:320–332.
- Hidaka H, Asano M. Relaxation of isolated rabbit arteries by fusaric (5-butylpicolinic) acid. J Pharmacol Exp Ther. 1976 Dec;199(3):620–629.
- Hidaka H, Nagatsu T, Takeya K, et al. Fusaric acid, a hypotensive agent produced by fungi. J Antibiot. 1969 May;22(5):228–230.
- Yin ES, Rakhmankulova M, Kucera K, et al. Fusaric acid induces a notochord malformation in zebrafish via copper chelation. Biometals. 2015 Aug;28(4):783–789.
- Bungo T, Shimojo M, Masuda Y, et al. Induction of food intake by a noradrenergic system using clonidine and fusaric acid in the neonatal chick. Brain Res. 1999 May;826(2):313–316.
- Devnarain N, Tiloke C, Nagiah S, et al. Fusaric acid induces oxidative stress and apoptosis in human cancerous oesophageal SNO cells. Toxicon. 2017 Feb;126:4–11.
- Abdul NS, Nagiah S, Chuturgoon AA. Fusaric acid induces mitochondrial stress in human hepatocellular carcinoma (HepG2) cells. Toxicon. 2016 Sept;119:336–344.
- Ghazi T, Nagiah S, Tiloke C, et al. Fusaric acid induces DNA damage and post‐translational modifications of p53 in human hepatocellular carcinoma (HepG2) cells. J Cell Biochem. 2017 Nov;118(11):3866–3874.
- Mamur S, Ünal F, Yılmaz S, et al. Evaluation of the cytotoxic and genotoxic effects of mycotoxin fusaric acid. Drug Chem Toxicol. 2020 Mar;43(2):149–157.
- Dhani S, Nagiah S, Naidoo DB, et al. Fusaric acid immunotoxicity and MAPK activation in normal peripheral blood mononuclear cells and Thp-1 cells. Sci Rep. 2017 Jun;7(1):3051–3060.
- Ogata S, Inoue K, Iwata K, et al. Apoptosis induced by picolinic acid-related compounds in HL-60 cells. Biosci Biotechnol Biochem. 2001 Oct;65(10):2337–2339.
- Diringer MN, Kramarcy NR, Brown JW, et al. Effect of fusaric acid on aggression, motor activity, and brain monoamines in mice. Pharmacol Biochem Behav. 1982 Jan;16(1):73–79.
- Porter JK, Bacon CW, Wray EM, et al. Fusaric acid in Fusarium moniliforme cultures, corn, and feeds toxic to livestock and the neurochemical effects in the brain and pineal gland of rats. Nat Toxins. 1995;3(2):91–100.
- Smith T, MacDonald E. Effect of fusaric acid on brain regional neurochemistry and vomiting behavior in swine. J Anim Sci. 1991 May;69(5):2044–2049.
- Swamy H, Smith T, MacDonald E, et al. Effects of feeding a blend of grains naturally contaminated with Fusarium mycotoxins on swine performance, brain regional neurochemistry, and serum chemistry and the efficacy of a polymeric glucomannan mycotoxin adsorbent. J Anim Sci. 2002 Dec;80(12):3257–3267.
- Devaraja S, Girish KS, Santhosh MS, et al. Fusaric acid, a mycotoxin, and its influence on blood coagulation and platelet function. Blood Coagul Fibrinolysis. 2013 Jun;24(4):419–423.
- Reddy R, Larson C, Brimer G, et al. Developmental toxic effects of fusaric acid in CD1 mice. Bull Environ Contam Toxicol. 1996 Sept;57(3):354–360.
- Terasawa F, Kameyama M. The clinical trial of a new hypotensive agent, fusaric acid (5-butylpicolinic acid): the preliminary report. Japanese Circ J. 1971 Apr;35(3):339–357.
- Smith TK, McMillan EG, Castillo JB. Effect of feeding blends of Fusarium mycotoxin-contaminated grains containing deoxynivalenol and fusaric acid on growth and feed consumption of immature swine. J Anim Sci. 1997 Aug;75(8):2184–2191.
- Bacon CW, Porter JK, Norred WP. Toxic interaction of fumonisin B1 and fusaric acid measured by injection into fertile chicken egg. Mycopathologia. 1995 Jan;129(1):29–35.
- Fairchild A, Grimes J, Porter J, et al. Effects of diacetoxyscirpenol and fusaric acid on poults: individual and combined effects of dietary diacetoxyscirpenol and fusaric acid on turkey poult performance. Int J Poult Sci. 2005 Jun;4(3):350–355.
- Laptenko O, Prives C. Transcriptional regulation by p53: one protein, many possibilities. Cell Death Differ. 2006 Jun;13(6):951–961.
- Prives C, Hall PA. The p53 pathway. J Pathol. 1999 Jan;187(1):112–126.
- Kruiswijk F, Labuschagne CF, Vousden KH. p53 in survival, death and metabolic health: a lifeguard with a licence to kill. Nat Rev Mol Cell Biol. 2015 Jul;16(7):393–405.
- Vousden KH, Prives C. Blinded by the light: the growing complexity of p53. Cell. 2009 May;137(3):413–431.
- Chang JR, Ghafouri M, Mukerjee R, et al. Role of p53 in neurodegenerative diseases. Neurodegener Dis. 2012 Feb;9(2):68–80.
- Szybińska A, Leśniak W. P53 dysfunction in neurodegenerative diseases-the cause or effect of pathological changes? Aging Dis. 2017 Jul;8(4):506–518.
- Mitsudomi T, Steinberg SM, Nau MM, et al. p53 gene mutations in non-small-cell lung cancer cell lines and their correlation with the presence of ras mutations and clinical features. Oncogene. 1992 Jan;7(1):171–180.
- Barlev NA, Liu L, Chehab NH, et al. Acetylation of p53 activates transcription through recruitment of coactivators/histone acetyltransferases. Mol Cell. 2001 Dec;8(6):1243–1254.
- Shieh SY, Ikeda M, Taya Y, et al. DNA damage-induced phosphorylation of p53 alleviates inhibition by MDM2. Cell. 1997 Oct;91(3):325–334.
- Tang Y, Zhao W, Chen Y, et al. Acetylation is indispensable for p53 activation. Cell. 2008 May;133(4):612–626.
- Tuck SP, Crawford L. Characterization of the human p53 gene promoter. Mol Cell Biol. 1989 May;9(5):2163–2172.
- Chmelarova M, Krepinska E, Spacek J, et al. Methylation in the p53 promoter in epithelial ovarian cancer. Clin Transl Oncol. 2013 Feb;15(2):160–163.
- Kang JH, Kim SJ, Noh DY, et al. Methylation in the p53 promoter is a supplementary route to breast carcinogenesis: correlation between CpG methylation in the p53 promoter and the mutation of the p53 gene in the progression from ductal carcinoma in situ to invasive ductal carcinoma. Lab Invest. 2001 Apr;81(4):573–579.
- Woo HH, Chambers SK. Human ALKBH3-induced m1A demethylation increases the CSF-1 mRNA stability in breast and ovarian cancer cells. Biochim Biophys Acta Gene Regul Mech. 2019 Jan;1862(1):35–46.
- Fu Y, Dominissini D, Rechavi G, et al. Gene expression regulation mediated through reversible m6A RNA methylation. Nat Rev Genet. 2014 May;15(5):293–306.
- Geula S, Moshitch-Moshkovitz S, Dominissini D, et al. m6A mRNA methylation facilitates resolution of naïve pluripotency toward differentiation. Science. 2015 Feb;347(6225):1002–1006.
- Meyer KD, Patil DP, Zhou J, et al. 5′ UTR m6A promotes cap-independent translation. Cell. 2015 Nov;163(4):999–1010.
- Wang X, Zhao BS, Roundtree IA, et al. N6-methyladenosine modulates messenger RNA translation efficiency. Cell. 2015 Jun;161(6):1388–1399.
- Wang X, Lu Z, Gomez A, et al. N6-methyladenosine-dependent regulation of messenger RNA stability. Nature. 2014 Jan;505(7481):117–120.
- Xiao W, Adhikari S, Dahal U, et al. Nuclear m6A reader YTHDC1 regulates mRNA splicing. Mol Cell. 2016 Feb;61(4):507–519.
- Zheng G, Dahl JA, Niu Y, et al. ALKBH5 is a mammalian RNA demethylase that impacts RNA metabolism and mouse fertility. Mol Cell. 2013 Jan;49(1):18–29.
- Batista PJ, Molinie B, Wang J, et al. m6A RNA modification controls cell fate transition in mammalian embryonic stem cells. Cell Stem Cell. 2014 Dec;15(6):707–719.
- Wang CX, Cui GS, Liu X, et al. METTL3-mediated m6A modification is required for cerebellar development. PLoS Biol. 2018;16:1–29.
- Wang X, Zhu L, Chen J, et al. mRNA m6A methylation downregulates adipogenesis in porcine adipocytes. Biochem Biophys Res Commun. 2015 Apr;459(2):201–207.
- Dina C, Meyre D, Gallina S, et al. Variation in FTO contributes to childhood obesity and severe adult obesity. Nat Genet. 2007 Jun;39(6):724–726.
- Yang Y, Shen F, Huang W, et al. Glucose is involved in the dynamic regulation of m6A in patients with type 2 diabetes. J Clin Endocrinol Metab. 2019 Mar;104(3):665–673.
- Lin S, Choe J, Du P, et al. The m6A methyltransferase METTL3 promotes translation in human cancer cells. Mol Cell. 2016 May;62(3):335–345.
- Panneerdoss S, Eedunuri VK, Yadav P, et al. Cross-talk among writers, readers, and erasers of m6A regulates cancer growth and progression. Sci Adv. 2018 Oct;4(10):1–15.
- Dai D, Wang H, Zhu L, et al. N6-methyladenosine links RNA metabolism to cancer progression. Cell Death Dis. 2018 Jan;9(2):124–136.
- Wei W, Ji X, Guo X, et al. Regulatory role of N6‐methyladenosine (m6A) methylation in RNA processing and human diseases. J Cell Biochem. 2017 Sept;118(9):2534–2543.
- Wang X, He C. Dynamic RNA modifications in posttranscriptional regulation. Mol Cell. 2014 Oct;56(1):5–12.
- Liu J, Yue Y, Han D, et al. A METTL3–METTL14 complex mediates mammalian nuclear RNA N6-adenosine methylation. Nat Chem Biol. 2014 Feb;10(2):93–95.
- Jia G, Fu Y, Zhao X, et al. N6-methyladenosine in nuclear RNA is a major substrate of the obesity-associated FTO. Nat Chem Biol. 2011 Dec;7(12):885–887.
- Heo SH, Kwak J, Jang KL. All-trans retinoic acid induces p53-depenent apoptosis in human hepatocytes by activating p14 expression via promoter hypomethylation. Cancer Lett. 2015 Jun;362(1):139–148.
- Qing Y, Hu H, Liu Y, et al. Berberine induces apoptosis in human multiple myeloma cell line U266 through hypomethylation of p53 promoter. Cell Biol Int. 2014 May;38(5):563–570.
- Köhler K, Bentrup FW. The effect of fusaric acid upon electrical membrane properties and ATP level in photoautotrophic cell suspension cultures of chenopodium rubrum L. Zeitschrift für Pflanzenphysiologie. 1983 Mar;109(4):355–361.
- Chuturgoon A, Phulukdaree A, Moodley D. Fumonisin B1 induces global DNA hypomethylation in HepG2 cells–an alternative mechanism of action. Toxicology. 2014 Jan;315:65–69.
- So MY, Tian Z, Phoon YS, et al. Gene expression profile and toxic effects in human bronchial epithelial cells exposed to zearalenone. PLoS One. 2014 May;9(5):65–69.
- Zhu CC, Hou YJ, Han J, et al. Zearalenone exposure affects epigenetic modifications of mouse eggs. Mutagenesis. 2014 Nov;29(6):489–495.
- Dominissini D, Moshitch-Moshkovitz S, Schwartz S, et al. Topology of the human and mouse m6A RNA methylomes revealed by m6A-seq. Nature. 2012 May;485(7397):201–206.
- Li J, Han Y, Zhang H, et al. The m6A demethylase FTO promotes the growth of lung cancer cells by regulating the m6A level of USP7 mRNA. Biochem Biophys Res Commun. 2019 May;512(3):479–485.
- Zhong X, Yu J, Frazier K, et al. Circadian clock regulation of hepatic lipid metabolism by modulation of m6A mRNA methylation. Cell Rep. 2018 Nov;25(7):1816–1828.
- Li Z, Weng H, Su R, et al. FTO plays an oncogenic role in acute myeloid leukemia as a N6-methyladenosine RNA demethylase. Cancer Cell. 2017 Jan;31(1):127–141.
- Kwok CT, Marshall AD, Rasko JE, et al. Genetic alterations of m6A regulators predict poorer survival in acute myeloid leukemia. J Hematol Oncol. 2017 Dec;10(1):39–44.
- Zhang C, Samanta D, Lu H, et al. Hypoxia induces the breast cancer stem cell phenotype by HIF-dependent and ALKBH5-mediated m6A-demethylation of NANOG mRNA. Proc Natl Acad Sci. 2016 Apr;113(14):2047–2056.
- Chen M, Wei L, Law CT, et al. RNA N6‐methyladenosine methyltransferase‐like 3 promotes liver cancer progression through YTHDF2‐dependent posttranscriptional silencing of SOCS2. Hepatology. 2018 Jun;67(6):2254–2270.
- Li X, Yang J, Zhu Y, et al. Mouse maternal high-fat intake dynamically programmed mRNA m6A modifications in adipose and skeletal muscle tissues in offspring. Int J Mol Sci. 2016 Aug;17(8):1336–1344.
- Lu N, Li X, Yu J, et al. Curcumin attenuates lipopolysaccharide‐induced hepatic lipid metabolism disorder by modification of m6A RNA methylation in piglets. Lipids. 2018 Jan;53(1):53–63.
- Uddin MB, Roy KR, Hosain SB, et al. An N6-methyladenosine at the transited codon 273 of p53 pre-mRNA promotes the expression of R273H mutant protein and drug resistance of cancer cells. Biochem Pharmacol. 2019 Feb;160:134–145.
- Zhao T, Sun D, Zhao M, et al. N6-methyladenosine mediates arsenite-induced human keratinocyte transformation by suppressing p53 activation. Environ Pollut. 2020 Jan;259:113908–113920.
- Cui Q, Shi H, Ye P, et al. m6A RNA methylation regulates the self-renewal and tumorigenesis of glioblastoma stem cells. Cell Rep. 2017 Mar;18(11):2622–2634.
- Xu D, Shao W, Jiang Y, et al. FTO expression is associated with the occurrence of gastric cancer and prognosis. Oncol Rep. 2017 Oct;38(4):2285–2292.
- Liu JE, Li K, Cai J, et al. Landscape and regulation of m6A and m6Am methylome across human and mouse tissues. Mol Cell. 2020 Jan;77(2):426–440.
- Huang B, Ding C, Zhou Q, et al. Cyclophosphamide regulates N6-methyladenosine and m6A RNA enzyme levels in human granulosa cells and in ovaries of a premature ovarian aging mouse model. Front Endocrinol. 2019 Jun;10:415–428.
- Liu J, Ren D, Du Z, et al. M6A demethylase FTO facilitates tumor progression in lung squamous cell carcinoma by regulating MZF1 expression. Biochem Biophys Res Commun. 2018 Aug;502(4):456–464.
- Zhang Y, Wang X, Zhang X, et al. RNA-binding protein YTHDF3 suppresses interferon-dependent antiviral responses by promoting FOXO3 translation. Proc Natl Acad Sci. 2019 Jan;116(3):976–981.
- Li A, Chen YS, Ping XL, et al. Cytoplasmic m6A reader YTHDF3 promotes mRNA translation. Cell Res. 2017 Mar;27(3):444–447.
- Shi H, Wang X, Lu Z, et al. YTHDF3 facilitates translation and decay of N6-methyladenosine-modified RNA. Cell Res. 2017 Mar;27(3):315–328.
- Tanabe A, Tanikawa K, Tsunetomi M, et al. RNA helicase YTHDC2 promotes cancer metastasis via the enhancement of the efficiency by which HIF-1α mRNA is translated. Cancer Lett. 2016 Jun;376(1):34–42.
- Livak KJ, Schmittgen TD. Analysis of relative gene expression data using real-time quantitative PCR and the 2−ΔΔCT method. Methods. 2001 Dec;25(4):402–408.