
ABSTRACT
In the clinical management of paediatric solid tumours, histological examination of tumour tissue obtained by a biopsy remains the gold standard to establish a conclusive pathological diagnosis. The DNA methylation pattern of a tumour is known to correlate with the histopathological diagnosis across cancer types and is showing promise in the diagnostic workup of tumour samples. This methylation pattern can be detected in the cell-free DNA. Here, we provide proof-of-concept of histopathologic classification of paediatric tumours using cell-free reduced representation bisulphite sequencing (cf-RRBS) from retrospectively collected plasma and cerebrospinal fluid samples. We determined the correct tumour type in 49 out of 60 (81.6%) samples starting from minute amounts (less than 10 ng) of cell-free DNA. We demonstrate that the majority of misclassifications were associated with sample quality and not with the extent of disease. Our approach has the potential to help tackle some of the remaining diagnostic challenges in paediatric oncology in a cost-effective and minimally invasive manner.
Introduction
The diagnostic work-up of paediatric cancer patients with solid tumours requires a number of investigations to obtain a full diagnosis and a complete staging. Most imaging and tumour marker investigations are of low specificity and do not result in a definitive diagnosis. Thus, in most cases, a histopathological examination of a surgically derived tumour biopsy is required. Many of the paediatric tumours share a ‘small blue’ histology and show few lineage-specific morphological features. Hence, extensive immunohistochemistry staining is often required to establish a diagnosis.
Nevertheless, some types of embryonic tumours or sarcomas remain hard to classify correctly. In the context of international frontline clinical trial protocols, tumour specimens are often sent for central pathology review. In a small percentage of patients, discrepancy in either stage or diagnosis can result in suboptimal treatment [Citation1,Citation2]. In paediatric renal tumours, the rate of misdiagnosis was estimated to range from 3.5% to 17% based on multicenter clinical trials [Citation1]. Limited tissue availability due to fine needle biopsy sampling can further complicate the diagnostic work-up. Furthermore, for some types of paediatric tumours, sampling of the tumour is not routinely recommended in some treatment protocols (e.g. SIOP protocol for the treatment of renal tumours [Citation3,Citation4]) or is deemed too risky due to the location (e.g. diffuse intrinsic pontine glioma) or clinical condition of the patient (e.g. contra-indications for anaesthesia due to extensive disease). Thus, therapy needs to be started empirically based on imaging and clinical characteristics alone, increasing the odds for misdiagnosis.
The epigenetic signal of primary tissue samples is currently being explored to complement classical histopathological analysis. This epigenetic signal seems to be highly tissue-specific [Citation5–7] as opposed to most mutational or copy number alterations. This tissue specificity is the dominant remaining signal after malignant transformation, resulting in a unique fingerprint of DNA for different tumour entities [Citation8,Citation9]. For example, the DNA methylation signal contributed to obtaining the correct diagnosis in 25 out of 30 cases in a cohort of translocation-negative Ewing sarcoma samples [Citation10]. Among brain tumours, primitive neuro-ectodermal tumours of the central nervous system (CNS-PNETs) are notoriously difficult to diagnose based on histology alone. DNA methylation revealed that this entity is actually composed of multiple known and previously unknown tumour types [Citation11]. Furthermore, in a large cohort of 1155 prospectively collected brain tumour samples, 12% of histopathological diagnoses could be adjusted based on tumour DNA methylation characteristics [Citation12]. In medulloblastoma, prospective clinical trials are currently ongoing to test whether the adaptation of treatment based on new multi-omics (including DNA methylation) improves event-free survival (NCT02066220).
Recently, analysis of cell-free tumour-derived DNA (ctDNA) isolated from liquid biopsies, including blood, has emerged as a complementary assay for tumour tissue genomic profiling [Citation13]. In paediatric oncology, small studies have shown that these liquid biopsies have the potential to support the initial diagnosis, aid in therapeutic stratification, evaluate the effect of the treatment, and can allow for early relapse detection [Citation14]. Several groups have investigated the use of cell-free DNA (cfDNA) methylation for non-invasive diagnosis of both benign [Citation15] and malignant [Citation16] conditions. For example, Kang et al. developed CancerLocator [Citation8], an algorithm based on the epigenetic signature determined on whole-genome bisulphite sequencing (WGBS) to classify cfDNA of adult cancer patients to their corresponding tumour tissue. Through data deconvolution, the CancerLocator method was able to correctly classify samples, even if they had a low percentage of ctDNA, outperforming standard machine-learning approaches.
Although tumour classification from the epigenetic cfDNA profile is possible, the high cost of WGBS limits its use in routine clinical diagnostics and follow-up. Reduced representation bisulphite sequencing (RRBS) is a cost-effective alternative whereby only a small informative fraction of the genome is surveyed [Citation17]. Enrichment of CpG-rich sites by digesting DNA with the MspI restriction enzyme (cuts 5ʹ-C/CGG-3ʹ), followed by DNA fragment size-selection is a commonly applied strategy of RRBS. This method was redesigned by De Koker et al. [Citation18] to allow single tube RRBS library preparation on low-input levels (10 ng) of low-quality and/or fragmented DNA.
Our study investigates whether the methylome profile generated with RRBS on cfDNA (cf-RRBS) is capable of classifying paediatric tumours according to their histopathological diagnosis. To this end, we profiled plasma or CSF of 59 patients with paediatric cancer. This methylation profile was used to classify the sample according to a reference dataset built from publicly available methylome data of paediatric tumours of known histology. We further explored the tumour copy number profile extracted from cf-RRBS data and compared it against the copy number profile obtained using shallow whole-genome sequencing data on cfDNA.
Materials and methods
Patients and samples
Paediatric cancer patients (median age 46 months [18.5–114.5]) were included retrospectively if plasma or CSF was available at diagnosis (n = 58) or at relapse (n = 1). For one case (patient_36, clear cell sarcoma of the kidney), two plasma samples were available at different timepoints, resulting in a total of 60 samples. Samples were collected at Ghent University Hospital (Ghent, Belgium, n = 20), Prinses Máxima Centrum (Utrecht, The Netherlands, n = 15), Institut Curie (Paris, France, n = 6), and Prague Motol University Hospital (Prague, Czech Republic, n = 19). Blood was collected from patients with neuroblastoma (n = 10), Wilms tumour (n = 16), malignant rhabdoid tumour of the kidney (MRT, n = 1), clear cell sarcoma of the kidney (CCSK, n = 2), alveolar rhabdomyosarcoma (n = 9), embryonal rhabdomyosarcoma (n = 8), osteosarcoma (n = 4), and Ewing sarcoma (n = 6). CSF was collected from patients with medulloblastoma (n = 3) and atypical teratoid rhabdoid tumour (n = 1). The local ethical committee approved the study and written consent was obtained from all patients enrolled in this study or their representatives. Per-sample information is available in supplementary Table 1. Descriptive statistics were performed with R v3.5.1 and Python v3.6.3 and are expressed by median [Q25 – Q75] (supplementary data). Unless otherwise stated, the non-parametric Wilcoxon rank-sum test was used to test for significance with alpha specified at 0.05.
Sample collection and processing
Ghent University Hospital
Whole blood was collected in citrate tubes (Greiner Bio-One, n = 16). Plasma was obtained after 1 × 8 min centrifugation at 1885 g. The time between blood collection and plasma preparation was not documented. All plasma samples were stored at −80°C until processing for cfDNA extraction. CSF was collected into tubes without additives. The CSF was stored at −80°C until further processing for cfDNA extraction.
Prinses Máxima centre
Whole blood from all patients was collected in EDTA Vacutainer tubes (BD Biosciences). Plasma was obtained after 1 x 10 min centrifugation at 1375 g with centrifuge acceleration and without deceleration. The plasma was stored at −20°C until processing for cfDNA extraction. Plasma was prepared within 24 hours after blood collection.
Prague Motol University Hospital
Whole blood from all patients was collected in EDTA Vacutainer tubes (BD Biosciences). Plasma was obtained after 1 × 10 min centrifugation at 1600 g at room temperature, centrifuge acceleration, and deceleration was set to two, followed by a subsequent centrifugation step of 1 × 10 minutes at 16,000 g at room temperature. The plasma was stored at −80°C until processing for cfDNA extraction. Before the first centrifugation step, 2.5% (v/v) of a 10% formaldehyde solution was added. Plasma was prepared within 4 h after blood draw.
Institut Curie
Whole blood was collected in EDTA tubes. Plasma was obtained after 1 × 20 min centrifugation at 2000 g at room temperature, centrifuge acceleration, and deceleration was set to two, followed by a subsequent centrifugation step of 1 × 2 minutes at 16,000 g at room temperature. The plasma was stored at −80°C until processing for cfDNA extraction.
Cell-free DNA extraction
Ghent university hospital and Prinses Máxima Center
cfDNA was extracted using the Maxwell RSC LV ccfDNA kit (Promega). Isolation of cfDNA was done starting from 200 µL to 2 mL of plasma or CSF, and if less volume was available, volumes were adjusted to 2 mL by adding 1x PBS (Gibco). DNA extraction was performed according to the manufacturer’s instructions. DNA was eluted in 75 μL of elution buffer (Promega).
Prague Motol University Hospital
cfDNA was extracted using the QIAamp Circulating Nucleic Acid kit (Qiagen). Isolation of cfDNA was done from 1 mL of plasma. DNA extraction was performed according to the manufacturer’s instructions. DNA was eluted in 25 μL of AVE buffer (Qiagen).
Institut Curie
cfDNA was extracted using QIAamp Circulating Nucleic Acid Kit (Qiagen) with the Qiavac24s system, according to the manufacturers’ recommendations. Isolation of cfDNA was done starting from 200 µL to 1.5 mL of plasma. Volumes were adjusted to 2 mL by adding 1x PBS (Gibco). DNA was eluted in 36 μL of AVE buffer (Qiagen).
Cell-free DNA quality control
DNA concentration was measured using the Qubit high-sensitivity kit (Thermo Fisher Scientific). Size distribution of the cfDNA was measured using the FEMTO Pulse Automated Pulsed-Field CE Instrument (Agilent) according to the manufacturer’s instructions (NGS Kit, FP-1101-0275). The ratio between cfDNA and high-molecular-weight DNA (HMW) was calculated with the ProSize 3.0 software (Agilent). To this end, the sizing was based on the lower marker only. Then, the cfDNA region was defined as regions between 0 and 700 bp. The HMW range was defined as fragments >700 bp, after exclusion of the upper marker. Samples with a cfDNA/HMW ratio less than 1 were labelled as ‘high HMW contamination’, samples with a cfDNA/HMW ratio between 1 and 5 ‘medium HMW contamination’ and samples with a cfDNA/HMW ratio >5 as ‘low HMW contamination’ (supplementary Figure 2). We then evaluated these cut-offs by collecting blood from three healthy volunteers in EDTA tubes. The tubes were either processed immediately or left standing at room temperature for 24 or 72 hours. The blood tubes that were processed immediately all showed a cfDNA/HMW ratio above 5 (8.53, 6.04, and 40.62, respectively). The cfDNA/HMW ratio of the EDTA tubes that were left standing for 24 h was all between 1 and 5 (4.02, 1.5 and 3.73, respectively) and the cfDNA/HMW ratio of the tubes that were left standing for 72 h was all lower than 1 (0.33, 0.24, and 0.40, respectively).
RRBS library construction
Median input DNA for the library construction was 10.00 ng [7.65–10.19]. Library construction was performed according to the methods described by De Koker et al. [Citation18] with the following modifications: [1] If DNA concentration was lower than 0.2 ng/µL, samples were concentrated on a vacuum centrifuge (SpeedVac, Thermo Fischer Scientific) at 35°C and H2O was added to a volume of 10.6 or 11.1 µL, depending on the amount of lambda spike-in (1 µL or 0.5 µL of a 0.01 ng/µL solution). [2] Libraries prepared using the cf-RRBS protocol were cleaned by magnetic bead selection (AMPure XT beads – NEB) and eluted in 0.1X TE buffer. The libraries were visualized with the Fragment Analyser (Advanced Analytical Technologies) and quantified using the Kapa library quantification kit for Illumina platforms (Kapa Biosystems). [3] Based on the concentration, the libraries were equimolarly pooled and were sequenced on a NextSeq500 instrument with a NextSeq 500/550 High Output Kit V2.5 (75 cycles) using 5% PhiX without dark cycles (n = 11) or 10–20% PhiX with 7 dark cycles (protocol provided by Illumina, n = 49). A maximum of 12 samples were pooled in one sequencing run resulting in 19.05 million [17.05–21.72] single-end reads per sample on average (supplementary table 2).
Sequencing quality control and mapping
After sequencing, BCL files were demultiplexed using bcl2fastq v2.19.1.403. The raw fastq files were first quality checked with FastQC v0.11.5 [Citation19]. During this check, many reads did not pass quality control due to severe adaptor contamination. These adaptors were removed with Trim Galore v0.4.4 [Citation20] (with – RRBS flag for RRBS data) and CutAdapt v1.16 [Citation21] with default parameters except for ‘–three_prime_clip_R1 1’, and processed fastq files were again quality checked with FastQC. Mapping to GRCh37 was done with Bismark v0.19.0 [Citation22] with default parameters. Mapping efficiency of the cf-RRBS samples was 50.25% [46.00–52.62]. Bisulphite conversion percentage was assessed by mapping to the lambda genome and was 98.05% [98.65–97.50]. The bait regions were defined as the MspI regions between 20 and 200 bp in GRCh37 (see ‘Feature Generation’) and the number of reads in these regions were counted with picard tools v2.18.27 (hsmetrics module; http://broadinstitute.github.io/picard/). The percentage of bases mapping to these ‘bait’ regions was 87.43% [85.29–90.19]. Per-sample information is available in supplementary table 2. Visualizations were made with the R programming language v3.2.1. and ggplot2 v3.0.0.
Copy number alteration profiling
For each cfDNA sample, shallow whole-genome sequencing (sWGS) data was available to assess copy number alterations. After DNA isolation, cfDNA was processed as previously described by Raman et al. [Citation23]. After sequencing, fastq files were mapped to GRCh38 with bwa v0.7.17 and duplicate reads were removed after mapping with picard tools v2.1.1. WisecondorX (https://github.com/CenterForMedicalGeneticsGhent/WisecondorX) with 400 kb binsize was used to call copy number variations. In addition, we used WisecondorX to detect copy number alterations in the cf-RRBS data with 400 kb bins after mapping (Bismark) to a bisulphite converted GRCh38 reference genome. Duplicate reads were not removed in the cf-RRBS data in accordance with the Bismark user guide [Citation22]. All samples were normalized with an in-house dataset from data obtained from healthy volunteers for both sWGS and cf-RRBS. Copy number alteration profiles from all samples are available in supplementary Figures 2.
IchorCNA
To estimate the circulating tumour percentage in the cfDNA from the sWGS data, we used ichorCNA (https://github.com/broadinstitute/ichorCNA) with 500 kb binsize and the following parameters: ‘–chrs “c(1:22)” – chrTrain “c(1:22)” – scStates “c(1,3)” – txnE 0.9999 – txnStrength 10,000 – normal “c(0.2, 0.35, 0.5, 0.65, 0.8)” – maxCN 5’. For samples that were estimated to have less than 25% tumour fraction with the initial ichorCNA parameters, we adjusted the ichorCNA parameters to “–chrs ‘c(1:22)’ – chrTrain ‘c(1:22)’ – txnE 0.9999 – txnStrength 10,000 – scStates ‘c()’ – estimateScPrevalence FALSE – normal ‘c(0.2, 0.35, 0.5, 0.65, 0.8, 0.95, 0.99, 0.995, 0.999)’ – maxCN 5“ as recommended by the ichorCNA documentation.
Building classifier with publicly available data
We used publicly available methylation profiling data from neuroblastoma (n = 220), osteosarcoma (n = 86), Wilms tumour (n = 131), clear cell sarcoma of the kidney (CCSK, n = 11) (TARGET, https://ocg.cancer.gov/programs/target), rhabdomyosarcoma [Citation24] (n = 53), Ewing sarcoma [Citation12,Citation25,Citation26] (n = 38), malignant rhabdoid tumours[Citation27] (MRT, n = 26), prepubertal white blood cells [Citation28] (WBCs, n = 52) and non-malignant cfDNA [Citation16,Citation29] (n = 24) to build the reference set. The methylation signature of 2801 brain tumours, encompassing 81 different tumour entities, was obtained from Capper et al. [Citation12], and all 81 entities were used to build the brain tumour cfDNA classifier.
Neuroblastoma cases from TARGET with unspecified MYCN status and rhabdomyosarcoma cases with unspecified subgroup (embryonal/alveolar) were removed from the datamatrix (supplementary table 3).
Within these published datasets, the epigenetic profile of neuroblastoma, osteosarcoma, Wilms tumour, CCSK, WBC, rhabdomyosarcoma, and Ewing sarcoma was determined with Infinium HumanMethylation450 K (HM450 K) and MRT samples were determined with Infinium HumanMethylationEPIC. For non-malignant controls by Chan et al. [Citation29]. (n = 24), the authors used shallow WGBS (sWGBS). Processing of raw fastq files from the public sequencing data was done as described in the section ‘sequencing quality control and mapping’. WGBS files were deduplicated after mapping with Bismark, RRBS samples were not deduplicated. Accession numbers for published datasets are available in supplementary table 3. Chromosomes X and Y were removed from downstream analysis.
Feature selection
CpGs were grouped in order to use more mappable reads. Input data (cf-RRBS test set & public reference set) was prepared similar to Kang et al. However, we adjusted the target regions to make them more suited for RRBS data. First, we used mkrrgenome [Citation30] to extract all MspI regions between 20 and 200 bp from GRCh37. Then, we merged all remaining regions within 1 bp from each other with BEDtools [Citation31]. Finally, clusters were retained if they contain at least three CpGs covered on the Illumina HM450 K array, resulting in 14,103 clusters covering 61,750 probes on the HM450 K array. In our cohort, these regions were consistently covered across all samples, except for eight regions that were not covered in any of the samples (supplementary data).
T-SNE visualizations
Clustered and processed beta values from the nine reference entities were grouped into a single data matrix with Python v3.6.3 and pandas v0.20.3. A t-SNE plot was generated on the full data matrix (634 samples and 4811 CpG clusters), after removing missing values (9292 CpG clusters, 65.88%) with sklearn v0.19.1 and matplotlib v2.1.0. The t-SNE parameters were n_components = 2, perplexity = 30, n_iter = 2000. Mean sigma was 1.678887, error after 2000 iterations was 0.466.
NNLS classification
Classification of plasma and CSF cfDNA samples was done with non-negative least squares (NNLS) matrix decomposition as described by Moss and colleagues [Citation15] (https://github.com/nloyfer/meth_atlas). The reference sets were identical as previously described (one reference set for intracranial and one reference set for extracranial tumour entities) and CpGs were grouped in 14,103 clusters as well for both reference and test samples. As a normal class, the sWGBS cfDNA data from Chan et al. was used for both reference sets. For each tumour entity in the reference dataset, the median beta value of the CpG cluster was calculated, resulting in one column with beta values per tumour or normal entity. The sample class was determined by extracting the tumour entity with the highest fraction (after normal and WBC fractions) after running the meth_atlas NNLS wrapper. Samples with no estimated tumour fraction were labelled as inconclusive.
Results
The methylation signature is paediatric tumour type specific
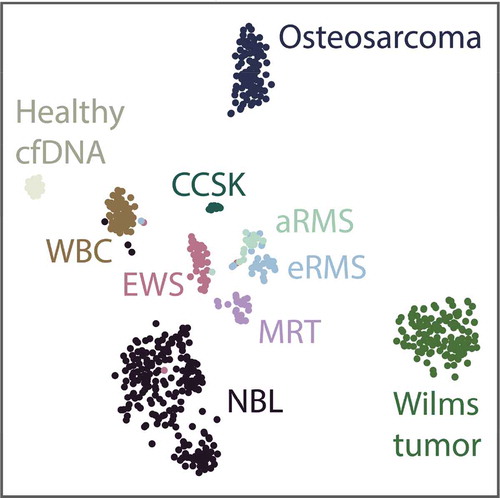
Similar to the t-SNE plots as described by Capper et al. [Citation12], we applied t-SNE dimensionality reduction () to the extracranial reference dataset to assess the feasibility of establishing the diagnosis of extracranial paediatric cancers based on the methylation signature from public data. Separate clusters based on the methylation pattern of the primary tumour could be visually identified, and these clusters correspond to the histopathological diagnosis as described in the original dataset. Furthermore, Ewing sarcoma samples from three different public datasets cluster together, indicating that laboratory and/or method batch effects from different publicly available datasets are not dominating the classification. In addition, some individual tumour samples cluster with WBCs. We hypothesize that either these biopsies may have been contaminated with leukocytes during surgery, or the tumour might have been rich in infiltrating lymphocytes. Nevertheless, to avoid bias, these samples were not excluded from the reference dataset.
Figure 1. 2-component t-SNE plot derived from the samples in the extracranial tumour reference dataset after grouping CpGs into 14,103 regions. cfDNA, cell-free DNA; NBL, neuroblastoma; aRMS, alveolar rhabdomyosarcoma; eRMS, embryonal rhabdomyosarcoma; EWS, Ewing sarcoma; CCSK, clear cell sarcoma of the kidney; MRT, malignant rhabdoid tumour; MB, medulloblastoma; ATRT, atypical teratoid-rhabdoid tumour
Classification of cfDNA according to histopathological diagnosis
The cfDNA methylation pattern of 60 paediatric cancer samples (59 patients), including 56 plasma and 4 CSF samples, was investigated with cf-RRBS. After deconvolution of the genome-wide methylation signal, we were able to correctly classify 49 samples (81.66%) according to the histopathologic diagnosis.
Within the extracranial tumour entities, we could correctly classify neuroblastoma (n = 9/10), Wilms tumour (n = 13/16), rhabdomyosarcoma (n = 14/17), MRT (n = 1/1), CCSK (n = 1/2), Ewing sarcoma (n = 3/6), and osteosarcoma (n = 4/4) from the cfDNA methylation profile (). Subclass identification within the rhabdomyosarcoma group (i.e. alveolar and embryonal) is correct in 13 out of 14 of the rhabdomyosarcoma cases. One of the two CCSK samples derived from the same patient but sampled 24 hours apart misclassified as an osteosarcoma sample with an estimated tumour fraction of 2.5%, the second one classified correctly as CCSK with a 2.5% estimated tumour fraction.
Figure 2. Overview of the results after classification based on the cfDNA methylation profile of the respective samples. Red labels near the dots on the scatter plot indicate what entity the sample is misclassified as. TFx, tumour fraction. Inconclusive indicates that no tumour fraction was detected in the cfDNA; NBL, neuroblastoma; aRMS, alveolar rhabdomyosarcoma; eRMS, embryonal rhabdomyosarcoma; OS, osteosarcoma; EWS, Ewing sarcoma; WT, Wilms tumour; CCSK, clear cell sarcoma of the kidney; MRT, malignant rhabdoid tumour; MB, medulloblastoma; ATRT, atypical teratoid-rhabdoid tumour
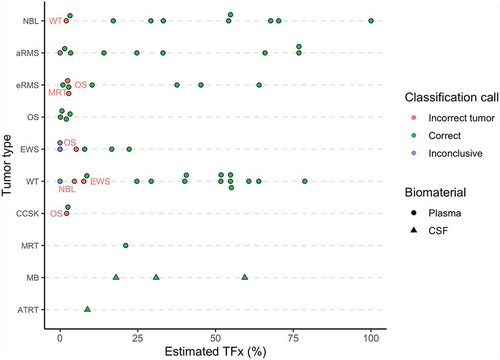
In addition, we were able to distinguish medulloblastoma (n = 3/3) from an atypical teratoid-rhabdoid tumour using the methylation profile of CSF cfDNA.
Classification accuracy is correlated with sample quality
Misclassified samples had significantly lower estimated tumour fraction in the cfDNA based on methylation data (2.10% [0.00–3.70] vs 30.90% [8.80–54.80], p = 0.0029). If the estimated tumour fraction was above 10%, all samples classified correctly (n = 36). If the estimated tumour fraction was below 10%, 13 out of 24 samples (54.17%) classified correctly (). To investigate whether a low tumour fraction correlates to disease extent, we grouped patients by metastatic status. Between these two groups, the estimated tumour fraction was not significantly different (30.90% [3.00–54.50] vs 16.60% [3.20–51.80], p = 0.39, ).
Figure 3. Top left: the estimated tumour fraction is significantly lower in the misclassified group (p = 0.0029, Wilcoxon rank-sum test)). Top right: The estimated tumour fraction does not differ significantly for disease extent across all tumour types (p > 0.05, Wilcoxon rank-sum test). Bottom left: The majority of the misclassifications are situated in the medium and high HMW group (cfDNA/HMW ratio less than 5). Bottom right: In the group with low HMW DNA contamination, classification accuracy reaches 100% (n = 30/30), indicating that pre-analytical variables or sample quality might influence the classification accuracy. TFx, tumour fraction; HMW, high-molecular weight; cfDNA, cell-free DNA; CSF, cerebrospinal fluid; **** = p = 0.0029, after omitting the ‘inconclusive’ group
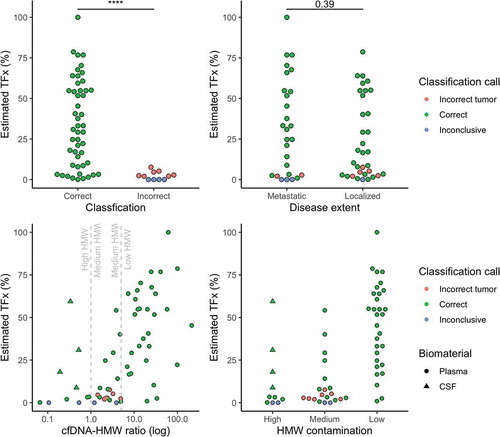
Further investigation into the misclassified samples revealed that the majority of these samples had evidence for medium to high HMW contamination (cfDNA/HMW DNA ratio less than 5). In samples with low HMW DNA contamination, the classification accuracy was 100% (n = 30/30) (). In samples with medium to high HMW DNA contamination, the classification accuracy was 63.33% (n = 19/30). For the patient with a CCSK, where a discrepant classification was seen for samples that were taken 24 h apart, we observed a cfDNA/HMW ratio of 2 for the misclassified sample, while the correctly classified sample has a cfDNA/HMW ratio of 30.
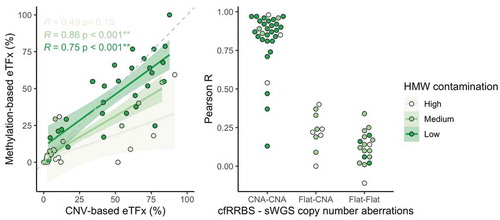
Copy number analysis is feasible using cf-RRBS data
Copy number alterations could be detected with sWGS in 42 out of 60 samples (, supplementary Figures 2). The concordance between estimated tumour fraction using methylation profiling data and the estimated tumour fraction by ichorCNA analysis of sWGS profiles was moderate for samples with low to medium HMW DNA contamination (Spearman r 0.75 and 0.86, respectively, ). Although cfRRBS data are not optimal for copy number variant analysis due to an uneven distribution of reads across the genome, we still successfully performed copy number profiling in all samples (, supplementary figures 2). Importantly, MYCN amplification could be observed with both the sWGS and cf-RRBS copy number alteration profiles in the three neuroblastoma samples with confirmed MYCN amplification. If copy number alterations were present in cf-RRBS (n = 32), the correlation of the copy number alteration profile with sWGS was high (0.87 [0.82–0.94]). However, the reverse was not true; several samples (n = 10) showed copy number alterations according to sWGS but none using cf-RRBS. In the group with discordant copy number alteration profiles between cf-RRBS and sWGS, 5 out of 10 samples (50%) had evidence for high HMW contamination. In contrast, in the group showing copy number alterations with both methods, only 4 out of 46 samples (8.69%) had evidence for high HMW DNA contamination (p = 0.004, Fisher’s Exact Test). None of the 18 (out of 60) samples that showed no copy number alterations using sWGS had evidence for copy number alterations based on cf-RRBS data ().
Figure 4. Top & middle: Example of the comparison of copy number profiles derived from (top) cf-RRBS data and (middle) sWGS data with 400 kb binsize of a high-quality sample. Lower left: sliding window of 10 Mb average log2 ratio. Lower right: scatterplot between cf-RRBS and sWGS with Pearson r. The dotted line equals least squares fit; the solid line equals the orthogonal regression fit. Cf-RRBS, cell-free reduced representation bisulphite sequencing; sWGS, shallow whole-genome sequencing
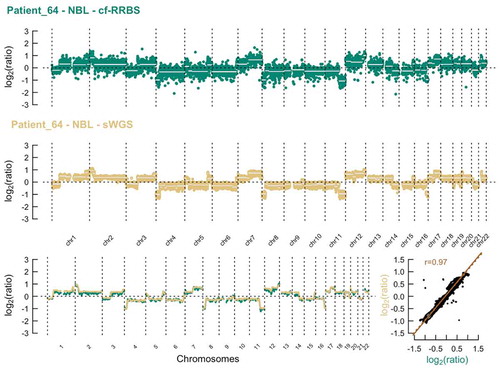
Figure 5. Top & middle: Example of the comparison of copy number profiles derived from (top) cf-RRBS data and (middle) sWGS data with 400 kb binsize of a low-quality sample. Lower left: sliding window of 10 Mb average log2 ratio. Lower right: scatterplot between cf-RRBS and sWGS with Pearson r. The dotted line equals least squares fit; the solid line equals the orthogonal regression fit. Cf-RRBS, cell-free reduced representation bisulphite sequencing; sWGS, shallow whole-genome sequencing
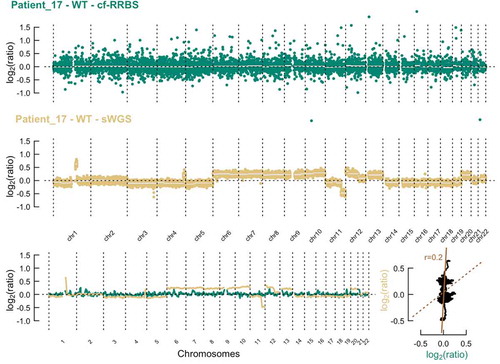
Figure 6. Left: scatterplot of the estimated tumour fraction derived from cf-RRBS data vs. estimated tumour fraction derived from sWGS data. In samples with low to medium HMW contamination, Spearman correlation between methylation and CNA-based tumour fraction estimation is moderate to high (r = 0.75 and 0.86, respectively). Solid line equals the linear regression fit. Dashed line equals x = y. Right: if CNAs are present in both cf-RRBS and sWGS data, Pearson correlation between both methods is high. ‘Flat’ indicates copy neutral (i.e. no gains or losses) samples. eTFx, estimated tumour fraction; CNV, copy number variations; CNA, copy number aberrations, HMW contamination, high-molecular-weight DNA contamination; ** = p < 0.001
Discussion
We show that classification based on cfDNA methylation profile as determined by cf-RRBS is feasible for the subset of extra- and intracranial paediatric cancer entities included in this study. Overall, we are able to correctly classify 49 out of 60 (81.6%) samples. We are able to identify specific recurrent genomic alterations such as MYCN amplification in neuroblastoma and differentiate between alveolar and embryonal rhabdomyosarcoma subtype from these same data. Importantly, only 0.75–10 ng of cfDNA is required for the cf-RRBS analysis, an amount easily obtainable from 200 µl of plasma, making clinical implementation in paediatric practice feasible. Furthermore, cost-per-sample was calculated at a conservative 180 euro, including sample collection, DNA isolation, library preparation, and sequencing (excluding personnel costs), favouring our techniques routine application over the substantially more expensive gold-standard of WGBS.
Other efforts exploring cfDNA in paediatric cancer have focused on detection of copy number aberrations, structural variants [Citation32,Citation33] and mutations [Citation34]. However, these alterations come with low specificity for classification of paediatric solid tumours according to their histopathological diagnosis [Citation35]. In addition, there is a high interest to develop a screening test based on cfDNA methylation in adult oncology [Citation36]. Due to the rarity of cancer in children, we do not see our test as a screening tool, but rather as a complementary diagnostic test for children for whom a classic biopsy is unfeasible or of low quality. Indeed, it could improve the diagnosis of tumour types with very similar histology (e.g. small round blue cell tumours) as illustrated by the distinction of MRT, CCSK, and Wilms tumour in this study. This could potentially impact on clinical decision-making for patients with renal tumours who are usually not biopsied before therapy starts. Another major application is in the minimally invasive classification of brain tumours, where tumour tissue methylation profiling is being pitched as a way to improve tumour classification [Citation11,Citation12] but high quality and sufficiently large biopsies are hard to obtain.
In our study, misclassifications seemed to be predominantly associated with sample quality. Samples of low quality had a higher amount of high-molecular weight, non-cell-free DNA and this artificially reduced the estimated tumour fraction, resulting in a more challenging classification. For example, when blood was sampled from a patient with a CCSK with a time delay of 24 hours, the high-quality sample classified correctly, while the low-quality sample misclassified. Inherent to the retrospective multicenter nature of our study is a lack of control over the pre-analytical variables such as the blood tube used, the handling of the collection tube, any delay between collection and downstream processing and the SOP used in cfDNA isolation. Preservation tubes (e.g. Streck Cell-Free DNA BCT, Streck) have been developed to stabilize the cfDNA and avoid high-molecular-weight DNA contamination. However, it is currently unknown to what extent the preservation medium in these tubes alters the methylation profile of the cfDNA or hampers its downstream processing for cf-RRBS. Furthermore, classification accuracy may be improved for samples with a very low ctDNA fraction given a more sensitive computational deconvolution algorithm, a more robust reference dataset, or a combination of genomic and epigenomics-based classification. Interestingly, in our study, the estimated ctDNA fraction was not associated with the extent of disease. This is in contrast to the adult oncology field, where it has often been suggested that cfDNA-based assays are mainly of value in a high stage, metastatic disease [Citation37]. This may depend on the tumour entity, but should further be explored in the future, prospective studies.
Furthermore, we could correctly classify 9 out of 18 samples with a neutral cfDNA copy number alteration profile. This hints at an improved sensitivity of methylation profiling over copy number alteration profiling in cfDNA samples with a low tumour fraction. In 10 samples, a discrepancy between copy number alteration profiling between cf-RRBS and sWGS was observed, with copy number alterations only being present in the sWGS samples. The cf-RRBS protocol was not developed for copy number estimation of cfDNA. Due to the enrichment of CpG islands, there is an uneven distribution of reads across the genome. Therefore, the copy number alteration estimation of cf-RRBS is inherently more difficult compared to shallow whole-genome sequencing, as sWGS has an even distribution of reads across the genome.
While we provide proof-of-concept for the applicability of the cf-RRBS assay, there are several limitations to our study. Building a classifier from public datasets from many different laboratories will result in batch and platform effects that will inevitably bias the results of this study. In addition, our current classifier is also limited to entities of whom public data are available. The public data available were generated with different strategies (array, RRBS, WGBS) potentially resulting in a suboptimal classifier. Ideally, a reference atlas of RRBS or WGBS data from a wide array of paediatric cancers and healthy children should be generated to further improve our classifier. Implementation into clinical trials or routine diagnostics will require additional adaptations to our method. In future validation studies, the inclusion of children without cancer will be necessary to calculate the specificity of the assay. Furthermore, in its current iteration, our assay has a theoretical turn-around-time of five working days which is too long for its use in real-time clinical decision-making.
In recent years, a number of alternatives to WGBS for cfDNA methylation profiling were developed. The Roche SeqCap Epi assay is a capture-based technique and is able to assess the methylation profile of cfDNA by enriching for CpG dense genomic areas. However, this technique has a lower cost-effectiveness compared to cf-RRBS, is difficult to implement in a routine clinical setting, and the protocol is cumbersome and time-consuming [Citation18]. Single-cell RRBS (scRRBS) has also been suggested as a cost-effective alternative to classical RRBS and WGBS for low-input samples but is more labour-intensive [Citation16]. More recently, cfMeDIP-seq [Citation38] was used to detect and classify adult cancers in an early stage. However, as this method is based on immunoprecipitation it has its own drawbacks [Citation39]. These techniques all cover different parts of the methylome, and the optimal technique for sensitive tumour detection remains yet to be demonstrated.
In conclusion, while a thorough prospective evaluation is required to delineate and establish the true value of the technique and its clinical application, this proof-of-concept study suggests a role for cf-RRBS as a cost-effective addition to the diagnostic toolbox in paediatric oncology.
Supplemental Material
Download Zip (33.9 MB)Acknowledgments
A.D.K and R.V.P were funded by a predoctoral fellowship from the Research Foundation Flanders (FWO). B.D.W. is a senior clinical investigator for the FWO. This project was partially funded by Kom op tegen Kanker, a CRIG (Cancer Research Institute Ghent) Young Investigator Proof-of-Concept grant, vzw Kinderkankerfonds - a non-profit childhood cancer foundation under Belgian law (grant to T.L), KickCancer, Liquidhope (a TranScan-2 project by Koningin Wilhelmina Fund, Dutch Cancer Society KWF TRANSCAN 8352/TRS-2018- 00000715), and by the VIB Grand Challenges Program (N.C. lab). We thank Lennart Raman for assistance with WisecondorX and Peter Stockwell for assistance with mkrrgenome. We thank the Center for Medical Genetics Ghent lab technicians for assistance with plasma preparation, cfDNA extraction, shallow WGS library preparation, and sequencing (Thalia Van Laethem, Eveline Vanden Eynde, Kimberly Verniers, Peter Degrave, Dimitri Broucke, Machteld Baetens, Aline Eggermont, Els De Smet). We thank Landric Vautmans for assistance with the FEMTO Pulse. In France, this study was supported by the Annenberg Foundation, the Association Hubert Gouin Enfance et Cancer, the Association Enfants et Santé, and the SiRIC programme (Site de Recherche Integrée sur le Cancer). This study makes use of data generated by dr. Junko Takita, Department of Pediatrics, The University of Tokyo, and The Chinese University of Hong Kong (CUHK) Circulating Acids Research Group, as reported by Chan KC in Proc Natl Acad Sci USA (19 November 2013;110(47):18761-8), the TARGET database, Gene Expression Omnibus (GEO) identifiers GSE89041, GSE97529, GSE90496, GSE107946, GSE90496, and ArrayExpress identifier E-MTAB-4187.
Disclosure statement
A.D.K and N.C. are listed as inventors in patent application PCT/EP2017/056850 related to the cf-RRBS method.
Code and data availability
Scripts and supporting files are available at https://github.com/rmvpaeme/cfRRBS_manuscript.
Raw data are available at EGA identifier EGAD00001005928. Processed data are available at ArrayExpress identifier E-MTAB-8770.
The cf-RRBS protocol is available at https://www.protocols.io/view/cf-rrbs-protocol-pc6dize.
Supplementary material
Supplemental data for this article can be accessed here.
Additional information
Funding
References
- Vujanić GM, Sandstedt B, Kelsey A, et al. Central pathology review in multicenter trials and studies. Cancer. 2009;115:1977–1983.
- Parkes S, Muir KR, Cameron AH, et al. The need for specialist review of pathology in paediatric cancer. Br J Cancer. 1997;75:1156–1159.
- Shamberger RC, Guthrie KA, Ritchey ML, et al. Surgery-related factors and local recurrence of Wilms tumor in National Wilms Tumor Study 4. Ann Surg. 1999;229:292–297.
- van den Heuvel-eibrink MM, Hol JA, Pritchard-Jones K, et al. Rationale for the treatment of Wilms tumour in the UMBRELLA SIOP–RTSG 2016 protocol. Nat Rev Urol. 2017;14:743–752.
- Kundaje A, Meuleman W, Ernst J, et al. Integrative analysis of 111 reference human epigenomes. Nature. 2015;518:317–330.
- Schultz MD, He Y, Whitaker JW, et al. Human body epigenome maps reveal noncanonical DNA methylation variation. Nature. 2015;523:212–216.
- Fernandez AF, Assenov Y, Martin-Subero JI, et al. A DNA methylation fingerprint of 1628 human samples. Genome Res. 2012;22(2):407–419.
- Kang S, Li Q, Chen Q, et al. CancerLocator: non-invasive cancer diagnosis and tissue-of-origin prediction using methylation profiles of cell-free DNA. Genome Biol. 2017;18(1):53.
- Hoadley KA, Yau C, Hinoue T, et al. Cell-of-origin patterns dominate the molecular classification of 10,000 tumors from 33 types of cancer. Cell. 2018;173(291–304.e6):291–304.e6.
- Koelsche C, Hartmann W, Schrimpf D, et al. Array-based DNA-methylation profiling in sarcomas with small blue round cell histology provides valuable diagnostic information. Mod Pathol. 2018;31(8):1246–1256.
- Sturm D, Orr B, Toprak U, et al. new brain tumor entities emerge from molecular classification of CNS-PNETs. Cell. 2016;164:1060–1072.
- Capper D, Jones DTW, Sill M, et al. DNA methylation-based classification of central nervous system tumours. Nature. 2018;555:469–474.
- Siravegna G, Marsoni S, Siena S, et al. Integrating liquid biopsies into the management of cancer. Nat Rev Clin Oncol. 2017;14(9):531–548.
- Van Paemel R, Vlug R, De Preter K, et al. The pitfalls and promise of liquid biopsies for diagnosing and treating solid tumors in children: a review. Eur J Pediatr. 2020;179(2):191–202.
- Moss J, Magenheim J, Neiman D, et al. Comprehensive human cell-type methylation atlas reveals origins of circulating cell-free DNA in health and disease. Nat Commun. 2018;9:5068.
- Guo S, Diep D, Plongthongkum N, et al. Identification of methylation haplotype blocks aids in deconvolution of heterogeneous tissue samples and tumor tissue-of-origin mapping from plasma DNA. Nat Genet. 2017;49:635–642.
- Meer A. Reduced representation bisulfite sequencing for comparative high-resolution DNA methylation analysis. Nucleic Acids Res. 2005;33:5868–5877.
- De Koker A, Van Paemel R, De Wilde B, et al. A versatile method for circulating cell-free DNA methylome profiling by reduced representation bisulfite sequencing. bioRxiv. 2019;663195. DOI:10.1101/663195.
- Andrews S. FastQC: a quality control tool for high throughput sequence data. 2010.
- Krueger F Trim Galore! 2012.
- Martin M. Cutadapt removes adapter sequences from high-throughput sequencing reads. EMBnet.journal. 2011;17:10.
- Krueger F, Andrews SR. Bismark: a flexible aligner and methylation caller for Bisulfite-Seq applications. Bioinformatics. 2011;27:1571–1572.
- Raman L, Dheedene A, De Smet M, et al. WisecondorX: improved copy number detection for routine shallow whole-genome sequencing. Nucleic Acids Res. 2019;47:1605–1614.
- Seki M, Nishimura R, Yoshida K, et al. Integrated genetic and epigenetic analysis defines novel molecular subgroups in rhabdomyosarcoma. Nature Communications. 2015;6(1):7557.
- Huertas-Martínez J, Court F, Rello-Varona S, et al. DNA methylation profiling identifies PTRF/Cavin-1 as a novel tumor suppressor in Ewing sarcoma when co-expressed with caveolin-1. Cancer Lett. 2017;386:196–207.
- Wu SP, Cooper, BT, Bu, F, et al. DNA methylation-based classifier for accurate molecular diagnosis of bone sarcomas. JCO Precis Oncol. 2017;2017.
- Pinto EM, Hamideh D, Bahrami A, et al. Malignant rhabdoid tumors originating within and outside the central nervous system are clinically and molecularly heterogeneous. Acta Neuropathol. 2018;136:315–326.
- Almstrup K, Lindhardt Johansen M, Busch AS, et al. Pubertal development in healthy children is mirrored by DNA methylation patterns in peripheral blood. Sci Rep. 2016;6(1):28657.
- Chan KCA, Jiang P, Chan CWM, et al. Noninvasive detection of cancer-associated genome-wide hypomethylation and copy number aberrations by plasma DNA bisulfite sequencing. Proc Natl Acad Sci U S A. 2013;110:18761–18768.
- Chatterjee A, Stockwell PA, Rodger EJ, et al. Comparison of alignment software for genome-wide bisulphite sequence data. Nucleic Acids Res. 2012;40:e79–e79.
- Quinlan AR, Hall IM. BEDTools: a flexible suite of utilities for comparing genomic features. Bioinformatics. 2010;26:841–842.
- Van Roy N, Van Der Linden M, Menten B, et al. Shallow whole genome sequencing on circulating cell-free DNA allows reliable noninvasive copy-number profiling in neuroblastoma patients. Clin Cancer Res. 2017;23(20):6305–6314.
- Klega K, Imamovic-Tuco, A, Ha, G, et al. Detection of somatic structural variants enables quantification and characterization of circulating tumor DNA in children with solid tumors. JCO Precis Oncol. 2018;1–13. DOI:10.1200/PO.17.00285.
- Chicard M, Colmet-Daage L, Clement N, et al. Whole-exome sequencing of cell-free DNA reveals temporo-spatial heterogeneity and identifies treatment-resistant clones in neuroblastoma. Clin Cancer Res. 2018;24:939–949.
- Gröbner SN, Worst BC, Weischenfeldt J, et al. The landscape of genomic alterations across childhood cancers. Nature. 2018;555:321–327.
- Klein EA, Hubbell E, Maddala T, et al. ASCO abstract 12021: development of a comprehensive cell-free DNA (cfDNA) assay for early detection of multiple tumor types: the Circulating Cell-free Genome Atlas (CCGA) study. J Clin Oncol (suppl; abstr 12021). 2018. DOI:10.1200/JCO.2018.36.15_suppl.12021.
- Choudhury AD, Werner L, Francini E, et al. Tumor fraction in cell-free DNA as a biomarker in prostate cancer. JCI Insight. 2018;3. DOI:10.1172/jci.insight.122109.
- Shen SY, Singhania R, Fehringer G, et al. Sensitive tumour detection and classification using plasma cell-free DNA methylomes. Nature. 2018;563:579–583.
- Lentini A, Lagerwall C, Vikingsson S, et al. A reassessment of DNA-immunoprecipitation-based genomic profiling. Nat Methods. 2018;15:499–504.