
ABSTRACT
Decitabine (5-aza-2ʹdeoxycytidine; DAC) is a DNA methyltransferase inhibitor used to hypomethylate the epigenome. Current dosing regimens of DAC for use in mice vary widely and their hypomethylating ability has not been robustly characterized, despite reliable results of hypomethylation of the epigenome with cell lines in vitro and tissue specificity in vivo. We investigated the effects on the DNA methylome and gene expression within mice exposed to chronic low doses of DAC ranging from 0 to 0.35 mg/kg over a period of 7 weeks without causing toxicity. Our dose paradigm resulted in no cytotoxic effects within target tissues, although testes weight and sperm concentration significantly reduced as dose increased (p-value <0.05). By whole genome bisulphite sequencing (WGBS), we identify tissue and dose-specific differentially methylated CpGs (DMCs) and regions (DMRs) in testes and liver. Testes methylation is more sensitive to DAC exposure when compared to liver, cortex, and hippocampus. Gene expression was dysregulated in testes and liver, targeting non-specific pathways as dose increases. Together our data suggest DNA methylation and gene expression are disrupted by in vivo DAC treatment in a non-uniform manner contrary to expectations, and that no dose level or regimen is sufficient to cause systemic hypomethylation in whole mice.
Introduction
Decitabine (DAC) is an azanucleoside pharmaceutical agent primarily used to treat diseases such as acute myeloid leukaemia via epigenetic mechanisms [Citation1–3]. Beyond its clinical application, DAC is used as a DNA methyltransferase (DNMT) inhibitor for in vitro and in vivo studies, resulting in hypomethylated DNA [Citation4–6]. The mechanism is as follows: DNMT1 recognizes hemimethylated DNA during DNA replication then methylates opposite strand palindromic cytosines in CpG dinucleotides on the newly synthesized strand of DNA [Citation6,Citation7]. Once DAC is incorporated into DNA during replication, its presence inhibits the catalytic binding domain of DNMTs by covalent bonding causing irreversible competitive inhibition, upon which the bound DNMT1 is ubiquitinated and signalled for degradation by proteasomes leaving an abasic site subsequently repaired with an unmethylated cytosine [Citation8–10]. The resulting CpG site is left unmethylated on both strands and thus, DNA methylation is lost through passive demethylation during subsequent cell division.
DAC as a hypomethylating agent is widely used in tissue culture and in animal models to understand the function of DNA methylation within a specific locus or biological pathways [Citation11–13]. One of the earliest in vivo applications of azanucleoside used azacytidine to reactivate silent genes within multiple somatic tissues [Citation14]. After a single exposure in mice, transcription of endogenous defective proviral genes was induced within the liver and spleen tissues, but not brain tissue. Azacytidine primarily incorporates into RNA with only a small portion, ~10%, interconverting to the deoxy form and integrating into DNA. The use of DAC bypasses this interconversion for greater DNA specificity. More recent studies continue to use DAC to reactivate tumour suppressor genes [Citation15,Citation16] and induce hypomethylation within xenografts [Citation17] or other somatic tissues [Citation18–21]. Studies using DAC to investigate biological properties within in vitro models are being validated in vivo for translational applications. For example, use of DAC in both in vitro and in vivo models identified the role of prostaglandin E2 as an inducer of DNA methylation in gastric carcinogenesis [Citation22]. However, misguided dose and exposure protocols can lead to cytotoxicity within the model system or off-target effects influenced by DAC exposure. Therefore, there is a need to characterize the dose schedule to optimally induce hypomethylation in vivo without cytotoxicity.
Hypomethylation by DAC exposure is dependent on dosing and frequency. It has been shown that higher exposure to DAC increases incorporation to the DNA, thus increasing the probability of DNMT degradation [Citation23]. However, higher doses of DAC for prolonged durations increase the susceptibility to cytotoxicity [Citation24]. The toxicological effects of DAC within mice targets the haematological, myeloid, lymphoid, and gastrointestinal systems, causing leucopenia and anaemia, thymic and testicular atrophy, and necrosis of intestinal mucosa coupled with weight loss [Citation25,Citation26]. To prevent cytotoxicity while achieving hypomethylation in a whole animal model, low-dose exposure for long durations is shown to decrease DNA methylation, but it is unclear if DAC exposure has tissue specify or genomic preference for targeted hypomethylation [Citation21,Citation27]. However, the link between the optimal dose of DAC exposure in a whole animal model to induce epigenetic changes without causing cytotoxicity has yet to be identified. Moreover, the effects of DAC on the complete DNA methylome have not been characterized at the base-pair level.
In this study, we used a mouse model for chronic, low-dose decitabine exposure to characterize epigenome-wide changes on DNA methylation. We characterize changes in genome-wide DNA methylation via whole genome bisulphite sequencing (WGBS) and the transcriptome via RNA-sequencing in mice exposed to a low range of DAC (0.05–0.35 mg/kg) for a period of 7 weeks.
Material and methods
Animals
Mice in this study were maintained in accordance with the Guidelines for the Care and Use of Laboratory Animals (Institute of Laboratory Animal Resources, 1996) and were treated humanely and with regard for alleviation of suffering. The study protocol was approved by the University of Minnesota Institutional Animal Care and Use Committee (IACUC). Mice used in this study were obtained from an agouti viable yellow (Avy) colony, maintained for over 220 generations, with 93% similarity to C57BL/6 J [Citation28]. Both agouti carriers (Avy/a) and wild type (a/a) mice from this strain were used. Wild type male mice (n = 29) were 6–8 weeks of age before the start of DAC exposure. Male and female Avy/a mice (n = 15) were 6–8 weeks of age, ranging in coat colour from pseudoagouti to yellow phenotype at the start of DAC exposure. All animals were group housed based on treatment and sex. Mice were maintained on a 12:12 light/dark cycle and had ad libitum access to the standard lab diet Envigo 2018 (18% protein) chow and water.
Decitabine exposure paradigm
Pharmaceutical grade DAC was purchased at the University of Minnesota Boynton Health Pharmacy (Minneapolis, MN). DAC was resuspended then diluted to 0.1 mg/mL concentration in saline. DAC was stored at -80 and thawed on ice before administering. Following a previous reported exposure paradigm, mice were administered doses between 0.0 mg/kg – 0.35 mg/kg, three times a week by intraperitoneal (i.p.) injection for 7 weeks [Citation19]. A subset of mice was given higher doses ranging from 0.5 mg to 5 mg/kg with doses given every other day for 1–3 weeks to determine cytotoxicity via histology. Blood was collected via saphenous vein at week 0, week 4, and week 7. Avy/a mice were imaged weekly during the 7 week exposure. After 7 weeks of exposure, mice underwent a 48-hour washout period and a/a animals were euthanized. Testes and kidney tissues were weighed, while all other somatic tissues were snap frozen, and stored at -80°C until further processing. Avy/a animals were imaged monthly until 37 weeks of age to track changes in coat colour post-exposure.
Bone marrow and spleen histology
Sternum (bone marrow) and spleen from a/a animals were isolated after euthanasia and fixed in 10% formalin for 48 hours before histology preparation. Samples were sent to the Veterinary Clinical Pathology Laboratory at the University of Minnesota for evaluation of cytotoxicity. Paraffin sections were processed for haematoxylin and eosin (H&E) staining, and microscopic findings were reported at 10x (spleen) and 20x (bone marrow).
Sperm isolation
Spermatozoa were isolated from the epididymides of a/a mice. (doses 0.0, 0.05, 0.15, and 0.35 mg/kg) and suspended in 10% PBS and incubated at 37°C for 30 min. Briefly, sperm and somatic cells were separated and purified by repetitive wash, centrifugation, and incubation for three cycles. Sperm concentration was measured by visual count in triplicate field view using a standard compound microscope at 40x magnification.
DNA and RNA isolations
Total genomic DNA (gDNA) from blood and snap frozen tissues was isolated from each a/a animal using the DNeasy Blood and tissue kit following the manufacturer’s protocol (Qiagen, Hilden, Germany). DNA yield was determined by using a NanoPhotomer N50 system. After isolation, gDNA was bisulphite converted using the EZ DNA methylation-lightning Kit (Zymo Research, Irvine, CA). Briefly, to detect methylated cytosines in genomic DNA (gDNA), DNA is treated with sodium bisulphite and then sequenced. Unmethylated cytosines are deaminated to uracils during the bisulphite treatment, and are read as thymidine by polymerases during sequencing.
All primers were designed using Qiagen Pyromark Assay Design software version 2.0 (primer information located in supplementary table 1). Each primer set was designed to contain a biotinylated reverse primer and forward primer flanking the sequence of interest. PCR amplification of bisulphite converted genomic DNA was performed in a 30 μl solution using HotStarTaq master mix (Qiagen), forward primer, reverse primer. Amplicons were analysed and confirmed using automated capillary electrophoresis on the Qiaxcel Advanced System (Qiagen). Amplicons were pyrosequenced on a PyroMark ID 96 instrument (Qiagen). All plates included a 0% and 100% methylated bisulphite converted control along with a no DNA template control.
Total RNA was extracted from snap frozen a/a tissues using RNeasy plus Mini Kit following the manufacturer’s protocol (Qiagen). RNA was quantified using a NanoPhotomer N50 system and quality tested using the QIAxcel Advanced Instrument to confirm a RIN score >7 before cDNA conversion. Total RNA was reverse transcribed to cDNA using the Quantiscript Reverse Transcription kit (Qiagen). Gene expression from resulting cDNA was measured by qPCR on the Applied Biosystems in both technical and biological replicates using the Taqman Gene Expression Master Mix (Applied Biosystems) with preoptimized Taqman probes to genes of interest (primer information located in supplementary table 2). Gene expression was normalized to housekeeping gene RPL41 and β-actin expression as fold change compared to 0.0 mg/kg treatment samples, using the 2-Delta Delta CT method.
RNA-sequencing and pathway analysis
Bioinformatics pipelines are outlined in similar to prior designs [Citation29]. RNA-sequencing (RNA-seq) was performed at the University of Minnesota Genomics Core. RNA libraries were created using an 18 dual-indexed Illumina TruSeq Prep kit (Illumina). All libraries were combined into a single pool and sequenced across two lanes of a HiSeq 2500 HO 2x50-bp run. This generated >220 M reads for each lane. All expected barcodes were detected and well represented, with mean quality scores of >Q30. Data was sent to the University of Minnesota Informatics Institute for genomics analysis. Quality of data in fastq files was assessed using FastQC [Citation30]. Low quality bases and adapter sequences were removed using Trimmomatic [Citation31]. Reads were aligned using Hisat2 [Citation32]. FPKM expression values were generated using Cuffquant and Cuffnorm from the Cufflinks package [Citation33], and raw read counts were generated using featureCounts from the subread R package [Citation34]. All paired raw fasq.gz reads from RNA-seq were uploaded to the Sequence Read Archive (SRA) under BioProject: PRJNA608917.
Figure 1. Whole Genome Bisulphite Sequencing (WGBS) and RNA-seq Bioinformatics Pipeline WGBS and RNA-seq pipelines were processed separately. The goal of the pipelines was to identify differentially methylated CpG sites or regions and to categorize affected pathways by Decitabine exposure. Linux command line, R studio, and Ingenuity Pathway Analysis by Qiagen were used for data analysis
Differential expression analysis
Differential expression for each of four total pairwise comparisons (control vs. 0.15 mg/kg DAC and control vs. 0.35 mg/kg DAC for both liver and testes) was determined based on a negative binomial generalized linear model with quasi-likelihood tests in the edgeR Bioconductor package [Citation35] (version 3.26.8). The p-values were adjusted by using the Benjamini-Hochberg false discovery rate (FDR) approach with an FDR < 0.05 and twofold cut-offs used to determine significance. Network and pathway analysis were performed for differentially regulated genes using Ingenuity Pathway Analysis (IPA; Qiagen). The full set of significantly dysregulated genes were uploaded to IPA for liver while the testes gene sets were trimmed to exclude genes with FDR-corrected p-value < 0.01 in order to meet the program‘s recommended maximum upload size. Separate core analyses were run for each dose using the following settings: stringent filtering, all data sources and node types, direct and indirect relations, experimentally observed confidence, twofold cut-offs, and FDR-corrected p-values < 0.05 (liver) or < 0.01 (testes).
Whole genome bisulphite sequencing
Genome-wide DNA methylation levels were measured using whole genome bisulphite sequencing (WGBS) at the University of Michigan Epigenomics Core (Ann Arbour, MI) [Citation36]. gDNA was quantitated using the Qubit broad range dsDNA kit. Quality was assessed with Agilent’s genomic DNA 2200 TapeStation kit. All samples provided were of high quality. A total of 200 ng was used for each WGBS library preparation. Each sample was spiked-in with 0.5% (w/w) of unmethylated Lambda DNA prior to library preparation, according to the ENCODE consortium’s guidelines. DNA was fragmented to a 300 bp peak on a Covaris S220 focused-ultrasonicator system. The samples were processed for end-repair and A-tailing, before proceeding to the ligation NEB’s methylated adaptor at 16°C overnight. The ligation products were incubated with the USER enzyme at 37°C for 15 minutes before cleaning with two rounds of AMPure XP beads. The ligated products were submitted to bisulphite treatment using Zymo Research’s EZ DNA Methylation kit (Zymo Research), with the following protocol: 55 cycles of 95°C for 30 sec, 55°C for 15 minutes. Samples were kept at 4°C until cleanup. Final library amplification was done using the Roche FastStart Hi-fidelity DNA polymerase system and NEB’s dual indexing primers. A total of 10 cycles of amplification were used. The PCR products were cleaned with AMPure XP beads, and the final libraries were quantitated using the Qubit High Sensitivity dsDNA kit. Quality of the libraries was assessed on Agilent’s 2200 TapeStation, using the High Sensitivity D1000 kit. Libraries were quantified using the KAPA Library quantitation kit and pooled for sequencing on a S4 flowcell, 200 cycles (PE-100) of a NovaSeq6000.
Linux command line tools and Rstudio open-source software (version 3.6.1) tools were used for WGBS analysis. FastQC (version 11.3) was used to assess the overall quality of the sequenced samples, and TrimGalore [Citation37] (version 4.5) was used to trim low-quality bases (quality score lower than 20), adapter sequence (required an overlap of 6bps), and end-repair bases from the 3ʹ end of reads. Bismark [Citation38] (version 19.0) was used for alignment and methylation calling. Reads were aligned to the mouse reference genome (mm10) using Bowtie2 [Citation39] (version 2.3.4) with default parameter settings. Methylation calls were reported for all nucleotides with a read depth of at least 5. All paired raw fasq.gz reads from WGBS were uploaded to the Sequence Read Archive (SRA) under BioProject: PRJNA603069.
Differential methylation analysis
The DSS R package (version 2.32.0) was used to test WGBS data for differential methylation for the 0.15 mg/kg and 0.35 mg/kg DAC exposures compared pairwise to the 0.0 mg/kg control treatment group [Citation40]. The DMLtest function in DSS was used to identify differentially methylated CpGs (DMCs). Smoothing parameters were set to true and the p-value threshold was set to 0.001. To test for differentially methylated regions (DMRs), we used the callDMR function in DSS. The p-value threshold was set to 0.001. The annotatr R package (version 1.10.0) was used to annotate DMCs and DMRs to the mm10 genome [Citation41]. The function annotate_regions was used to annotate the abundance of differentially methylated regions within CpG and Genic regions. The plot_annotation and plot_categorical functions were used to generate figures in annotatr.
Results
Toxicity in doses greater than 0.35 mg/kg
Frequency of DAC exposure between 5 days – 3 weeks with higher doses ranging from 0.5 to 5 mg/kg caused weight loss, cytotoxic effects, and rapid mortality (Sup. ). Tissues from the whole animal were sent for pathology to determine toxic effects on all tissues. In doses of 1 mg/kg, no significant findings were reported for tissues such as heart, lung, liver, and intestines. Consistent with other studies, bone marrow and spleen histology, and whole body weight were indicative of cytotoxicity [Citation4,Citation25,Citation42]. For these reasons, we pursued lower dose chronic treatments.
Physiological effects in doses 0.35 mg/kg or less
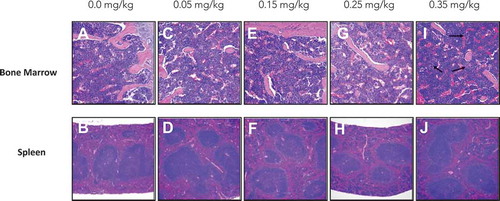
To assess cytotoxicity of DAC exposure, we measured weekly weight along with histology of bone marrow and spleen after a 7-week exposure of DAC ranging from 0.05 to 0.35 mg/kg. Lower doses in increments of 0.1 mg/kg of DAC were given 3 times per week for 7 weeks and showed no significant differences in body weight or weight loss after chronic treatment (). Pathology of bone marrow and spleen indicates no significant findings from dose ranges 0–0.25 mg/kg ((AH)). Bone marrow and spleen of mice exposed to 0.35 mg/kg of DAC show early signs of toxicity. Histology indicates moderate increment in the erythroid to myeloid ratio with emperipolesis, a normal process within bone marrow and does not indicate pathology ().
Figure 2. Weekly body weight measurements. Weekly body weight was measured to assess acute toxicity. No significant changes in body weight were observed within individuals or between treatment groups
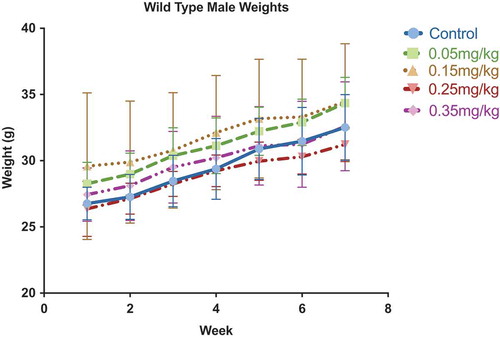
Figure 3. bone marrow and spleen histology analysis of both sternum bone marrow and spleen showed no signs of toxicity in groups 0.0–0.25 mg/kg. Bone marrow from 0.35 mg/kg mice shows moderate increments in the erythroid to myeloid ratio with emperiopolesis present, indicated with black arrows (i). (a) Bone Marrow 0.0 mg/kg treatment. (b) Spleen 0.0 mg/kg treatment. (c) Bone Marrow 0.05 mg/kg treatment. (d) Spleen 0.05 mg/kg treatment. (e) Bone Marrow 0.15 mg/kg treatment. (f) Spleen 0.15 mg/kg treatment. (g) Bone Marrow 0.25 mg/kg treatment. (h) Spleen 0.25 mg/kg treatment. (I) Bone Marrow 0.35 mg/kg treatment. (j) Spleen 0.35 mg/kg treatment. All bone marrow fields are H&E 20X magnification and all spleen fields are H&E 10X magnification
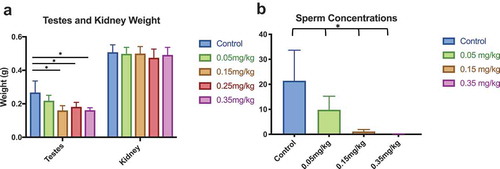
Testes and sperm concentration are sensitive to increased DAC concentration [Citation19,Citation43]. Similar to previous reports, we find decreased testes weight is coupled with lower sperm concentration in a dose-dependent manner ()) [Citation14,Citation19]. Testes weight between the control and 0.15, 0.25, 0.35 mg/kg experimental groups were significantly lower (ANOVA with Tukey’s multiple comparison test, p-value < 0.05), although no weight differences were present between the control and 0.05 mg/kg treatment group (one-way ANOVA). Testes weight between treatments (0.15, 0.25, and 0.35 mg/kg) were not significantly different. Kidney weight was measured to illustrate tissue-specific effects of DAC on tissue type and no significant differences were found. Sperm concentration was quantified by scoring multiple field views using a compound microscope. Concentration varied between individuals, but a consistent decrease was observed as DAC concentration increased as compared to control (p-value<0.05) ()).
Figure 4. Testes Weight and Sperm Concentration Lower testes weight is coupled with decreased sperm concentration as DAC dose intensifies. (a) Testes weight was significantly affected between control and all doses. (b) Sperm concentration decreased as decitabine dose increased. Single stars indicate p-values<0.05, when compared to controls. Bars represent standard error. Sperm concentration is based off individual sperm count within a 40x magnification field view
Whole genome bisulphite sequencing of differentially methylated cytosines
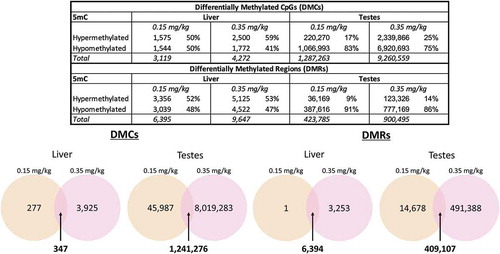
To identify differential DNA methylation between tissues and DAC treatment, we analysed both liver and testes tissue for following doses: control (0.0 mg/kg), most commonly reported dose in the literature (0.15 mg/kg), and the highest dose in our exposure paradigm with early signs of toxicity (0.35 mg/kg). Testes was chosen for analysis due to its previous reports of sensitivity to hypomethylation (citation). Further, we chose liver as it is the site of metabolic function, and synthesis of small molecules and toxins. We found a total of 3,119 differentially methylated cytosines (DMCs) within the 0.15 mg/kg liver and 4,262 DMCs within the 0.35 mg/kg liver DAC treatment (). In liver, both dose levels resulted in bias towards hypermethylation DMCs (0.15 mg/kg n = 1,575; 50.5%; 0.35 mg/kg n = 2,500; 58.5%) than hypomethylated DMCs (0.15 mg/kg n = 1,544; 49.5%; 0.35 mg/kg n = 1,772; 41.4%), suggesting DAC exposure paradoxically increases methylation within liver tissue. Meanwhile, in testes we identified a far greater number of DMCs, 1,287,263 within the 0.15 mg/kg and 9,260,559 DMCs within the 0.35 mg/kg treatments. Here as expected, within both testes doses, more DMCs were hypomethylated (0.15 mg/kg n = 1,066,993; 82.8%; 0.35 mg/kg n = 6,920,693; 74.7%) than hypermethylated (0.15 mg/kg n = 220,270; 17.1%; 0.35 mg/kg n = 2,339,866; 25.2%). Our findings suggest testes is more sensitive to altered methylation in CpG sites and that these sites are preferentially hypomethylated when compared to liver.
Figure 5. Differential methylation across DAC dose and tissue identified from WGBS data liver and testes tissues at doses 0.0, 0.15, and 0.35 mg/kg were assessed for differential DNA methylation by decitabine exposure using WGBS data. Differential methylation was identified by using the 2-group Wald test model in the DSS R package. Overlap of DMCs and DMRs were identified in both liver and testes samples using Linux (UNIX)
Whole genome bisulphite sequencing of differentially methylated regions
We identified differentially methylated regions (DMRs) between both tissue types (testes and liver) and treatments of DAC exposure (doses 0.15 mg/kg and 0.35 mg/kg) (). Similar to our DMC analysis, we identified more DMRs within testes (0.15 mg/kg n = 423,785; 0.35 mg/kg n = 900,495) compared to liver (0.15 mg/kg n = 6,395; 0.35 mg/kg n = 9,647). DMRs within liver had a slightly greater number hypermethylated regions (0.15 mg/kg n = 3,356; 52.5%; 0.35 mg/kg n = 5,125; 53.1%) than hypomethylated regions (0.15 mg/kg n = 3,039; 47.5%; 0.35 mg/kg n = 4,522; 46.9%), contradictory to our working hypothesis. We found testes had a stronger bias towards hypomethylated regions (0.15 mg/kg n = 387,616; 91.5%; 0.35 mg/kg n = 777,169; 86.3%) than hypermethylated regions (0.15 mg/kg n = 36,169; 8.5%; 0.35 mg/kg n = 123,326; 13.7%).
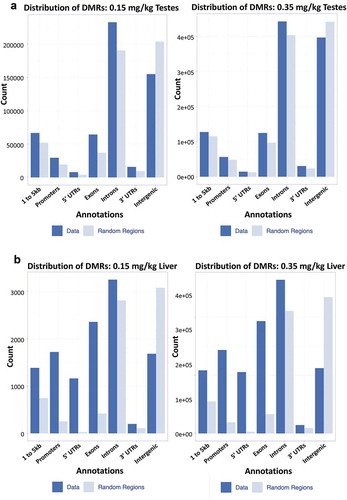
We investigated whether differentially methylated regions were targeted to specific genomic locations or were random across the genome. Within testes, DMRs appear to be randomly distributed in both genic () and CpG regions (Sup.) for both 0.15 and 0.35 mg/kg doses. In contrast, liver DMRs appear to be site specific in both genic () and CpG regions (Sup. ) for both doses. Examining the genic regions in more detail finds that testes gives a uniform expected distribution of the DMRs in genic proximal regions ()). Within liver genic regions, bias in DMR location is evident, the 1 to 5kb regions, promotors, 5ʹ UTRs, and exons deviate most from random distribution whereas to 3ʹ UTRs and intergenic regions are most similar to expected values.
Figure 6. Annotated genic regions in liver and testes distribution of DMRs within (a) genic regions of 0.15 and 0.35 mg/kg testes, (b) 0.15 and 0.35 mg/kg liver. Annotated data is plotted against a randomized set of regions
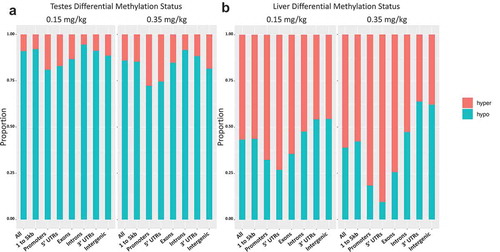
Comparing the relative methylation status of DMRs revealed proportional bias in the hypo/hypermethylation of genic regions. DMRs within the 0.15 mg/kg testes had proportionally more hypomethylation when compared to 0.35 mg/kg group, yet both groups were predominately hypomethylated overall ()). In liver, dose 0.15 mg/kg had higher proportions of hypomethylated DMRs compared to 0.35 mg/kg DMRs ()). However, differential methylation in liver was more hypermethylated in both doses when compared to testes. Introns and intergenic regions, regions of noncoding DNA that make up >40% of the genome, and 3ʹUTRs were consistently more hypomethylated between the 0.15 and 0.35 doses in testes and liver. Shorter genomic sequences like exons, 1 to 5kb regions, promoters, and 5ʹUTRs were less affected by DAC induced hypomethylation.
Figure 7. Differential methylation of liver and testes by DAC exposure proportional hypo- and hypermethylated regions within 0.15 and 0.35 mg/kg in testes, 0.15 and 0.35 mg/kg in liver
Gene-specific and transposon DNA methylation by pyrosequencing
DAC exposure is shown to decrease methylation both globally and site specifically [Citation18,Citation44,Citation45]. Therefore, we investigated the methylation status of mouse LINE and IAP transposon elements as a proxy for global DNA methylation. We also identified the methylation status of the imprinted gene Igf2, as it is frequently seen to be labile in methylation [Citation45–47], and transcription binding factor Tcf3, a robustly modulated gene by DAC exposure [Citation44].
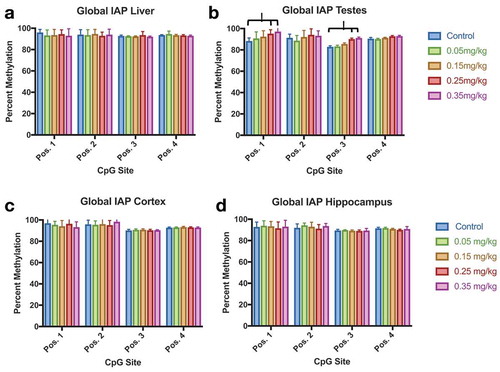
Tissue methylation profiles were collected for liver, cortex, hippocampus, and testes by pyrosequencing. Mouse LINE methylation was altered by DAC exposure within liver and testes, but not cortex or hippocampus (). Liver methylation significantly increased (position 1) by 0.35 mg/kg exposure, and decreased (position 4) within the dose range of 0.15–0.35 mg/kg (p-value <0.05). Testes methylation also increased at higher doses (0.25, 0.35 mg/kg), in all CpG positions of LINE (p-value <0.05). Similar results are seen in IAP methylation (). Liver, cortex, and hippocampus IAP methylation were not affected by DAC exposure. Methylation significantly increased within testes (positions 1 and 3) at doses 0.25 and 0.35 mg/kg of DAC (p-value <0.05). Azanucleosides have been used in mice to induce the reactivation of silenced genes such as LINE and IAP elements [Citation14,Citation48,Citation49]. We investigated whether exposure to DAC could hypomethylate differentially methylated regions such as the Avy locus in the agouti mouse model. We scored the fur coat colour of Avy mice as a proxy for quantitative DNA demethylation at week 0, and 37 weeks post-exposure (Sup. ). No changes in fur coat colour were identified 37 weeks post-exposure.
Figure 8. Mouse LINE (mLINE) DNA Methylation in Liver, Testes, Cortex, and Hippocampus Effect of DAC exposure on mLINE methylation. (a) Liver. (b) Testes. (c) Cortex. (d) Hippocampus. mLINE methylation increases with higher DAC exposure in Testes, and partially increases within Liver tissue. Lower methylation induced by DAC exposure is only found in position 4 of liver tissue. Single stars indicate p-values<0.05, when compared to controls. Error bars indicate standard error
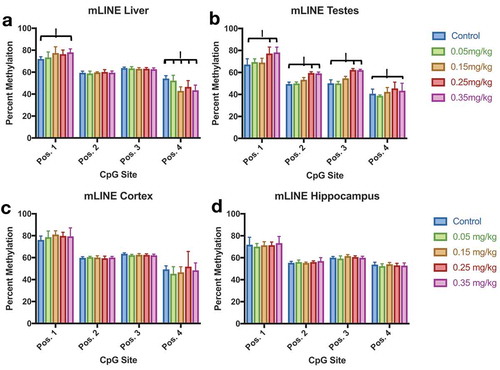
Figure 9. IAP DNA Methylation Effect of DAC exposure on Global IAP methylation. (a) Liver. (b) Testes. (c) Cortex. (d) Hippocampus. Testes methylation increases at CpG position 1 and position 3 in groups 0.25 mg/kg and 0.35 mg/kg, but not within lower doses of DAC exposure. Single stars indicate p-values<0.05, when compared to controls. Error bars indicate standard error
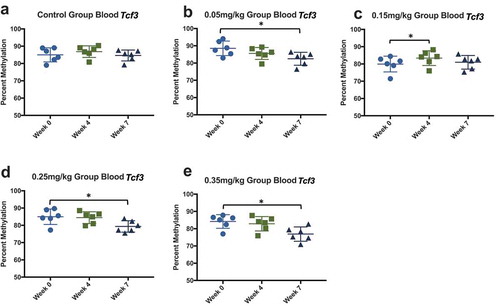
Similar to previous studies using mouse and cell models [Citation45]Citation47, our findings show a decrease in Igf2 methylation (). Liver methylation decreased at the 0.35 mg/kg dose (position 7), and unexpectedly increased at the 0.15 mg/kg dose (position 8). Testes methylation consistently decreased within all positions of Igf2, most prominently in the 0.25 and 0.35 mg/kg doses. Cortex was not affected by DAC exposure. Methylation at Tcf3 was also tissue specific (), and was consistent with previous studies [Citation44]. Testes Tcf3 methylation inconsistently decreased at varying doses (position 1, 2, 3, 4). Blood methylation of Tcf3 was collected at multiple timepoints (week 0, 4, 7) to identify if tissue methylation was as responsive as blood methylation (). Methylation decreased from week 0 to week 7 within doses 0.05, 0.25, and 0.35 mg/kg. Blood methylation within the 0.15 mg/kg group significantly increased during week 4, and was not significantly different at week 7.
Figure 10. Igf2 DNA methylation in liver, testes, and cortex effects of DAC exposure on Igf2 locus methylation. (a) Liver. (b) Testes. (c) Cortex. Igf2 methylation significantly decreased within testes at all CpG positions, whereas liver is only slightly affected by different doses within two positions. Single stars indicate p-values<0.05, when compared to controls. Error bars indicate standard error
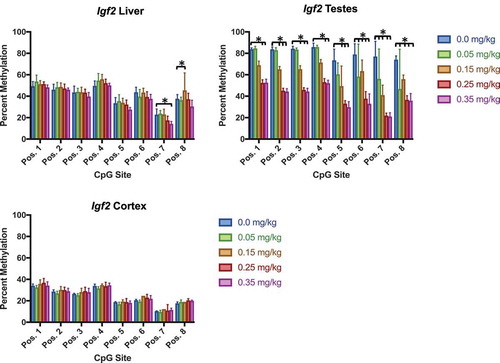
Figure 11. Tcf3 methylation in liver, testes, cortex, and hippocampus effect of DAC exposure on CpG site methylation within Tcf3. (a) Liver. (b) Testes. (c) Cortex. (d) Hippocampus. DAC exposure induces dose-specific hypomethylation within Testes, but is not present in liver, cortex, or hippocampus. Single stars indicate p-values<0.05, when compared to controls. Error bars indicate standard error
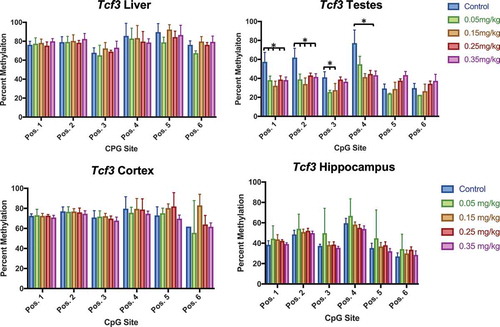
Figure 12. Blood DNA methylation at three time points effect of DAC exposure on Tcf3 blood methylation. Blood was collected before dosing (week 0), mid-way through exposure (week 4), and at the time of death (week 7). (a) 0.0 mg/kg dose. (b) 0.05 mg/kg dose. (c) 0.15 mg/kg dose. (d) 0.25 mg/kg dose. (e) 0.35 mg/kg dose
RNA transcript clustering and IPA analysis
RNA transcripts from liver and testes tissue (0.0 mg/kg, 0.15 mg/kg, and 0.35 mg/kg) were sequenced to understand if DAC exposure targets specific pathways. Sample clustering of both liver and testes by MDS Plot (Sup. ) and sample clustering heatmap of the top 500 genes with the highest variance (Sup. ) indicated the functional similarity between RNA transcriptomes. Liver transcripts from all doses had the most expression similarity as indicated by dense clustering overall whereas testes treatments had greater dissimilarity among doses. Testes transcripts clustered by dose, where 0.15 mg/kg had the most similarity to control with minimal to no overlap. Testes 0.35 mg/kg transcripts diverged away from control and 0.15 mg/kg in a less condensed pattern. No similarities were identified between liver and testes samples.
To understand the effect of DAC on canonical pathways, diseases and biological functions between different tissues, we analysed testes and liver tissues from doses 0.0, 0.15, and 0.35 mg/kg (n = 3) using Ingenuity Pathway Analysis (IPA) (, Sup. ). Following FDR correction, a third to a half of all genes were found to be dysregulated in testes with chronic DAC exposure: 6,599 and 11,911 genes were differentially expressed at 0.15 mg/kg and 0.35 mg/kg DAC, respectively. A slightly larger number of genes were upregulated than downregulated in testes with 3,951 exhibiting increased expression and 2,648 showing decreased expression at the lower dose. Contrary to expectations from the DMR analysis which showed strong bias towards hypomethylation, at the higher dose, about half (6,088) genes were upregulated as were downregulated (5,824). Top canonical pathways identified by IPA in testes were Axonal Guidance Signalling (p = 2.17 x 10−[Citation8]), p53 Signalling (p = 3.35 x 10−[Citation8]), and Molecular Mechanisms of Cancer (3.77 x 10−[Citation8]). Top disease and functional pathways were associated with cancer, cell death and survival, and organismal survival consistent with the large number of dysregulated genes and grossly abnormal size and appearance of the tissue in DAC-treated animals.
Table 1. Differential gene expression in liver and testes. Higher doses of DAC induced greater dysregulation of gene expression. Testes had greater dysregulation of gene expression in both 0.15 and 0.35 mg/kg doses, while liver had tighter regulation of dysregulation in both doses. (n = 3 per treatment)
Expression changes were identified for a lower but more tightly functionally associated total number of genes in the liver, with just 154 and 634 genes being significantly differentially expressed at the 0.15 mg/kg and 0.35 mg/kg doses, respectively. Most genes in liver exhibited increased expression, with 129 upregulated and 25 downregulated genes at 0.15 mg/kg DAC and 434 upregulated and 200 downregulated genes at 0.35 mg/kg DAC. In liver, the top represented canonical pathways given by IPA were Hereditary Breast Cancer Signalling (p = 5.80 x 10⁻⁷), AMPK Signalling (2.58 x 10–05), and Glucocorticoid Receptor Signalling (p = 4.57 x 10⁻⁵).
Tissue-specific Dnmt3l mRNA reduction
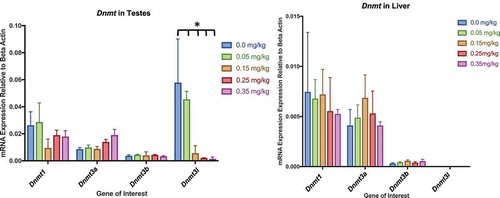
Hypomethylation by DAC exposure occurs by inactivation of DNMTs, resulting in passive demethylation [Citation50]. Therefore, we investigated the mRNA expression of three functional DNA methyltransferase enzymes (Dnmt1, Dnmt3a, Dnmt3b) and a catalytically inactive DNA methyltransferase (Dnmt3 l) within liver and testes (). We found no significant difference in mRNA expression within the functional Dnmts (Dnmt1, Dnmt3a, Dnmt3b) in both liver and testes. Dnmt3 l mRNA expression significantly decreased as dose increased within testes, but not liver (p-value <0.05).
Figure 13. Dnmt Expression in Testes and Liver Assessment of Dnmt1, 3a, 3b, and 3 l by qPCR in testes and liver. (a) Dnmt expression within testes. No significant differences within Dnmt1, Dnmt3a, or Dnmt3b. Dnmt3 l gene expression significantly decreased in response to DAC dose within testes. (b) Dnmt expression in liver had no significant differences between dosing treatments and control. Bars represent the mean and standard deviation from three biological replicates. Single stars indicate p-values<0.05, when compared to controls
Discussion
The current study reveals the tissue specificity of in vivo, chronic DAC treatment on multi-tissue DNA methylation. Chronic low-dose in vivo treatment with DAC in the 0.05–0.35 mg/kg range did not induce gross physiological toxic side effects seen in doses greater than 0.35 mg/kg. Our findings indicate testes is more sensitive to alterations in methylation and dysregulation of gene expression when compared to liver.
Our physiological measurements on weight, bone marrow, and spleen indicate our dose regimen did not induce significant toxic effects on the mice in these tissues (). However, the drop in testes weight and sperm concentration indicate doses exceeding 0.15 mg/kg may alter reproductive function ()). Testes weight and sperm concentration significantly decreased in weight and concentration from control. Between treatments, 0.05 mg/kg was significantly different from 0.15, 0.25, and 0.35 mg/kg. The lack of significance between 0.15 and 0.35 mg/kg doses indicated similar physiological effects, potentially limiting discrepancies of cell heterogeneity caused by toxicity. Our results are consistent with other studies, where testes weight is coupled with sperm quality after DAC treatment [Citation19].
We established our definition of low, chronic exposure to DAC after high dose trials indicated rapid body weight loss and gross physiological indications of toxicity (Sup. Figure S1 and S2). Our intention was to design an exposure regimen that could induce demethylation without causing cytotoxic effects in our mouse model. It has been established that low doses of DAC can induce hypomethylation causing the reactivation of silenced genes whereas high doses cause cytotoxicity [Citation4,Citation51]. However, there is limited understanding as to the optimal dose of DAC to induce global hypomethylation and the ability to reactivate silenced genes while not producing cytotoxic effects in the model. Previous reports indicate that with doses of 0.15 mg/kg in mice, a 20% decrease in DNA methylation was reported using thin-layer chromatography after a 7-week exposure [Citation19]. Other studies show methylation decreases within MLH1 in humans during a 9-day exposure of 5 mg/kg [Citation17]. Interestingly, the same study had shown methylation within the promoter and blood 5mC content increased after day 12 of the exposure. Other studies report 6-day exposure at 5 mg/kg decreased methylation by 10% within tumours in mice [Citation52]. We found a 7-week exposure with doses ranging from 0.05 to 0.35 mg/kg by route of i.p. injection had the lowest toxic effects in mice.
We show the epigenetic properties of DAC using a mouse model causing tissue specific differential methylation but not uniform hypomethylation. Consistent with other studies, testes tissue is primarily responsive to hypomethylation induced by DAC exposure. Previous animal work has shown paternal exposure to DAC alters testes weight and spermatogenesis in a dose-dependent manner (0.0–0.15 mg/kg) within DNMT1 deficient mice after a 7-week treatment [Citation19]. From the same study, sperm methylation post-treatment decreased CCGG methylation by nearly 20%. Our WGBS results indicate significant hypomethylation induced by higher doses of DAC within testes, not liver (). When investigating the specific locations of hypo/hypermethylation status of both tissues and treatments, we find liver has biased site-specific differential methylation compared to random differential methylation found in testes (). This bias is evidence that our understanding of DAC’s hypomethylating mechanism is incompletely understood since it was previously believed that DAC was randomly incorporated into newly synthesized DNA strands. Our results contradict the working hypothesis of the hypomethylating properties induced by DAC. We found DAC exposure to cause both hypomethylation and hypermethylation in liver and testes tissue by our WGBS analysis. Although unclear, we can speculate possible causes of hypermethylation we observed was a result from cell death caused by incorporation of DAC and a plummeting decrease of hypomethylation. This would result in a population of cells with greater hypermethylation in comparison to control. However, further experiments are needed to conclude the cause of hypomethylation. Most surprising was the intergenic and intronic differential methylation within liver. Intergenic regions make up (50%) of the genome, while introns make up roughly the same percentage [Citation53]. Our results show intergenic regions are least affected and introns are more influenced by DAC differential methylation when compared to a random distribution.
By comparing the methylation of multiple tissues, we were able to distinguish the tissue specificity of DAC exposure. Our marker for a global proxy of methylation, the mouse LINE transposon, increased in methylation within both testes and liver tissue in at least one CpG site, contrary to expectations. LINE and IAP elements are typically used as a surrogate to estimate changes of global methylation [Citation54]. Previous trials found LINE methylation in blood decreases after DAC exposure in human clinical trials [Citation18,Citation55]. Our findings indicate that DAC exposure increases LINE methylation within testes and liver at all doses and for IAP elements in testes at higher doses.
The Avy mouse has a specific IAP insertion, a metastable epiallele, indicating changes in DNA methylation by shifts in fur coat colour[Citation56]. We attempted to shift fur coat colour in the Avy mouse, scoring fur coat colour as an indicator for decreased methylation within the IAP insertion of the Agouti gene. Brown fur coat colour indicates high methylation at the agouti locus whereas yellow fur coat colour indicates low methylation. Fur coat colour in mice within all dose ranges did not change even after 259 days, indicating the DAC exposure did not decrease methylation within the Avy IAP retrotransposon. Our treatment took place in adult male mice, which may explain differences from literature suggesting DAC exposure can reactivate genes or reduce methylation site specifically in embryonic or neonatal mice [Citation14,Citation49,Citation57]. Prior research had indicated the reactivation of IAP retrotransposons, treatment of 5ʹazacytidine (the precursor to DAC) on mouse embryo fibroblasts decreases DNA methylation and increases the expression of gene transcripts of IAP [Citation57,Citation58]. Even in our most affected tissue, testes, IAP methylation, remained unaltered or even increased with DAC treatment [Citation44]. Compared to acute doses causing reactivation of silenced genes, we exposed adult mice over a period of 7 weeks with non-cytotoxic doses. While we limited our investigation to phenotypic changes caused by the reactivation of the IAP element, it is unclear if our chronic dosing schedule reactivated unidentified silenced genes. It is possible that our delivery of DAC by intraperitoneal injection may contribute to a low incorporation rate due to the molecule’s short half-life, or even the frequency of our periodic exposure, rather than a continuous intravenous administration or direct exposure to cell lines by DAC.
We find that Igf2 and Tcf3 methylation decreases specifically within testes at higher doses. Igf2 is shown to reactivate in cell lines and decrease in methylation post-treatment [Citation45,Citation47]. Similar to previous research, we were able to replicate decreases in Tcf3 methylation in testes after a chronic low-dose exposure [Citation44]. Interestingly, decrease in Tcf3 testes methylation was also replicated in blood methylation, but not within liver, hippocampus, or cortex tissue. DAC appears to alter methylation within tissues that are affected by its toxicity [Citation4,Citation6,Citation26]. However, it is possible that hippocampus, cortex, and other somatic tissue methylation may remain unaltered due to our low dose chronic exposure paradigm or variability in uptake. Dose and duration of exposure should be considered when using DAC to evaluate biological functions of methylation outside of target tissues.
By identifying the top canonical pathways dysregulated by DAC exposure in testes and liver (, Sup. –14) we were able to determine the dysregulation for both liver and testes tissues. Matching our WGBS results, we found a greater number of dysregulated genes within the testes and in higher doses for both tissues. Surprisingly, the extreme bias in hypomethylation seen in testes was not reflected in gene expression since roughly the same number of genes were up- and down-regulated even at both doses. Our findings indicate DAC dysregulates testes gene expression in a disordered, non-specific manner. In liver, both doses caused predominant up-regulation as would be expected from hypomethylation, yet liver methylation was evenly affected in both directions. These findings imply a lack of tight coupling between methylation and gene expression changes induced by DAC. While testes higher dose treatments tend to cluster together, they share some dissimilarity as indicated by their Multidimensional scaling graph (MDS) arrangement (Sup. ). Further investigation is needed to identify pathways related to toxicity or methylation regulation, including the presence of hydroxymethylation. Because of the huge quantity of differential gene expression induced by DAC, for instance in the testes almost half of all genes were disrupted, it is difficult to elucidate the significance of dysregulated key gene networks and pathways. We identified no top pathways dysregulated by DAC that had overlap between the two tissues. Our results consistently identified cancer, cell death and survival, and organismal injury and abnormalities as a top disease and biological functions with dysregulated gene expression.
DAC provokes passive demethylation by inhibition of the catalytic binding domain of DNMTs [Citation16]. Therefore, we were interested if DAC inhibition had an effect on Dnmt mRNA expression (). DAC did not alter testes or liver mRNA expression within functionally active Dnmts (Dnmt1, Dnmt3a, Dnmt3b). Interestingly, Dnmt3 l mRNA expression significantly decreased as dose increased within testes. Dnmt3 l is a catalytically inactive methyltransferase, but promotes the methylation by interacting with Dnmt3a and Dnmt3b [Citation48]. The expression of Dnmt3 l is highest within germ cells when retrotransposons undergo de novo methylation during embryogenesis [Citation59]. We speculate Dnmt3 l decreases in expression if DNMT3a or DNMT3b proteins are unavailable to form methylation binding complexes with DNMT3 l. However, we must not neglect the possibility of testicular toxicity influencing Dnmt3 l expression. Thus, further research is required to determine if the role of DAC Dnmt3 l mRNA expression.
The current study provides insights on the use of DAC as a hypomethylating agent in a whole animal model. Azanucleosides are commonly used epigenetic therapy tools to induce hypomethylation [Citation12,Citation13]. Our findings indicate global and site-specific differential methylation by use of chronic, low doses of DAC, but in a dramatically tissue-specific manner. Further research is necessary to understand the specific mechanisms on tissue hypomethylation and cause of hypermethylation, such as 1) the abundance of DNMT proteins and 2) the presence of 5-hydroxymethylation post-exposure. Regarding transcription, DAC also dysregulates gene expression, again not uniformly between tissues. Further investigation is required to correlate demethylation with gene dysregulation. Our findings warrant scepticism of the universality of DAC as a demethylating agent and hypomethylation as a primary driver of its anti-neoplastic activity, especially in vivo. Together, these observations suggest the use of DAC as an unbiased universal hypomethylating agent should be regarded with caution as DAC does not preferentially demethylate the epigenome or dysregulate gene expression uniformly.
Accession numbers
Liver and Testes RNA-seq raw fastq reads for doses 0.0 mg/kg, 0.15 mg/kg, and 0.35 mg/kg have been deposited with the Sequence Read Archived submission: SUB7033954 under accession number PRJNA608917. Liver and Testes WGBS raw fastq reads for doses 0.0 mg/kg, 0.15 mg/kg, and 0.35 mg/kg have been deposited with the Sequence Read Archived submission: SUB6853480 under accession number PRJNA603069.
Supplemental Material
Download PDF (6.3 MB)Acknowledgments
The authors would like to thank the University of Michigan Epigenomics and Advanced Genomics Cores for the assistance with whole genome bisulfite sequencing data generation and analysis. The content is solely the responsibility of the authors and does not represent the official views of the National Institutes of Health.
Disclosure statement
The authors have no conflicts of interest.
Supplementary material
Supplemental data for this article can be accessed here.
Availability
Fastq RNA-seq and WGBS reads are available in the SRA repository. (https://www.ncbi.nlm.nih.gov/sra)
Additional information
Funding
References
- Gnyszka A, Jastrzȩbski Z, Flis S. DNA methyltransferase inhibitors and their emerging role in epigenetic therapy of cancer. Anticancer Res. 2013.33(8):2989–2896
- Oki Y, Aoki E, Issa JPJ. Decitabine-Bedside to bench. Crit Rev Oncol Hematol. 2007;61(2):140–152.
- Diesch J, Zwick A, Garz A-K, et al. A clinical-molecular update on azanucleoside-based therapy for the treatment of hematologic cancers. Clin Epigenetics. 2016;8(1). DOI:10.1186/s13148-016-0237-y
- Momparler RL. Pharmacology of 5-aza-2′-deoxycytidine (decitabine). Semin Hematol. 2005;42:S9-S16.
- Jaenisch R, Bird A. Epigenetic regulation of gene expression: how the genome integrates intrinsic and environmental signals. Nat Genet. 2003;33(Suppl):245–254.
- Karahoca M, Momparler RL. Pharmacokinetic and pharmacodynamic analysis of 5-aza-2′- deoxycytidine (decitabine) in the design of its dose-schedule for cancer therapy. Clin Epigenetics. 2013;5(1):3.
- Jeltsch A. Molecular enzymology of mammalian DNA methyltransferases. Curr Top Microbiol Immunol. 2006. DOI:10.1007/3-540-31390-7_7
- Patel K, Dickson J, Din S, et al. Targeting of 5-aza-2ʹ-deoxycytidine residues by chromatin-associated DNMT1 induces proteasomal degradation of the free enzyme. Nucleic Acids Res. 2010;38(13):4313–4324.
- Hattori N, Sako M, Kimura K, et al. Novel prodrugs of decitabine with greater metabolic stability and less toxicity. Clin Epigenetics. 2019;11(1). DOI:10.1186/s13148-019-0709-y
- Stresemann C, Brueckner B, Musch T, et al. Functional diversity of DNA methyltransferase inhibitors in human cancer cell lines. Cancer Res. 2006;66(5):2794–2800.
- Viet CT, Dang D, Achdjian S, et al. Decitabine rescues cisplatin resistance in head and neck squamous cell carcinoma e112880. PLoS One. 2014;9(11):e112880.
- Raynal Noël J.-M., Issa Jean-Pierre J.. Chapter 7 – DNA methyltransferase inhibitors. Drug Discovery in Cancer Issa. 2016. doi: 10.1016/B978-0-12-802208-5.00007-2.
- Kaminskas E. FDA drug approval summary: azacitidine (5-azacytidine, Vidaza™) for injectable suspension. Oncologist. 2005;10(3):176–182.
- Jaenisch R, Schnieket A, Harbers K, et al. Treatment of mice with 5-azacytidine efficiently activates silent retroviral genomes in different tissues (toxicity of 5-azacytidine/in vivo activation of transcription/recombination of defective proviral genomes). Cell Biol. 1985.82(5):1451–1455
- Lillo Osuna MA, Garcia-Lopez J, El Ayachi I, et al. Activation of Estrogen Receptor Alpha by Decitabine Inhibits Osteosarcoma Growth and Metastasis. Cancer Res. 2019;79(6):1054-1068. doi: 10.1158/0008-5472.CAN-18-1255.
- Flotho C, Claus R, Batz C, et al. The DNA methyltransferase inhibitors azacitidine, decitabine and zebularine exert differential effects on cancer gene expression in acute myeloid leukemia cells. Leukemia. 2009;23(6):1019–1028.
- Plumb JA, Strathdee G, Sludden J, et al. Reversal of drug resistance in human tumor xenografts by 2ʹ-deoxy-5-azacytidine-induced demethylation of the hMLH1 gene promoter. Cancer Res. 2000;60(21):6039–6044.
- Molokie R, Lavelle D, Gowhari M, et al. Oral tetrahydrouridine and decitabine for non-cytotoxic epigenetic gene regulation in sickle cell disease: A randomized phase 1 study. PLoS Med. 2017;14(9):e1002382.
- Kelly TLJ, Li E, Trasler JM. 5-Aza-2′-deoxycytidine induces alterations in murine spermatogenesis and pregnancy outcome. J Androl. 2003;24(6):822–830.
- Qin T, Jelinek J, Si J, et al. Mechanisms of resistance to 5-aza-2ʹ-deoxycytidine in human cancer cell lines. Blood. 2009;113(3):659–667.
- Doerksen T, Benoit G, Trasler JM. Deoxyribonucleic acid hypomethylation of male germ cells by mitotic and meiotic exposure to 5-azacytidine is associated with altered testicular histology. Endocrinology. 2000;141(9):3235–3244.
- Wong CC, Kang W, Xu J, et al. Prostaglandin E2 induces DNA hypermethylation in gastric cancer in vitro and in vivo. Theranostics. 2019;9(21):6256–6268.
- Anders NM, Liu J, Wanjiku T, et al. Simultaneous quantitative determination of 5-aza-2ʹ-deoxycytidine genomic incorporation and DNA demethylation by liquid chromatography tandem mass spectrometry as exposure-response measures of nucleoside analog DNA methyltransferase inhibitors. J. Chromatogr. B Anal. Technol. Biomed. Life Sci. 2016;1022:38–45.
- Juttermann R, Li E, Jaenisch R. Toxicity of 5-aza-2ʹ-deoxycytidine to mammalian cells is mediated primarily by covalent trapping of DNA methyltransferase rather than DNA demethylation. Proc Natl Acad Sci USA. 1994;91(25):11797–11801.
- Terse P, Engelke K, Chan K, et al. Subchronic oral toxicity study of decitabine in combination with tetrahydrouridine in CD-1 mice. Int J Toxicol. 2014;33(2):75–85.
- Momparler RL, Frith CH. Toxicology in mice of the antileukemic agent 5-AZA-2ʹ-deoxycytidine. Drug Chem Toxicol. 1981;4(4):373–381.
- Cao Q, Wang X, Jia L, et al. Inhibiting DNA methylation by 5-Aza-2ʹ-deoxycytidine ameliorates atherosclerosis through suppressing macrophage inflammation. Endocrinology. 2014;155(12):4925–4938.
- Weinhouse C, Anderson OS, Bergin IL, et al. Dose-dependent incidence of hepatic tumors in adult mice following perinatal exposure to bisphenol A. Environ Health Perspec. 2014;122(5):485–491.
- Kochmanski J, Vanoeveren SE, Patterson JR, et al. Developmental dieldrin exposure alters DNA methylation at genes related to dopaminergic neuron development and Parkinson’s disease in mouse midbrain. Toxicol Sci. 2019;169(2):593–607.
- Andrews S. FASTQC A quality control tool for high throughput sequence data. Babraham Inst. 2015.
- Bolger AM, Lohse M, Usadel B. Trimmomatic: A flexible trimmer for Illumina sequence data. Bioinformatics. 2014;30(15):2114–2120.
- Kim D, Langmead B, Salzberg SL. HISAT: A fast spliced aligner with low memory requirements. Nat Methods. 2015;12(4):357–360.
- Trapnell C, Williams BA, Pertea G, et al. Transcript assembly and quantification by RNA-Seq reveals unannotated transcripts and isoform switching during cell differentiation. Nat Biotechnol. 2010;28(5):511–515.
- Liao Y, Smyth GK, Shi W. The R package Rsubread is easier, faster, cheaper and better for alignment and quantification of RNA sequencing reads. Nucleic Acids Res. 2019. DOI:10.1093/nar/gkz114
- MD R, DJ M, GK S. edgeR: a Bioconductor package for differential expression analysis of digital gene expression data. Bioinformatics. 2010;26(1):139–140.
- Illumina. Sequencing methods review (A review of publications featuring Illumina Technology). Illumina Protoc. 2014.
- Krueger F. Trim Galore!: A wrapper tool around Cutadapt and FastQC to consistently apply quality and adapter trimming to FastQ files. Babraham Institute. 2015. doi:10.1002/maco.200603986.
- Krueger F, Andrews SR. Bismark: A flexible aligner and methylation caller for Bisulfite-Seq applications. Bioinformatics. 2011;27(11):1571–1572.
- Langmead B, Salzberg SL. Fast gapped-read alignment with Bowtie 2. Nat Methods. 2012;9(4):357–359.
- Park Y, Wu H. Differential methylation analysis for BS-seq data under general experimental design. Bioinformatics. 2016;32(10):1446–1453.
- Cavalcante RG, Sartor M. A. annotatr: associating genomic regions with genomic annotations. bioRxiv. 2016;1–9. DOI:10.1101/039685
- Lemaire M. Importance of dose-schedule of 5-aza-2′-deoxycytidine for epigenetic therapy of cancer. BMC Cancer. 2008;8:128.
- Song N, Endo D, Song B, et al. 5-aza-2′-deoxycytidine impairs mouse spermatogenesis at multiple stages through different usage of DNA methyltransferases. Toxicol. 2016;361-362:62–72.
- Kläver R, Sánchez V, Damm OS, et al. Direct but no transgenerational effects of decitabine and vorinostat on male fertility. PLoS One. 2015;10(2):e0117839.
- Ito Y, Nativio R, Murrell A. Induced DNA demethylation can reshape chromatin topology at the IGF2-H19 locus. Nucleic Acids Res. 2013;41(10):5290–5302.
- Wang Y, Su J, Wang L, et al. The effects of 5-Aza-2′- deoxycytidine and trichostatin a on gene expression and DNA methylation status in cloned bovine blastocysts. Cell Reprogram. 2011;13(4):297–306.
- Eversole-Cire P, Ferguson-Smith AC, Sasaki H et al. Activation of an imprinted Igf 2 gene in mouse somatic cell cultures. Mol Cell Biol. 2015. DOI:10.1128/mcb.13.8.4928.
- Bourc’his D, Bestor TH. Meiotic catastrophe and retrotransposon reactivation in male germ cells lacking Dnmt3L. Nature. 2004;431(7004):96–99.
- Jaenisch R, Schnieke A, Harbers K. Treatment of mice with 5-azacytidine efficiently activates silent retroviral genomes in different tissues. Proc Natl Acad Sci. 2006. DOI:10.1073/pnas.82.5.1451
- Bestor TH. The DNA methyltransferases of mammals. Hum Mol Genet. 2000;9(16):2395–2402.
- Jabbour E, Issa JP, Garcia-Manero G, et al. Evolution of decitabine development: accomplishments, ongoing investigations, and future strategies. Cancer. 2008;112(11):2341–2351.
- Chuang JC, Warner SL, Vollmer D, et al. S110, a 5-Aza-2ʹ-deoxycytidine-containing dinucleotide, is an effective DNA methylation inhibitor in vivo and can reduce tumor growth. Mol Cancer Ther. 2010;9(5):1443–1450.
- Francis WR, Wörheide G. Similar ratios of introns to intergenic sequence across animal genomes. Genome Biol Evol. 2017;9(6):1582–1598.
- Yang AS. A simple method for estimating global DNA methylation using bisulfite PCR of repetitive DNA elements. Nucleic Acids Res. 2004;32(3):38e-38.
- Yang AS, Doshi KD, Choi S-W, et al. DNA methylation changes after 5-aza-2′-deoxycytidine therapy in patients with leukemia. Cancer Res. 2006;66(10):5495–5503.
- Dolinoy DC. The agouti mouse model: an epigenetic biosensor for nutritional and environmental alterations on the fetal epigenome. Nutr Rev. 2008;66 Suppl 1(Suppl 1): S7–S11.
- Davis CM, Constantinides PG, Gevers W, et al. Activation and demethylation of the intracisternal A particle genes by 5-azacytidine. Cell Differ Dev. 1989;27(2):83–93.
- Lasneret J. Electron microscopic characterisation of retrovirus and retrovirus-like particles induced by demethylating agents (5-azacytidine and 5-azadeoxycytidine) in Syrian hamster (Mesocrisetus auratus) cells. J Exp Pathol. 1989;4(1):47–56.
- Kao T-H, Liao H-F, Wolf D, et al. Ectopic DNMT3L triggers assembly of a repressive complex for retroviral silencing in somatic cells. J Virol. 2014;88(18):10680–10695.