
ABSTRACT
Overweight/obesity is the main risk factor for gestational diabetes mellitus (GDM). In our cohort of pregnant women with GDM, n = 19, and without, n = 22, we previously reported a significant increase in SOCS3 mRNA expression (+62%) in visceral adipose tissue (VAT) according to GDM, without altered promoter DNA-methylation. Here, we examined methylation status of additional SOCS3 exon 2 regions in VAT and maternal blood. We found significantly altered methylation at specific CpG sites corresponding to aberrant mRNA expression levels of SOCS3 in VAT. We propose a potential regulatory element/region within exon 2; however, this region does not appear to be a good blood-marker representing VAT.
Introduction
Obesity is a growing global health concern and specifically, in pregnancy, is a major risk factor for gestational diabetes mellitus (GDM) [Citation1–4]. Recent research into the specific influence visceral obesity and associated epigenetics plays in the cause and development of GDM have reported involvement of key candidates in insulin resistance (i.e., adiponectin, insulin receptor, phosphoinositide-3-kinase subunit p85) and inflammatory pathways such as the TNF-alpha and suppressor of cytokine signalling 3 (SOCS3) [Citation5–8]. Several studies have reported the roles SOCS3 has in various diseases and conditions (e.g. cancers, viral infections, neurological disorders, cardiovascular disease, diabetes, etc.) [Citation9]. SOCS3 is an important player in leptin and insulin signalling, as well as apoptosis process in the cellular make up of adipose tissue making it a key candidate/target for obesity research, and additional metabolic stress conditions such as GDM [Citation10–12].
As previously reported, we observed a significant overexpression of SOCS3 mRNA (+62%) in the visceral adipose tissue (VAT) of GDM patients compared to matched normal glucose tolerant (NGT) controls [Citation8]. However, this increase in expression was not explained by alterations in DNA methylation at the 5ʹ promoter target regions within the CpG island investigated. Hypomethylation (levels under 8%) with no group differences and no correlation to VAT mRNA expression were observed leaving the question of what was driving this aberrant expression at the SOCS3 locus. Could this disruption in VAT SOCS3 mRNA expression be linked to altered DNA methylation of another potential regulatory region/element? In order to examine this, another possible target area closer to the transcription start site (TSS) within exon 2 was chosen based on the presence of potential transcription factor binding sites (TFBS) e.g. Sp1, Ap2, EGR1,3as well as the previously published epigenome-wide association studies (EWAS) findings. EWAS studies reported cg18181703 site methylation levels being associated with obesity and metabolic stress using methylation arrays and pyrosequencing of adult blood samples vs. BMI in cohort studies of obesity [Citation13–15]. We investigated the DNA methylation levels in VAT and maternal blood (MB) to determine whether this region (including cg18181703) played a role in the altered SOCS3 gene expression associated with GDM.
Results
Detailed study cohort characteristics (e.g. maternal and birth) for both groups (NGT: n = 22 and GDM: n = 19) are summarized in Rancourt et al. [Citation8]. BMI (prepregnancy and at delivery) was similar between groups with the average of both groups being overweight (mean ±SD prepregnancy BMI NGT: 26.8 ± 7.9 kg/m2 and GDM: 28.2 ± 6.7 kg/m2) as previously reported [Citation8]. At delivery, the GDM group had altered maternal metabolic and hormonal states and higher fasting maternal blood levels for C-peptide, insulin, glucose plasma levels, and homeostatic model assessment of insulin resistance (HOMA-IR) [3–5]. SOCS3 mRNA expression was significantly increased (mean ± SEM, NGT: 267.6 ± 38.2 vs. GDM: 445.1 ± 61.6, P = 0.016) in the VAT of GDM women compared to the controls even after adjustment for BMIs (prepregnancy or at the time of delivery) [Citation8].
In the SOCS3 methylation analysis, two pyrosequencing assays covering 8 CpG sites and potential TFBS were profiled with bisulphite pyrosequencing ()). Statistically significant differences were found in VAT between groups within exon 2 at two sites which were CpG5: GDM 67.0% vs. NGT 74.2%, P = 0.002, q = 0.0007 and at CpG6: GDM 59.6% vs. NGT 65.2%, P = 0.017, q = 0.0055, P-values are false discovery rate (FDR) adjusted ()). As shown in , both sites are within potential Sp1 binding sites and the analysed region covers multiple potential transcription factors.
Figure 1. SOCS3 exon 2 CpG site-specific DNA methylation analysis in visceral adipose tissue (VAT) and maternal blood (MB) of women with NGT vs. GDM. (a) Schematic of the DNA methylation assays (brown bars) for the SOCS3 gene body/exon 2 region (b) Percent DNA methylation at each individual CpG site investigated (8 CpG sites) in VAT of normal glucose tolerant (NGT white; n = 22) vs. gestational diabetes mellitus group (GDM; red; n = 19). (c) Per cent DNA methylation at individual CpG site investigated in MB of NGT (white; n = 22) vs. GDM (red; n = 19). Box-whisker plots with minimum and maximum values. Below graphs, the potential TFBS (e.g. Sp1, Ap2) shown with bars across the relevant CpG site locations are depicted as well as cg18181703 at CpG 4 (shown in dark blue font). TSS: Transcriptional start site, bp: basepairs, TFBS: Transcriptional factor binding sites. *P < 0.05, **P < 0.001 AU, arbitrary units
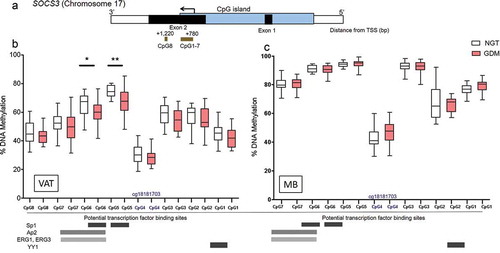
Next, we further investigated the SOCS3 exon 2 DNA methylation levels at the significant CpG sites 5–6 region in the corresponding maternal blood (MB) and found no significant group differences between GDM and NGT across CpG sites 1–7 ()). Interestingly, the methylation levels in MB at the investigated CpG sites within the assay region have higher per cent methylation compared to VAT (). The methylation per cent averages across the whole cohort at the individual CpG sties in VAT vs. MB are as follows: (CpG7: VAT 51.2%, MB 80.1%; CpG6: VAT 62.6%, MB 90.6%; CpG5: VAT 70.9%, MB 94.1%; CpG4 (cg18181703): VAT 29.0%, MB 44.4%; CpG3: VAT 56.3%, MB 92.3%; CpG2: VAT 55.7%, MB 67.1%; and CpG1: VAT 43.7%, MB 77.7%). Furthermore, Spearman correlations revealed no significant relationships between VAT and MB DNA methylation levels across the CpG sites examined (CpG1: r = 0.09, P = 0.59; CpG2: r = −0.05, P = 0.74; CpG3: r = −0.22, P = 0.17; CpG4: r = 0.17, P = 0.29; CpG5: r = −0.08, P = 0.60; CpG6: r = 0.03, P = 0.85; CpG7: r = −0.06, P = 0.69).
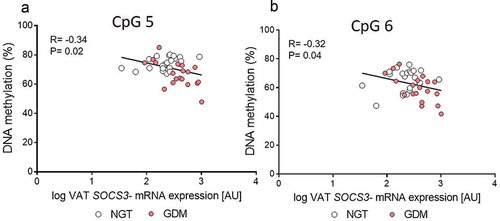
Additionally, SOCS3 mRNA VAT expression levels had significant inverse correlations with the corresponding methylation levels at these statistically significant sites, CpG5: R = −0.34, P = 0.02 and CpG6: Pearson R = −0.32, P = 0.04; , while the mean for the CpG1-7 assay showed a trend (R = −0.28, P = 0.06). No relationship with MB methylation levels and SOCS3 VAT mRNA expression was seen.
Figure 2. Correlation between SOCS3 exon 2 DNA methylation and mRNA expression levels in visceral adipose tissue (VAT). (a-b) Pearson’s correlation coefficients (r) were calculated to investigate the relationship between DNA Methylation of the statistically significant CpG sites 5–6 and the respective SOCS3 VAT gene expression levels. Gene expression of SOCS3 was normalized to peptidylprolyl isomerase A (PPIA). Normal glucose tolerant group (NGT; white circles; n = 22) vs. gestational diabetes mellitus group (GDM; red circles; n = 19)
Furthermore, within this region, the methylation levels of CpG4 (also referred to as cg18181703 in EWAS studies and methylation arrays [Citation13–15]) across the cohort were significantly inversely correlated to BMI (prepregnancy) for both VAT and MB methylation (VAT vs. BMI: Pearson R = −0.33, P = 0.03; MB vs. BMI: Pearson R = −0.35, P = 0.03, n = 41). The DNA methylation at the additional investigated CpG sites in both VAT and MB showed no significant correlation with pre-pregnancy BMI (e.g., VAT-CpG5: R = 0.17, P = 0.26; VAT-CpG6: R = 0.13, P = 0.39; MB-CpG5: R = −0.16, P = 0.30; MB-CpG6: R = −0.05, P = 0.75).
Discussion
We demonstrated that within exon 2 of SOCS3, per cent methylation levels are significantly decreased at specific sites (CpG5-6), which corresponds to the significant increase of mRNA expression in VAT according to GDM. Methylation levels at sites CpG5-6 show significant inverse correlation with mRNA VAT SOCS3 expression. Additionally, we confirm previous findings from EWAS studies focusing on identifying epigenetic candidates related to obesity and metabolic syndrome with genome-wide methylation arrays on adult blood samples [Citation13,Citation14]. Though our cohort explicitly involved pregnant women, we similarly observed an inverse association of the methylation status at CpG4 (cg18181703) vs. BMI in MB, and importantly for the first time in VAT, which in this context is the biologically functional relevant source. Together, these findings speak to the link SOCS3 has as a key candidate for metabolic and adipose tissue dysfunction. Considering that in our study, both groups had similar average BMIs, this could explain why no significant group differences were observed at CpG4 (cg18181703) and therefore no link to the GDM condition, strengthening the validity of our measurements.
Interestingly, we observed a similar methylation level at CpG4/cg18181703 in archived Illumina Infinium Methylation data on a VAT cohort (n = 20) of lean or obese non-pregnant adolescent females (consisting of different races: African-American, Caucasian, and Hispanic); the VAT cg18181703 methylation was 29% in our cohort and 29.7% in the Barberio et al. cohort (Gene Expression Omnibus: GSE88940) [Citation16]. Our analysis of this SOCS3 exon 2 region showed a substantial drop in methylation levels at the site CpG4/cg18181703 compared to the neighbouring CpG sites, CpG3, and CpG5 (difference of ~28% between CpG3 and ~42% between CpG5). We hypothesize that this may indicate a potential regulator element/critical binding sequence which when altered disrupts the mRNA expression of SOCS3. Especially, since within these sites/target regions are potential TFBS such as Sp1 [Citation17] which when altered may contribute to the observed increase of mRNA. This possible methylation-sensitive regulatory site around CpG5 may be linked to the SOCS3-related metabolic imbalances of GDM. One scenario could be that for GDM patients, these distinct methylation alterations within this exon 2 region (e.g., TFBS) could drive an increase of SOCS3 VAT expression and ultimately affect the insulin receptor substrate complex disrupting the insulin/insulin receptor pathway resulting in increased adipocyte/adipose tissue insulin resistance. All of which is likely intensified when coupled with dysfunctional adipose tissue in GDM. Perhaps this investigated region could indicate an enhancer or silencer element via a chromatin looping event possibly driving regulation in a tissue-specific manner. VAT and MB methylation did not show correlation and in MB no group differences (NGT vs. GDM) were observed. We previously described, within the same study samples, no relationship between DNA methylation of VAT and MB across different target regions of adiponectin [Citation5]. Limitations with the methylation levels in blood corresponding to adipose tissue were discussed in the large-scale DNA methylation epigenome-wide array study profiling paired adipose tissue and blood [Citation18]. Interestingly, Huang et al. found that some discordant genes have biological functions related to inflammation [Citation18] which fits to our target gene, SOCS3. Consequently, this region of SOCS3 does not appear to be a good blood-marker (biomarker) for what is occurring in adipose tissue.
In conclusion, these results illustrate the role VAT and accompanying inflammatory processes could have in GDM. Future studies are needed to greater characterize how altered VAT changes into acting as a diseased inflammatory organ, especially as the overweight/obesity rates have increased as a public health crisis affecting alarming high numbers of pregnancies and their outcomes. Such knowledge could aid in identifying more strategic measures for prediction, prevention, and possible treatment.
Methods
Subject data
The research presented here is part of the prospective observational ‘Early CHARITÉ (EaCH)’ cohort study [Citation19]. The sub-cohort included in this study consists of 19 women with GDM and 22 women with NGT who were prospectively recruited before their scheduled Caesarean section (CS) at the Clinic of Obstetrics of the Charité – Universitätsmedizin Berlin, Campus Virchow-Klinikum, Germany. The recruitment, exclusion criteria, analytical approaches, standard procedures, and methodology, etc., have been reported in detail elsewhere [Citation19]. The groups were matched for maternal age, socio-economic status, ethnicity, parity, and specifically, prepregnancy BMI. All pregnancies were singleton. Further clinical parameters, as well as SOCS3 gene expression analysis, were reported elsewhere [Citation5–8,Citation19]. Research design and methods were conducted in accordance to the Declaration of Helsinki, revised in 2004, and approved by the local Ethics Committee (EA2/026/04). Informed written consent from all subjects was obtained.
DNA methylation analyses
Genomic DNA was extracted from both the fasting maternal venous blood collected prior to CS and the maternal VAT omental biopsies obtained during CS delivery, using the Quick-gDNA Blood kit and the Genomic DNA-Tissue kit (Zymo Research, Irvine, CA, USA). The EZ DNA Methylation Gold kit (Zymo Research) was used for bisulphite conversion. The exon-2 SOCS3 target pyrosequencing regions were located at chromosomal locations chr17:78,358,306–78,358,628 (CpG1-7 assay) and chr17:78,357,706–78,358,004 (CpG8 assay), UCSC Genome browser on human Dec. 2013, GRCh38/hg38 assembly. Combined literature review and in silico analyses revealed potential transcription factor binding sites (TFBS) Sp1, Ap2, EGR1, 3, YY1 within this sequence [Citation17,Citation20] (http://tfbind.hgc.jp/). Methylation assays were designed with PyroMark Assay Design Software v. 2.0 (Qiagen, Hilden, Germany), primer and assay information is as follows: (5ʹ to 3ʹ- Bisulphite converted sequence): the CpG1-7 assay Forward primer: TTTGGGAGTTTTTTTAGAAGAGTTTATTA, Reverse biotinylated primer: CCAAAACTACAAAACTCTCTCCTAATTA, sequencing primer 1: TTTGGGAGTTTTTTTAGAAGAGTTTATTA, sequencing primer 2: GAAGATTTTTTTGGTGTT, sequencing primer 3: GTGGTTATTTTTTAGTATTTTTG (amplicon size 322 base pairs and annealing temperature is 50°C). The CpG8 assay Forward primer: TGTGGAGTTGGGAAAGGT, Reverse biotinylated primer: CCATCCATCCCCTCCAAATAT TA, sequencing primer 1: TCACCCAAACCCTT, (amplicon size 298 base pairs, and annealing temperature is 52°C, CpG site at chr17:78,357,870). Pyrosequencing was performed on PCR products using the PyroMark Q24 pyrosequencer (Qiagen). Per cent methylation was analysed across individual measured CpG sites (eight sites). The specificity and reproducibility of the assays were validated using duplicate samples, various tissue types, and methylation scales (0–100%).
mRNA expression
Further details regarding SOCS3 mRNA expression in adipose tissue has been reported in Rancourt et al. [Citation8]. VAT mRNA expression analyses were performed using TaqMan technology (Applied Biosystems, Waltham, MA, USA), quantitative real-time PCR was performed in triplicate on a 7500 instrument (Applied Biosystems) with the respective controls. Pre-designed exon-exon spanning TaqMan primer assays from Applied Biosystems were used (ID: SOCS3: Hs02330328_s1) and amplified in singleplex with the housekeeping gene peptidylprolyl isomerase A (PPIA: Hs99999904_m1).
Statistical analyses
Data are presented as means ± SD or number and percentage. Unpaired t-test or Mann-Whitney-U-test were used as appropriate for group comparisons. Normal distribution of continuous variables was evaluated by Shapiro-Wilk-tests and skewed data were transformed logarithmically to achieve normal distribution. Pearson’s coefficients correlations (R) were calculated to assess associations between DNA methylation and gene expression, respectively. CpG sites were additionally run through a two-stage step-up method of Benjamini, Krieger, and Yekutieli to correct for FDR and to ensure that the statistically significant findings were not false positives [Citation21]. Statistical analyses were performed with GraphPad Prism 7.0 (GraphPad Software, San Diego, CA, USA) and SPSS 23.0 software (IBM, Munich, Germany). Statistical significance was P < 0.05.
Authors’ contributions
RCR contributed to design and conceptualization of the study, performed experiments, analyzed and interpreted the data and wrote the original draft. RO contributed to design and conceptualization of the study, performed experiments, analyzed the data, and reviewed the final draft. KS contributed to data collection/management and interpretation and reviewed the final manuscript. TZ performed laboratory measurements and reviewed the final manuscript. KM was involved in data collection/management and laboratory measurements and reviewed the final draft. WH provided resources and reviewed the final draft. AP contributed to design and conceptualization of the study, analyzed, and interpreted the data and wrote the original draft. All authors critically read and approved the final manuscript.
Ethical approval and consent to participate
Research design and methods were conducted in accordance with the Declaration of Helsinki, revised in 2004, and approved by the local Ethics Committee (Ethikausschuss 2 am Campus Virchow-Klinikum, Charité – Universitätsklinikum Berlin, EA2/026/04). All participants provided written informed consent before inclusion into the study.
Consent for publication
Not applicable.
Acknowledgments
The authors acknowledge Jens Stupin, MD, Joachim W. Dudenhausen, MD, PhD, FRCOG, Thomas Harder, MD, Andrea Loui, MD, Elisabeth Eilers, MD, and Sandra Schulz, MSc, for contributions to initial study cohort design, subject recruitment, and/or sample/data collection, respectively. We are very grateful to all study participants as well as the midwives and staff of the Clinic of Obstetrics at the Charité, Campus Virchow-Klinikum, Berlin, Germany, for the support in recruitment and sample/data collection.
Disclosure statement
The authors declare that they have no competing interests.
Availability of data and material
The datasets used and/or analyzed during the current study are available from the corresponding author on rational request.
Additional information
Funding
References
- Chen C, Xu X, Yan Y. Estimated global overweight and obesity burden in pregnant women based on panel data model. PLoS One. 2018 Aug 9;13(8):e0202183.
- Plagemann A. Maternal diabetes and perinatal programming. Early Hum Dev. 2011;87:7437.
- Franzago M, Fraticelli F, Stuppia L, et al. Nutrigenetics, epigenetics and gestational diabetes: consequences in mother and child. Epigenetics. 2019 Mar;14(3):215–235.
- Lain KY, Catalano PM. Metabolic changes in pregnancy. Clin Obstet Gynecol. 2007;50:938–948.
- Ott R, Stupin JH, Melchior K, et al. Alterations of adiponectin gene expression and DNA methylation in adipose tissues and blood cells are associated with gestational diabetes and neonatal outcome. Clin Epigenetics. 2018 Oct 24;10(1):131.
- Ott R, Melchior K, Stupin JH, et al. Reduced Insulin receptor expression and altered DNA methylation in fat tissues and blood of women with GDM and offspring. J Clin Endocrinol Metab. 2019 Jan 1;104(1):137–149.
- Rancourt RC, Ott R, Schellong K, et al. Visceral adipose tissue alteration of PI3KR1 expression is associated with gestational diabetes but not promoter DNA methylation. Adipocyte. 2019 Dec;8(1):339–346.
- Rancourt RC, Ott R, Ziska T, et al. Visceral adipose tissue inflammatory factors (TNF-Alpha, SOCS3) in gestational diabetes (GDM): epigenetics as a clue in GDM pathophysiology. Int J Mol Sci. 2020;21(2):479.
- Boosani CS, Agrawal DK. Methylation and microRNA-mediated epigenetic regulation of SOCS3. Mol Biol Rep. 2015 Apr;42(4):853–872.
- Ahima RS, Stanley TL, Khor VK, et al. Estrogen sulfotransferase is expressed in subcutaneous adipose tissue of obese humans in association with TNF-alpha and SOCS3. J Clin Endocrinol Metab. 2011 Jul;96(7):E1153–8.
- Emanuelli B, Peraldi P, Filloux C, et al. SOCS-3 inhibits insulin signaling and is up-regulated in response to tumor necrosis factor-alpha in the adipose tissue of obese mice. J Biol Chem. 2001 Dec 21;276(51):47944–47949.
- Liu Z, Gan L, Zhou Z, et al. SOCS3 promotes inflammation and apoptosis via inhibiting JAK2/STAT3 signaling pathway in 3T3-L1 adipocyte. Immunobiology. 2015 Aug;220(8):947–953.
- Xu K, Zhang X, Wang Z, et al. Epigenome-wide association analysis revealed that SOCS3 methylation influences the effect of cumulative stress on obesity. Biol Psychol. 2018 January;131:63–71.
- Ali O, Cerjak D, Kent JW Jr, et al. Methylation array methylation of SOCS3 is inversely associated with metabolic syndrome in an epigenome-wide association study of obesity. Epigenetics. 2016;11(9):699–707.
- Wahl S, Drong A, Lehne B, et al. Epigenome-wide association study of body mass index, and the adverse outcomes of adiposity. Nature. 2017 Jan 5;541(7635):81–86.
- Barberio MD, Nadler EP, Sevilla S, et al. Comparison of visceral adipose tissue DNA methylation and gene expression profiles in female adolescents with obesity. Diabetol Metab Syndr. 2019;11:98.
- Karlseder J, Rotheneder H, Wintersberger E. Interaction of Sp1 with the growth- and cell cycle-regulated transcription factor E2F. Mol Cell Biol. 1996;16:1659–1667.
- Huang YT, Chu S, Loucks EB, et al. Epigenome-wide profiling of DNA methylation in paired samples of adipose tissue and blood. Epigenetics. 2016;11(3):227–236.
- Ott R, Stupin JH, Loui A, et al. Maternal overweight is not an independent risk factor for increased birth weight, leptin and insulin in newborns of gestational diabetic women: observations from the prospective ‘EaCH’ cohort study. BMC Pregnancy Childbirth. 2018 Jun 20;18(1):250.
- Tsunoda T, Takagi T. Estimating transcription factor bindability on DNA. Bioinformatics. 1999;15(7/8):622–630.
- Benjamini Y, Krieger AM, Yekutieli D. Adaptive linear step-up procedures that control the false discovery rate. Biometrika. 2006;93:491–507.