
 ?Mathematical formulae have been encoded as MathML and are displayed in this HTML version using MathJax in order to improve their display. Uncheck the box to turn MathJax off. This feature requires Javascript. Click on a formula to zoom.
ABSTRACT
Genomes of KhoeSan individuals of the Kalahari Desert provide the greatest understanding of single nucleotide diversity in the human genome. Compared with individuals in industrialized environments, the KhoeSan have a unique foraging and hunting lifestyle. Given these dramatic environmental differences, and the responsiveness of the methylome to environmental exposures of many types, we hypothesized that DNA methylation patterns would differ between KhoeSan and neighbouring agropastoral and/or industrial Bantu. We analysed Illumina HumanMethylation 450 k array data generated from blood samples from 38 KhoeSan and 42 Bantu, and 6 Europeans. After removing CpG positions associated with annotated and novel polymorphisms and controlling for white blood cell composition, sex, age and technical variation we identified 816 differentially methylated CpG loci, out of which 133 had an absolute beta-value difference of at least 0.05. Notably SLC39A4/ZIP4, which plays a role in zinc transport, was one of the most differentially methylated loci. Although the chronological ages of the KhoeSan are not formally recorded, we compared historically estimated ages to methylation-based calculations. This study demonstrates that the epigenetic profile of KhoeSan individuals reveals differences from other populations, and along with extensive genetic diversity, this community brings increased accessibility and understanding to the diversity of the human genome.
Background
Patterns of DNA methylation can be distinct between human populations, reflecting both genetic and lifestyle differences [Citation1–6]. To gain insight into the extent of diversity seen in the human epigenome, we characterized DNA methylation patterns among the southern African KhoeSan, a group of ‘click-language’ speaking peoples of the greater Kalahari region. The KhoeSan’s way of life, which is characterized by a heavy reliance on gathering of wild foods with periodic hunting, and which may or may not be subsidized by subsistence farming and limited herding, is dramatically different from that of most other peoples in the world. Although whole-genome sequencing or genotyping has been performed on samples from several KhoeSan individuals [Citation7], our analysis represents one of the first epigenetic comparisons of the KhoeSan with other ethnic groups.
The Khoe and the San are two culturally distinct, but evolutionarily related groups that have occupied southern Africa for ≥ 100,000 years [Citation8–10]. Whereas the Kalahari San hunt for food and live from the provisions of the land, the Khoe also practice pastoralism. Contemporary members of the Khoe and San, hereafter called KhoeSan, descended from an extensive ancestral population, creating a breadth of genetic diversity in this group that is greater than any other human population [Citation7]. Unique physiological attributes of the Kalahari KhoeSan include one of the lowest adiposity coefficients in the world [Citation11], a lack of hypertension or hypertensive coronary heart disease (correlated with a lack of added dietary salt), and low urinary phosphate levels, potentially attributed to the lack of grains in their diet. In contrast to individuals with modernized amenities, the Kalahari KhoeSan individuals endure long periods where there is a lack of food, and they can store metabolic resources (including water and lipid metabolites) during times of plentiful food [Citation7,Citation11]. They can go for months without access to standing water; during those times they acquire moisture from water-storing melons and roots [Citation12]. Medical practices do not involve hospitals or Western medicine [Citation13].
We predicted that we would find differences in DNA methylation, especially in metabolic or immunological pathways, measured between the KhoeSan and other peoples, including nearby Bantu groups, some of which might be influenced by distinct environmental exposures in addition to genetic diversity. In this study we analysed DNA methylation microarray data for 38 KhoeSan and 42 regionally matched Bantu (and 6 Europeans). To minimize confounding of epigenetic differences by genetic variation, we first removed known common SNPs, then using methylation data as a proxy for genetic variation we identified 298 novel polymorphisms of high confidence. Analysis of differential methylation controlled for sex, age, leukocyte count and technical variation resulted in 816 differentially methylated sites (False Discovery Rate < 0.001). Among the top differentially methylated sites we found that site-specific methylation affects regulatory regions located in DNase hypersensitive sites, illustrated by a predicted alternative promoter of a zinc transporter, SLC394A. Gene set enrichment analyses identified new and known biologically relevant enrichments. Thus, after carefully filtering SNPs and assessing DNA methylation differences between the KhoeSan and non-KhoeSan groups, our data support the conclusion that their unique lifestyle and diverse genetic background is reflected in a unique DNA methylation profile in the blood.
Results
Probes differentially methylated in the KhoeSan
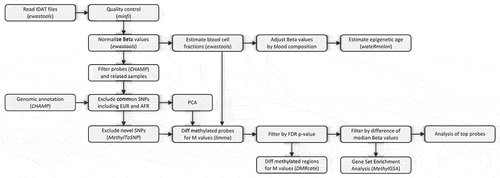
Samples from 38 KhoeSan individuals and 42 Bantu individuals were matched as carefully as possible given the absence of formal records on age from the consenting KhoeSan individuals (, age distribution comparison in Supplemental Figure 1). Data analysis workflow is depictured in . All samples were subjected to preprocessing and normalization aiming on minimizing technical variation and between-array differences. As a result, two KhoeSan samples were removed due to quality considerations. Afterwards, array probes were filtered by various quality control criteria. Additionally, all known common SNPs as well as those from African and European populations were removed from consideration, reducing the number of array probes to 354,596 in 94 samples for the downstream analysis.
Table 1. Demographic data for samples analysed
Figure 1. DNA methylation analysis pipeline
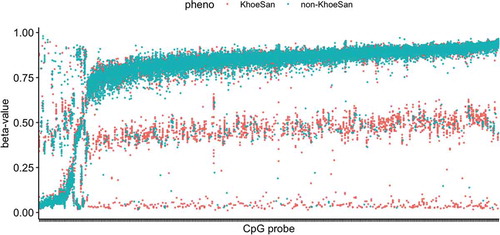
Lacking the genome sequences, we relied upon methylation data to identify and remove novel SNPs that may affect differential methylation analysis. shows three-tier patterns that are expected for sites where differences in methylation are driven by the underlying genetic variation, as in CC/CT/TT alleles [Citation14]. Although we used highly conservative parameters for identifying the SNPs, we were able to determine 298 of them across our limited dataset of 94 KhoeSan and non-KhoeSan individuals (Supplemental Table 1). Considering their allele frequencies in our limited dataset, the loci that were identified are most likely common SNPs in KhoeSan. Clustering of all samples based on the methylation of novel SNPs achieves a complete separation between the sample groups, except for one admixed sample (Supplemental Figure 2).
Figure 2. Identification of polymorphisms in methylation data. Strip chart shows methylation beta-values for 298 CpG array probes with trimodal patterns characteristic for SNPs with CC, CT, TT genotypes. Probes were found with the clustering algorithm implemented in MethylToSNP R package. Colour indicates the sample group: KhoeSan or non-KhoeSan. Heatmap and clustering of samples based on novel SNPs is provided in Supplemental Figure 1
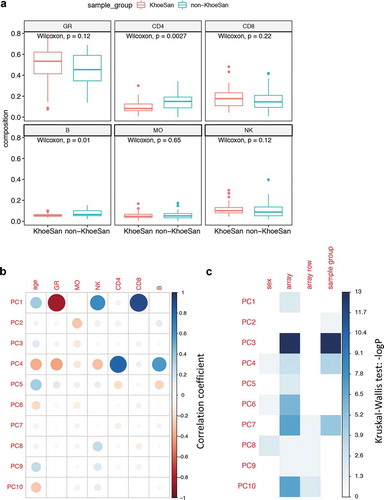
Prior to differential methylation analysis we assessed all possible sources of unwanted variance such as age, sex, leukocyte composition and technical artefacts of methylation arrays (, Supplemental Figure 3). We decomposed methylation data of our whole blood samples into individual components using reference leukocyte counts. Afterwards we analysed differences in immune cell composition in circulating blood between KhoeSan and non-KhoeSan groups. Significant differences were identified in CD4 + T-cell and B-cell counts ()). PCA analysis on all samples confirmed leukocyte composition as a strong confounding factor ()), dominating principal components PC1 and PC4. PCA did not reveal any strong association with age. We noted that incomplete randomization of samples across eight arrays resulted in confounding of sample group by array variable. ) shows that PC3 is associated with array variable (Kruskal-Wallis test p value 9.3e-14) as well as with the sample group (p value 7.1e-14). To remove unwanted between-array variance, we trained another PCA model on samples stratified by the non-KhoeSan group, selected components associated with between-array variance (PC3, PC5, PC7) and extrapolated component values to the complete non-stratified dataset (Supplemental Figure 4).
Figure 3. PCA of methylation data and inferred leukocyte composition. Comparison of proportions of granulocytes (GR), CD4+ T cells (CD4), CD8+ T cells (CD8), CD19+ B cells (B), monocytes (MO) and natural killer cells (NK) in samples from KhoeSan and non-KhoeSan groups. (b) Correlogram of top ten principal components obtained from normalized methylation data against leukocyte fractions and age. (c) Associations between principal components and categorical factors such as sex, sample group (KhoeSan and non-KhoeSan) and methylation array
Finally, we included the variables explaining technical variation in a linear regression model for differential methylation, along with age and sex variables (see Methods). Samples from genetically related individuals and replicates were excluded (remaining n = 83). In the differential methylation analysis we also excluded all the novel SNPs that we identified (remaining n = 354,298). We performed differential methylation analysis with M-values instead of beta-values, as the former reportedly have a better performance [Citation15]. We assessed p value inflation (Supplementary Figure 5) and applied a conservative false discovery rate threshold (FDR < 0.001) (Volcano plot in )). The analysis resulted in 816 differentially methylated CpG loci (Supplemental Table 2). To identify the differentially methylated loci of greatest interest, we computed the absolute differences in mean methylation beta-values between KhoeSan and non-KhoeSan groups (deltaBeta), applying a threshold of 0.05, resulting in 133 probes with the largest effect size (Volcano plot in )). ) shows a Manhattan plot with the one most significantly differentially methylated CpG probe per chromosome labelled by the name of the gene proximal to the probe. There are several possible genetic variants (with low minor allele frequencies) underlying differential methylation among these sites ()), however we do not have any evidence of genetic variants for these loci in KhoeSan, neither did we find any SNP-like patterns in these sites. By applying a second threshold on absolute difference in group-wise mean values (i.e., deltaBeta) of 0.1 (bold red dashed line in )) we short-listed 30 significantly differentially methylated sites with the largest effects. We cannot rule out completely, however, that there is no genetic variation underlying these sites. Also, such between-group differences may be driven by an outlier subgroup of samples rather than a shift in the whole group (Supplemental Figure 6). Supplemental Figure 7 shows that the sites with the largest difference in means also show the largest variance.
Figure 4. Differential methylation between KhoeSan and non-KhoeSan groups. (a) Volcano plot for fold change in M-values and FDR-adjusted t-test p-values, with 816 probes (shown in black) below FDR<0.001 threshold. (b) Probes selected based on mean beta-value difference (deltaBeta) for KhoeSan and non-KhoeSan groups (shown in green). (c) Manhattan plot produced with qqman R package showing the 0.001 FDR threshold (in red) and names of genes mapped for the most significantly differentially methylated probe on each chromosome. (d) Comparison of methylation beta-values for probes with |deltaBeta| > 0.05. A second threshold of 0.1 shown as a dashed red line separates 30 probes with the largest effect size. Probes are coloured by presence of single nucleotide variants in dbSNP database either directly on the CpG site (red) or within 10 bases (blue). Note that these variants have low allele frequencies in the population to be called SNPs, and they were not identified as potential SNPs based on the methylation data (). (e) deltaBeta for 133 CpG probes with the absolute mean beta-value difference of 0.05 plotted versus the average methylation beta-values in non-KhoeSan group. Contour lines show distribution density
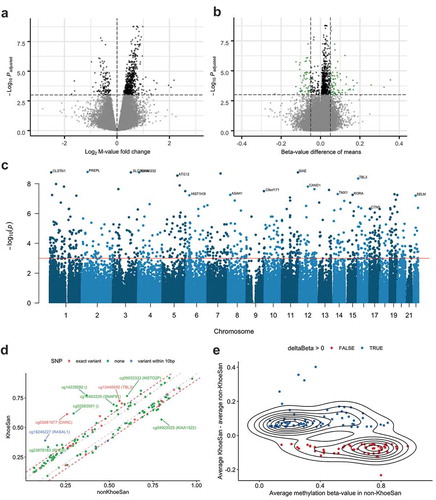
There is a slight general bias towards hypermethylation in KhoeSan compared to non-KhoeSan group (351 hypo- and 465 hypermethylated CpG) ()), which also holds true for the 133 CpG sites with |deltaBeta| > 0.05 (57 hypo- and 77 hypermethylated CpG) () and Supplemental Figure 6).
) shows a trend in differential methylation for 133 CpGs with the largest deltaBeta: CpG loci with low methylation in non-KhoeSan (< 0.5) are mainly hypermethylated in KhoeSan, whereas CpG loci that have high methylation in non-KhoeSan (> 0.5) are hypomethylated in KhoeSan (two-sided Fisher’s exact test p value = 0.000428, odd ratio = 3.68). Effectively, for the differentially methylated CpG with the largest effect size, the range of methylation values is more compressed, i.e., closer to beta-value of 0.5, in the KhoeSan group relative to non-KhoeSan group.
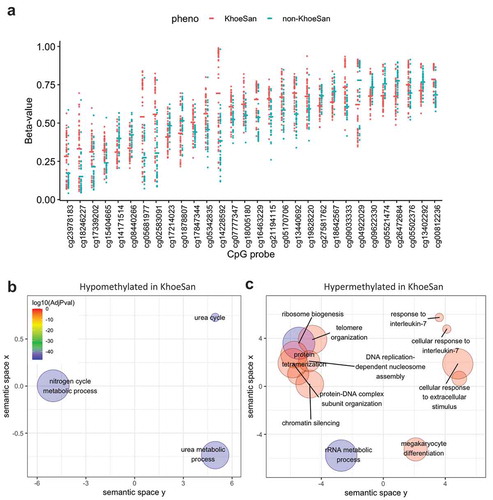
) shows distributions of beta-values in the top 30 most differentially methylated CpG sites. The most dramatic changes occurred at four probes in SLC39A4/ZIP4 (cg14228592, cg05681977, cg02583091, cg18246227), which encodes a zinc transporter with high expression in intestinal cell membranes (). The mean difference in methylation at each probe was between 0.26 and 0.40, with methylation in the KhoeSan samples between 0.61 and 0.77, except for probe cg18246227 with mean value of 0.39 (four SLC39A probes are shown in the bottom of Supplemental Figure 8).
Table 2. Top ten differentially methylated probes ordered by adjusted p value
Figure 5. Differentially methylated loci with the largest effect size between KhoeSan and non-KhoeSan groups. (a) Strip chart shows methylation beta-values in top 30 CpGs based on their mean absolute beta-value difference between KhoeSan and non-KhoeSan groups. (b–c) Significantly enriched GO terms (FDR < 0.001) identified by gene set enrichment analysis of: (b) hypomethylated and (c) hypermethylated CpG loci. Bigger circles denote more general and more frequent GO terms, whereas smaller denotes more specific ones. Colour corresponds to FDR significance level (blue – most significant)
Methylation signature unique to the KhoeSan
Next, we investigated whether the differentially methylated sites we identified represented a discrete signature of methylation for the KhoeSan. A clear separation emerged between KhoeSan and non-KhoeSan samples even with only 30 differentially methylated sites ()), also reproduced with the top 133 sites with the largest effect size (Supplemental Figure 8). We conclude that differentially methylated sites represent a unique KhoeSan methylation signature. Noteworthy, based on the methylation the admixed individual was clustered together with the KhoeSan group where that person lives, and not with the non-KhoeSan group as indicated by the SNP-based clustering (Supplemental Figure 2). This suggests an environmental influence on DNA methylation levels.
Functional implications of CpG sites differentially methylated in the KhoeSan
We were interested in whether differential methylation was enriched in any biological pathways or localized to any specific type of genomic region (e.g., DNase hypersensitive sites, enhancers, CpG islands, shores and shelves of CpG islands, gene bodies). We saw slight depletion in enhancers and enrichment in DNase hypersensitive sites that were suggestive but not statistically significant according to one-sided Fisher exact tests. Otherwise, no specific localization patterns in the 133 differentially methylated loci with |deltaBeta| > 0.05 were found.
We examined Gene Ontology (GO) term enrichment for differentially hypomethylated ()) and hypermethylated ()) CpG loci separately (Supplemental Table 3).
Hypomethylated sites ()) showed enrichment in (GO:0000050 urea cycle), (GO:0019627urea metabolic process) and (GO:0071941nitrogen cycle metabolic process).
Hypermethylated sites ()) showed enrichment for pathways involving ribosome biogenesis, which is linked to nutritional state. For example, cells subjected to energy deprivation repress ribosomal DNA transcription to maintain cellular ATP levels and protect against the energetic costs of ribosome biogenesis (GO:0042254 Ribosome biogenesis [Citation16]).
Enrichment also occurred in (GO:0009267cellular response to starvation) and (GO:0031669 cellular response to nutrient levels) driven primarily by cellular response to zinc ion starvation and (GO: 0005385 zinc ion transmembrane transporter activity), particularly in the SLC39A4 Zn transporter gene.
Another group of significantly enriched gene sets with hypermethylated CpG loci belongs to various epigenetic regulatory mechanisms such as (GO:0045814; negative regulation of gene expression, epigenetic), (GO:0060968; regulation of gene silencing), (GO:0006342; chromatin silencing), (GO:0034728; nucleosome organization), (GO:0006333; chromatin assembly or disassembly).
Immune system genes included (GO:0045652, regulation of megakaryocyte differentiation) and (GO:0098761, cellular response to Interleukin-7), where interleukin-7 is a cytokine important for B and T cell development.
Additionally, cell-cell adherens junctions, whose disruptions or defects are associated with a variety of diseases including inflammatory bowel disease [Citation17], disorders of the skin and hair [Citation18] and cancer [Citation19] (GO:0045296 cadherin binding) were also implicated.
Considering hypermethylation at the sites within the SLC39A4 gene in KhoeSan samples, we investigated functional implications of differential methylation. In a 980 bp genomic region of SLC39A4 we identified five methylated sites where the KhoeSan samples displayed roughly 20% more methylation than the non-KhoeSan, largely Bantu derived samples (). A third probe site in the locus represents a position that can contain a SNP and was not considered, although it did show significant differential methylation. The functional annotations at these positions in SLC39A4 are consistent with a novel alternate promoter marked by a CpG island, H3K27 acetylation, a DNase I hypersensitivity site, numerous transcription factor binding sites, and an annotated transcription start site. Thus, we predict that increased methylation in KhoeSan samples represents a functional outcome that is likely to involve SLC39A4 alternative promoter repression or differential expression of SLC39A4 isoforms between KhoeSan and non-KhoeSan individuals.
Figure 6. SLC39A4 methylation in a genomic context. Methylation in the SLC39A4 gene was examined in the UCSC Human Genome Browser, at positions of differentially methylated probes. Annotations for histone modifications, DNase hypersensitivity, CpG island, numerous transcription factors (by ChIP-seq) and an annotated 5ʹ end of a gene isoform all implicate an alternative promoter
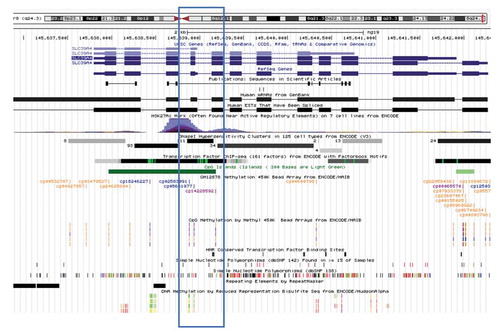
To analyse the presence of neighbourhoods of differential methylation, probe sites were tested for agglomeration of individual methylation sites into discrete, differentially methylated regions [Citation20]. In total, 91 locations were identified in the genome that overlap annotated promoters in the genome ( and Supplemental Table 4). The results included the SLC39A4 region, supporting the conclusion we drew previously of an alternative promoter. We conclude that patterns of tandem CpGs agglomerated into regions of differential methylation provide a strong rationale for predicting repressive functions at these epigenetically modified regulatory regions.
Table 3. Differentially methylated genomic regions and associated genes
Among other regions identified as the most significantly differentially methylated are loci associated with Homeobox protein HOXB which has several haematopoietic functions, olfactory receptor OR2I1P, for which increase of methylation was observed in KhoeSan and TEX26 with reduced methylation in KhoeSan.
Examining age differences in differential methylation findings
Given the acknowledged differences in chronological ages between the KhoeSan and non-KhoeSan datasets (which were unavoidable due to limited sample availability and estimation of KhoeSan ages: KhoeSan mean age = 63.2 years, SD = 14.3, non-KhoeSan mean age = 52 years, SD = 15.1; P = 0.008, t-test), we investigated whether differential methylation sites were directly implicated as age-related alterations. First, we calculated DNA methylation age using Horvath’s [Citation21] and Hannum’s [Citation22] models to compare the results to our original records of presumable and self-reported chronological age. The Horvath (and Hannum) methylation analysis shows more similarity between the methylation-based ages of the groups than the reported ages (Supplemental Figure 1). Moreover, the presence of a systematic bias, where the methylation-derived age is lower than the chronological age (deceleration showed in )) could indicate that both models were calibrated on mostly European population and are inaccurate when applied to an African population. We observed the largest deviations in the non-KhoeSan group, specifically for the centenarians in the non-KhoeSan group with the Horvath model and for the Hannum model in general.
Figure 7. DNA methylation age and age-associated methylation sites. (a) Difference (acceleration) between researcher-assigned or self-reported chronological age and DNA methylation age inferred by two computational models (Horvath and Hannum). All models tend to underestimate the age, regardless of the group. In many cases a large (10 or more years) discrepancy is seen. Comparison of age distributions between sample groups is shown in Supplemental Figure 12. (b) FDR-adjusted p values from differential methylation analysis are plotted against the p values for correlations between methylation beta-value and chronological age. Colour scale denotes correlation coefficients. Top probes with the largest association between methylation beta-value and age are labelled. (c) Scatter plots showing top three correlations between methylation beta-value and age
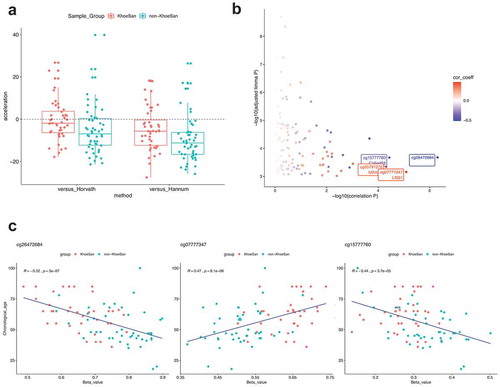
Next, we examined correlations between methylation levels in sites determined to be differentially methylated, and reported chronological age. We found several probes with (anti)correlations close to ±0.5 ()). Methylation levels for three of these probes are shown on scatterplots in ). It appears that in these cases age and sample group (KhoeSan vs non-KhoeSan) may be inseparable and that strong correlations would be much weaker if considered within the groups. From these results, we conclude that known markers of age are not implicated in the major differences in DNA methylation between KhoeSan and non-KhoeSan samples.
Discussion
The goal of our study was to investigate whether KhoeSan foragers have a DNA methylation profile present in their blood DNA that differs from non-forager agro-pastoralists with significant impact from an industrialized environment. We also aimed to predict whether any differential methylation sites specific to the KhoeSan epigenome are implicated in altering gene regulation. We established that a population-specific DNA methylation signature separates southern African KhoeSan from their southern African Bantu neighbours. We found a general hypermethylation bias in KhoeSan with a trend for differentially methylated CpG loci closer to beta-value of 0.5. We also showed that some of the most dramatic differences in DNA methylation occurred in the SLC39A4 gene, which encodes a zinc transporter. SLC39A4 is expressed at very low levels throughout the body, with the highest levels found in the transverse colon, small intestine and kidneys [Citation23]. The hypermethylation at this gene observed in KhoeSan could potentially repress expression of the gene and reduce cellular uptake of zinc. This would be consistent with the higher levels of zinc in KhoeSan diets [Citation24], for which the increased zinc availability may result in higher efficiency of zinc transporters and decreased need for additional expression. Nonetheless, a selective sweep has been shown through the Leu372Val polymorphism in Sub-Saharan Africans with a suggested advantage of providing nutritional immunity to pathogens reliant on zinc as a micronutrient [Citation25]. Other reports indicate higher expression levels of this gene may have relevance for less adiposity and inflammation [Citation26], with roles in insulin secretion in pancreatic beta cells [Citation27] and pancreatic cancer [Citation28].
Fagny et al. [Citation29] explore methylation landscapes of African rainforest populations, while their lifestyles may be similar, their environment differs from the semi-desert Kalahari KhoeSan. Their study participants are from both an isolated population and a more agrarian population with limited genetic mixing over the last several thousand years. Using an epigenome-wide association study Fagny et al. also found a separation of groups attributed to geographic location and subsistence methods. Another major finding of theirs was altered methylation patterns in immune pathways and developmental processes. After correcting proportional differences in leukocytes that biased our methylation results, we found immune pathways and inflammation, but our most significant findings were related to metabolic and physiological adaptations. However, epigenetic loci identified by Fagny et al. were not significantly differentially methylated between KhoeSan and non-KhoeSan groups according to our analysis (Supplemental Figure 9).
Our study has several recognized limitations. First, relatively small sample size limits the power of the analysis, which we addressed by using highly conservative thresholds on false discovery rate and on effect size. Second, the 38 KhoeSan and 42 individuals who donated samples to our study were matched as closely as possible for age and sex, but differences remained. Our model of differential methylation controlled for age and sex, thus potential for confounding by these factors is low. As described in the Results, only a few of the top differentially methylated probes we identified are associated with ageing, and no probes showed patterns which were statistically associated with sex. Third, although we filtered out probes associated with known SNPs and removed CpG sites where we identified novel SNPs based on characteristic methylation patterns, KhoeSan genomes may harbour other novel single nucleotide variants (SNVs). In that case, some of the differentially methylated CpG sites we observed in the KhoeSan may reflect genetic differences rather than epigenetic differences. There are known variants directly at the CpG sites of the probes or within 10 bp, which may affect methylation levels. However, allele frequencies in such variants are too low to consider them as SNPs, additionally they may not be manifested in KhoeSan population at all. Despite these careful assessments, we cannot rule out genetic differences that confer trans-acting epigenetic effects or distant cis-acting effects. Nevertheless, we conclude that the pattern of methylation we identified in the KhoeSan samples is not likely to be an artefact of sequence variants at CpG positions; instead, it reflects epigenomic programming based on both genetic and environmental differences from the non-KhoeSan group. Because of limited sample availability, we did not have the opportunity to perform bisulphite sequencing on any of the samples. Future work may enable more granulated analysis of the epigenetic differences in KhoeSan and Bantu individuals.
We note that samples were assessed on eight methylation chips, which could incur batch effects, thus we took steps to account for unwanted technical variance. Between-array normalization using control array probes has been performed. Additionally, to mitigate the residual technical variation we incorporated principal components associated with array chip into our differential methylation regression model, thus controlling for this effect. The second principal component PC2 is likely to be associated with technical variation in methylation arrays (Supplemental Figure 10). We note that all samples were processed and run at the same time and that replicates run on different arrays gave the lowest variation of any samples.
Another source of unwanted variation that we controlled for is leukocyte composition of whole blood samples. We used a model calibrated on cell counts from white blood cells in a different population, thus its parametrization is a known limitation. Although the differences in CD4+ T-cell and B-cell fractions in KhoeSan are significant and may have an immunological explanation, we accounted for variation in leukocyte counts as part of the differential methylation model. Thus, we can conclude that differentially methylated probes that we identified are not confounded by blood composition differences.
Conclusions
To our knowledge this is the first study to identify a unique DNA methylation signature present among KhoeSan individuals of the Kalahari. We have provided a model example of population-relevant methylation patterns with potential insight into the impact of environmental and lifestyle exposures on the epigenome. Additionally, we identified novel SNPs in KhoeSan based on their characteristic methylation patterns. Future studies of the KhoeSan with larger sample sizes can further investigate this subject; in particular, it will be important to determine whether additional studies replicate our differential methylation findings, and whether isoform expression levels of genes such as SLC39A4 have biological relevance in the manner predicted in this study.
Methods
Study participants and samples
Study participants broadly self-classified as KhoeSan (n = 38), Bantu (n = 42) or European (n = 6) () were consented and recruited within the borders of Namibia or South Africa in accordance with ethics approvals granted by the Ministry of Health and Social Services of Namibia (#17/3/3-Hayes 2008, #17/3/3-Heyns 2014 and #17/3/3-HEAF 2019), Limpopo Provincial Government (#4/2/2-Venter), University of Limpopo Medunsa Research and Ethics Committee (#MREC/H/28/2009-Venter), South African National Blood Service Human Research Ethics Committee (HREC #2012/11-Hayes) and University of Pretoria HREC (#43/2010 and #280/2017 Bornman), South Africa. DNA was extracted from whole blood using standard methods (QIAGEN Inc., Germantown, Maryland) and shipped under the Republic of South Africa Department of Health Export Permit (#J1/2/4/2), in accordance with the National Health Act 2003, and appropriate institutional Material Transfer Agreements between local institutions and the Garvan Institute of Medical Research in Australia, with site-specific approval granted by St Vincent’s Hospital HREC (SVH 15/227), and named collaborative contribution from the National Human Genome Research Institute, National Institutes of Health, Bethesda, Maryland, USA.
All 38 KhoeSan (aged 32–80 years, 50% female) were recruited within the remote Kalahari region of Namibia, with none to limited access to Western amenities. Ages of KhoeSan individuals were estimated through interviews and historical accounts of contemporary events to compensate for a lack of recorded ages (this has taken place over a 10-year period of engagement by V.M.H). By contrast, the 42 Bantu (aged 20–100 years, 57% female) represent either Southwestern (n = 26) or Southern (n = 16) Bantu ancestry (). Whereas the Southwestern Bantu were recruited from remote rural localities of Namibia with sustained agropastoral existence, the Southern Bantu were recruited from more industrialized regions of South Africa. To varying degree and in contrast to the KhoeSan, all Bantu in this study have access to amenities such as public transportation, Western medicine and food markets. All study participants were excluded if they held parental or sibling relationships in the dataset. As an internal control, we included 6 Europeans, including a twin pair of admixed South African Coloured ancestry (see Petersen et al. [Citation30] for a genetic and historic contribution to the South African Coloured population), whereas three sample replicates allowed for blinded validation (2 European and 1 Bantu). Two KhoeSan samples were excluded because of quality considerations, one twin and all replicates were excluded for further downstream analyses for a total of 83 samples undergoing methylation analyses.
Data collection
DNA was isolated using the QIAamp DNA Blood Mini kit or the FlexiGene DNA kit (QIAGEN, Gaithersburg, MD) and quantified on the NanoDrop spectrophotometer (Thermo Scientific). As recommended by Illumina, 0.5 ug of DNA were used for bisulphite conversion and methylation analysis. DNA was subjected to bisulphite conversion using the Zymo EZ-96 DNA Methylation Kit (Irvine, CA), according to the manufacturer’s standard protocol. Next, every sample was hybridized to Illumina Infinium Human Methylation 450K Beadchip arrays. All DNA was prepared for the chips concurrently, and all chips were run in parallel.
Data processing
Data processing and analysis has been performed in R (version 3.6.1) [Citation31] using ewastools [Citation32], minfi [Citation33], wateRmelon [Citation34], ChAMP [Citation35], MethylToSNP [Citation14], limma [Citation36], DMRcate [Citation20]. Data processing pipeline is shown in . We loaded raw data and ran a panel of quality control tests recommended by Illumina using ewastools (Supplemental Table 5). We excluded probes that did not have significant readings at α = 0.01 for > 75% of samples, after Holm’s multiple testing correction of sample detection P-values and bead count < 3 in at least 5% of samples. As a result of quality control, we excluded two KhoeSan Samples TK1 and MD6 because of the number of failed probes. The initial number of probes 485,577 was reduced to 354,596 in a sequence of filtering steps.
Namely, 10,028 sex chromosome probes, 3,091 non-CpG probes and 11 cross-reactive probes were removed. Additional 59,901 common SNPs as well as 5,214 EUR-specific and 11,762 AFR-specific SNPs were removed [Citation37] using CHAMP package filter functionality. No imputation for missing values has been performed, thus removing probes completely from the analysis if it had missing values in one or more samples.
We obtained normalized beta-values using ewastools R package with blood tissue option enabled, in order to minimize between-array effects [Citation38] while retaining ability to estimate blood leukocyte composition.
Identifying novel SNPs
SNVs may affect hybridization of DNA to methylation array probes, which is reported as changes in methylation beta-values. Common polymorphisms in CpG sites result in multimodal patterns thus, by detecting such patterns we can infer polymorphisms from methylation data. MethylToSNP [Citation14] with gap sum ratio 0.4, gap ratio 0.5 and 2 standard deviations for outlier removal was used to detect novel polymorphisms in combined KhoeSan and non-KhoeSan methylation data. We identified 359 potential SNPs, 298 of which MethylToSNP labelled as high confidence predictions (Supplemental Table 1). Probes corresponding to novel SNPs were removed from downstream analysis, resulting in 354,298 probes.
Principal component analysis
To identify and quantify potential sources of unwanted variance we performed PCA on all methylation probes after normalization and filtering. Probes with missing values were excluded. Principal components were calculated with R package prcomp with scaling enabled.
First, PCA was calculated for all samples (KhoeSan and non-KhoeSan together). Top 10 components were analysed in correlograms against Illumina control metrics (Supplemental Figure 10), blood leukocyte counts and age ()). Additionally, Kruskal-Wallis test was used to establish association between variance along each of the top 10 components and factors like sex, sample group, as well as batch variables: array and array row (), Supplemental Figure 4).
Second, we calculated PCA for the samples in non-KhoeSan group only and analysed the association of the top 10 components with sex and batch effects. Then, the components significantly associated with array variable (PC3, PC5 and PC7, Kruskal-Wallis p < 0.001) were used to reconstitute the values for the whole dataset, including KhoeSan and non-KhoeSan. Afterwards, association of the reconstituted components has been evaluated against sex, array and sample group variables (Supplemental Figure 4). These components were used as variables in the differential methylation linear regression model.
Leukocyte composition estimates
Blood leukocyte composition is a potential confounding factor in analysis of differential methylation and DNA methylation age calculations. In order to estimate leukocyte composition for each sample based on their normalized methylation beta-values we applied EstimateLC function from ewastools package parametrized with Houseman et al. [Citation39] and Reinius et al. cell counts [Citation40] (Supplemental Table 6).
For differential methylation analysis we added leukocyte counts as variables in linear regression model. For methylation clock age estimates the beta-values were adjusted by leukocyte composition using Houseman method implemented in ChAMP package.
Differentially methylated probes
Normalized beta-values for 354,298 filtered probes were converted to M-values. Replicates and samples from individuals with co-sanguinity were removed from differential methylation analysis, thus 37 KhoeSan and 46 non-KhoeSan (Bantu and European) derived samples were included.
First, we conducted Mann-Whitney U statistical tests for beta-values (without SNPs removed), that were subjected to multiple hypothesis testing correction using the Bonferroni method. From 12,613 probes at adjusted p value ≤ 0.05 we selected top 400 probes based on their maximum absolute difference between Khoesan and non-KhoeSan group medians in beta-values.
Second, we applied linear regression using R package limma and included several factors as model variables:
where leukocyte counts , and
included principal components from the non-KhoeSan group, presumably representing array batch effects (see PCA analysis section).
The p values for regression coefficients in variable, corresponding to KhoeSan and non-KhoeSan, were subjected to Benjamini-Hochberg correction. Supplemental Figure 5 shows p values and adjusted p values. Although there is inflation of unadjusted p-values, the artefact is completely removed in adjusted p values, possibly at the cost of overcorrecting. Moreover, a conservative false discovery rate threshold of FDR ≤ 0.001 was used in the downstream analysis, resulting in 816 significantly differentially methylated probes. Afterwards we filtered the probes based on the observed effect size. Two thresholds on absolute difference between group-wise means of beta-values have been applied: 0.05 and 0.1, yielding 133 and 30 probes with the largest effects, respectively.
Finally, we assessed coherence between the lists of top probes ranked by the two orthogonal approaches: 41 out of 133 probes identified by linear regression t-test were also found among 400 probes identified by Mann-Whitney U-test (Supplemental Figure 11).
Clustering of samples based on methylation data
Clustering of samples and probes based on their methylation beta-values was performed using agglomerative method with average linkage and Manhattan distance, implemented in hclust R function. Heatmaps were produced with aheatmap function from NMF R package.
Genomic feature enrichment and regions of differential methylation
Using the annotation of genomic positions provided by Illumina (IlluminaHumanMethylation450kanno.ilmn12.hg19), we determined the genomic locations of all probes differentially methylated between the KhoeSan and Bantu samples, as well as their relation to genomic features such as DNase hypersensitive sites, enhancers, CpG islands, shores and shelves, gene bodies. A CpG position was scored positive if it intersected the annotated interval by the genomic coordinates. Hypergeometric statistical tests were used to determine whether any region was enriched in the KhoeSan DNA. Regions of differential methylation were identified as in Peters et al. [Citation20]. The approach, implemented in R package DMRcate, first identifies differentially methylated sites, then combines them and calculates p values (Stouffer’s method) with correction (Benjamini-Hochberg).
Gene set enrichment analysis
We tested 133 significantly differentially methylated CpG probe sites with a |deltaBeta| of at least 0.05 for GO term enrichment with methylglm function from methylGSA R package [Citation41]. Methylglm is based on GOglm approach and fits a logistic regression model for each gene set, thus adjusting length bias in DNA methylation by the number of CpGs. We tested hyper- and hypomethylated CpGs separately. FDR threshold was set to 0.001 (Supplemental Table 3). Due to the hierarchic nature of gene ontology we applied REVIGO to cluster GO terms () [Citation42].
Methylation-based age prediction
Along with the investigator estimates of KhoeSan ages, referred to as chronological age, we applied methylation clock algorithm to predict DNA methylation ages of the KhoeSan and non-KhoeSan sample donors. We used Horvath’s [Citation21] and Hannum’s [Citation22] models implemented in R package wateRmelon [Citation34]. We analysed differences between groups (Supplemental Figure 1) and ageing acceleration (or rather deceleration) as difference between presumable chronological age and DNA methylation age ().
Authors’ contributions
V.M.H and M.S.R.B collected and prepared DNA for the Southern African sample source, providing critical insights into lifestyle relevant data. V.M.H and W.J. generated and provided the Southern African genome validation data (manuscript in preparation); L.E. and V.M.H conceived of the study; B.L. implemented code for the U-test based analysis and wrote the first draft, S.T. contributed computational and statistical data analyses; A.G. implemented linear regression-based differential methylation analysis, leukocyte composition and batch effect normalization, and revised the manuscript; L.E. supervised and led the analysis; H.P. managed the Illumina array samples. All authors participated in writing or revising the draft.
Declarations
Ethics approval
granted through the Ministry of Health and Social Services in Namibia, with additional approvals from local community leaders, as well as approvals granted by independent academic and national Human Research Ethics Committee’s (HRECs) in South Africa.
Consent for publication
No personal data are included. All samples were deidentified.
Consent to participate
All subjects were consented and deidentified. No personal data are included.
Availability of data and materials
Data from KhoeSan sample data will not be publicly released because of sensitivity to KhoeSan data control requests. KhoeSan sequence or methylation data are available upon request to V.M.H.
Supplemental Material
Download Zip (4 MB)Acknowledgements
The authors would like to thank all the study participants and every day local Namibians and South Africans, who over the last decade have made this study possible. Specifically, we acknowledge the late Professor Chris F. Heyns (1949–2014) from the University of Stellenbosch and retired Professor Philip Venter from the University of Limpopo, South Africa, and more recently Dr. Hagen E.A. Förtsch from Windhoek Central Hospital, Namibia, for technical and administrative assistance with recruitments. We thank Kristin Harper and Mia DeFino for constructive and technical input and providing medical writing and editing support. Marypat Jones and Ursula Harper ran the Illumina arrays at the National Human Genome Research Genomics Core.
Disclosure statement
No potential conflict of interest was reported by the authors.
Supplementary material
Supplemental data for this article can be accessed here.
Additional information
Funding
References
- Heyn H, Moran S, Hernando-Herraez I, et al. DNA methylation contributes to natural human variation. Genome Res. 2013;23(9):1363–1372.
- Quintana-Murci L. Genetic and epigenetic variation of human populations: an adaptive tale. C R Biol. 2016;339(7–8):278–283.
- Beyan H, Down TA, Ramagopalan SV, et al. Guthrie card methylomics identifies temporally stable epialleles that are present at birth in humans. Genome Res. 2012;22(11):2138–2145.
- Busche S, Shao X, Caron M, et al. Population whole-genome bisulfite sequencing across two tissues highlights the environment as the principal source of human methylome variation. Genome Biol. 2015;16:290.
- Chen YC, Sudre G, Sharp W, et al. Neuroanatomic, epigenetic and genetic differences in monozygotic twins discordant for attention deficit hyperactivity disorder. Mol Psychiatry. 2018;23(3):683–690.
- Fraga MF, Ballestar E, Paz MF, et al. Epigenetic differences arise during the lifetime of monozygotic twins. Proc Natl Acad Sci U S A. 2005;102(30):10604–10609.
- Schuster SC, Miller W, Ratan A, et al. Complete Khoisan and Bantu genomes from southern Africa. Nature. 2010;463(7283):943–947.
- Gronau I, Hubisz MJ, Gulko B, et al. Bayesian inference of ancient human demography from individual genome sequences. Nat Genet. 2011;43(10):1031–1034.
- Schlebusch CM, Skoglund P, Sjodin P, et al. Genomic variation in seven Khoe-San groups reveals adaptation and complex African history. Science. 2012;338(6105):374–379.
- Veeramah KR, Wegmann D, Woerner A, et al. An early divergence of KhoeSan ancestors from those of other modern humans is supported by an ABC-based analysis of autosomal resequencing data. Mol Biol Evol. 2012;29(2):617–630.
- Trustwell A, Hansen J. Medical research among the !Kung. In: Lee R, DeVore I, editors. Kalahari Hunter-Gatherers: studies of the !Kung San and their neighbors. Cambridge, Mass: Harvard University Press; 1976. p. 166–194.
- Lee R. !Kung Spatial organization: an ecologival and Historical perspective. In: Lee R, DeVore I, editors. Kalahari Hunter-Gatherers: studies of the !Kung San and their neighbors. Cambridge, Mass: Harvard University Press; 1976. p. 73–97.
- Low C. Gatherers of knowledge: Namibian Khoisan healers and their world of possibilities. In: Johnson D, editor. The changing landscape of education in Africa: quality, equality and democracy. Oxford: Symposium Books; 2008. p. 164.
- LaBarre BA, Goncearenco A, Petrykowska HM, et al. MethylToSNP: identifying SNPs in Illumina DNA methylation array data. Epigenetics Chromatin. 2019;12(1):79.
- Du P, Zhang X, Huang -C-C, et al. Comparison of Beta-value and M-value methods for quantifying methylation levels by microarray analysis. BMC Bioinformatics. 2010;11:587.
- Grummt I, Ladurner AG. A metabolic throttle regulates the epigenetic state of rDNA. Cell. 2008;133(4):577–580.
- Mehta S, Nijhuis A, Kumagai T, et al. Defects in the adherens junction complex (E-cadherin/beta-catenin) in inflammatory bowel disease. Cell Tissue Res. 2015;360(3):749–760.
- Samuelov L, Sprecher E, Paus R. The role of P-cadherin in skin biology and skin pathology: lessons from the hair follicle. Cell Tissue Res. 2015;360(3):761–771.
- Vite A, Li J, Radice GL. New functions for alpha-catenins in health and disease: from cancer to heart regeneration. Cell Tissue Res. 2015;360(3):773–783.
- Peters TJ, Buckley MJ, Statham AL, et al. De novo identification of differentially methylated regions in the human genome. Epigenetics Chromatin. 2015;8:6.
- Horvath S. DNA methylation age of human tissues and cell types. Genome Biol. 2013;14(10):R115.
- Hannum G, Guinney J, Zhao L, et al. Genome-wide methylation profiles reveal quantitative views of human aging rates. Mol Cell. 2013;49(2):359–367.
- GTEx Consortium. Genetic effects on gene expression across human tissues. Nature. 2017;550(7675):204–213.
- Cordain L, Eaton SB, Sebastian A, et al. Origins and evolution of the Western diet: health implications for the 21st century. Am J Clin Nutr. 2005;81(2):341–354.
- Engelken J, Carnero-Montoro E, Pybus M, et al. Extreme population differences in the human zinc transporter ZIP4 (SLC39A4) are explained by positive selection in Sub-Saharan Africa. PLoS Genet. 2014;10(2):e1004128.
- Noh H, Paik HY, Kim J, et al. The alteration of zinc transporter gene expression is associated with inflammatory markers in obese women. Biol Trace Elem Res. 2014;158(1):1–8.
- Hardy AB, Prentice KJ, Froese S, et al. Zip4 mediated zinc influx stimulates insulin secretion in pancreatic beta cells. PLoS One. 2015;10(3):e0119136.
- Li M, Zhang Y, Liu Z, et al. Aberrant expression of zinc transporter ZIP4 (SLC39A4) significantly contributes to human pancreatic cancer pathogenesis and progression. Proc Natl Acad Sci U S A. 2007;104(47):18636–18641.
- Fagny M, Patin E, MacIsaac JL, et al. The epigenomic landscape of African rainforest hunter-gatherers and farmers. Nat Commun. 2015;6:10047.
- Petersen DC, Libiger O, Tindall EA, et al. Complex patterns of genomic admixture within southern Africa. PLoS Genet. 2013;9(3):e1003309.
- Team RC. R: a language and environment for statistical computing. Vienna, Austria: R Foundation for Statistical Computing; 2016.
- Heiss JA, Just AC. Improved filtering of DNA methylation microarray data by detection p values and its impact on downstream analyses. Clin Epigenetics. 2019;11(1):15.
- Aryee MJ, Jaffe AE, Corrada-Bravo H, et al. Minfi: a flexible and comprehensive Bioconductor package for the analysis of Infinium DNA methylation microarrays. Bioinformatics. 2014;30(10):1363–1369.
- Pidsley R, Y Wong CC, Volta M, et al. A data-driven approach to preprocessing Illumina 450K methylation array data. BMC Genomics. 2013;14:293.
- Morris TJ, Butcher LM, Feber A, et al. ChAMP: 450k chip analysis Methylation Pipeline. Bioinformatics. 2014;30(3):428–430.
- Ritchie ME, Phipson B, Wu D, et al. limma powers differential expression analyses for RNA-sequencing and microarray studies. Nucleic Acids Res. 2015;43(7):e47.
- Zhou W, Laird PW, Shen H. Comprehensive characterization, annotation and innovative use of Infinium DNA methylation BeadChip probes. Nucleic Acids Res. 2016;gkw967. DOI:10.1093/nar/gkw967
- Heiss JA, Brenner H. Between-array normalization for 450K data. Front Genet. 2015;6:92.
- Houseman EA, Accomando WP, Koestler DC, et al. DNA methylation arrays as surrogate measures of cell mixture distribution. BMC Bioinformatics. 2012;13:86.
- Reinius LE, Acevedo N, Joerink M, et al. Differential DNA methylation in purified human blood cells: implications for cell lineage and studies on disease susceptibility. PLoS One. 2012;7(7):e41361.
- Ren X, Kuan PF, Hancock J. methylGSA: a Bioconductor package and Shiny app for DNA methylation data length bias adjustment in gene set testing. Bioinformatics. 2019;35(11):1958–1959.
- Supek F, Bošnjak M, Škunca N, et al. REVIGO summarizes and visualizes long lists of gene ontology terms. PLoS One. 2011;6(7):e21800.