
 ?Mathematical formulae have been encoded as MathML and are displayed in this HTML version using MathJax in order to improve their display. Uncheck the box to turn MathJax off. This feature requires Javascript. Click on a formula to zoom.
ABSTRACT
Although analysis of maternal plasma cell-free content has been employed for screening of genetic abnormalities within a pregnancy, limited attention has been paid to its use for the detection of adverse pregnancy outcomes (APOs) based on placental function. Here we investigated cell-free DNA and RNA content of 102 maternal and 25 cord plasma samples. Employing a novel deconvolution methodology, we found that during the first trimester, placenta-specific DNA increased prior to the subsequent development of gestational diabetes with no change in patients with preeclampsia while decreasing with maternal obesity. Moreover, using cell-free RNA sequencing, APOs revealed 71 differentially expressed genes early in pregnancy. We noticed the upregulation of S100A8, MS4A3, and MMP8 that have been already associated with APOs but also the upregulation of BCL2L15 and the downregulation of ALPL that have never been associated with APOs. We constructed a classifier with a positive predictive ability (AUC) of 0.91 for APOs, 0.86 for preeclampsia alone and 0.64 for GDM. We conclude that placenta-specific cell-free nucleic acids during early gestation provide the possibility of predicting APOs prior to the emergence of characteristic clinical features.
Introduction
Most modalities for monitoring placenta and pregnancies consist of tests that require invasive methods that can themselves lead to complications. However, more recently the focus has shifted to non-invasive testing, such as ultrasound imaging of foetal structures and umbilical blood flow, and non-invasive prenatal screening (NIPS), designed to detect chromosome abnormalities [Citation1]. Despite this recent focus, limited attention has pivoted to the detection of placental health as a surrogate for the well-being of pregnancy and thereby maternal and foetal health [Citation2]. We and other investigators have recently developed novel imaging technology related to free-breathing magnetic resonance imaging including arterial spin labelling methodology that revealed detectable differences in-vivo during the early second trimester heralding subsequent development of ischaemic placental disease [Citation3]. Here we sought to extend our work on pregnancy monitoring using imaging, by leveraging state of the art approaches in sequencing cell-free DNA and RNA.
There have been some recent investigations focused on detecting cell-free transcriptomics in predicting specific adverse pregnancy outcomes (APOs) such as preterm labour [Citation4] or attempts at predicting the role of inflammation in preterm labour [Citation5]. Building upon such investigations, we wished to extend some of our previous work in the ex-vivo term human placenta [Citation6,Citation7], towards non-invasive detection of placental DNA methylation and related transcriptome early and late in pregnancy to determine the subsequent development of APOs.
To this end, we undertook the present investigation with cell-free DNA and RNA obtained from the maternal circulation, but first, we developed the ability to deconvolute tissue-of-origin compositions from the cfDNA methylation data. Although several approaches have previously been developed towards achieving deconvolution of tissue compositions based on cfDNA methylation data [Citation8,Citation9], these methods all used population-average methylation rate of CpG sites, which limited their ability to detect minor tissue fractions from the mixture, especially when based on low-coverage sequencing data. The low coverage of our WGBS data and the low placenta cfDNA percentage during early pregnancy motivated us in developing a sensitive tissue deconvolution method. Our method has two novel features: (1) unlike the common approaches using population-average methylation rate of CpG sites [Citation8–10], we exploited the joint methylation states of multiple adjacent CpG sites on an individual DNA sequencing read to enhance the signal-to-noise ratio. Therefore, our approach is sensitive to minimal contribution arising from various tissues. We have previously developed this read-based approach to deconvolute trace amounts of tumour DNA from the plasma background [Citation11]. Here we further extend this approach from two-class to K-class tissue deconvolution by designing an Expectation-Maximization optimization algorithm. (2) Our approach aggregates the probability of all the reads to derive the percentage of each tissue type, which, combined with the feature (1), allows our approach to work on extremely low-coverage sequencing data. We validated this method in silico using mixes of DNA sequencing reads from bulk placenta and white blood cells at known percentages and varied sequencing coverage (Supplementary File). Employing this methodology along with RNA sequencing, we tested our hypothesis that cell-free DNA methylation and RNA from maternal circulation may correlate with placental health and thereby differentiate gestational disorders from normal gestation free of accompanying complications.
Materials and Methods
Subjects, sample collection and processing
PARENTs is a prospective cohort study, approved by the UCLA Institutional Review Board (IRB), in which we recruited a diverse group of women in the first trimester of pregnancy between February 2017 and January 2019, in order to study the mechanisms for and prediction of APOs (clinicaltrials.gov: #NCT02786420). We defined APOs as pregnancy with gestational diabetes (GDM), preterm labour, or pregnancy complicated by hypertensive disease of pregnancy, foetal growth restriction (FGR) or placental abruption, collectively termed ischaemic placental disease (IPD) [Citation12,Citation13]. Once pregnancy was confirmed, informed consent for participation was obtained and women were seen at three study visits during pregnancy and again at delivery. We collected data from telephone interviews, ultrasound and MRI studies, and chart abstractions. Maternal biospecimens (serum, plasma, urine) at antepartum study visits and delivery (placenta, cord blood) were collected, processed, and stored.
We enrolled a total of 189 subjects, 29 of these subjects have not delivered to date. Of the 160 subjects who have delivered, there were 99 normal pregnancies and 61 with APOs. These APOs were divided in IPD (ischaemic placental disease) (n = 37), consisting of preeclampsia (PreX), gestational hypertension (gHTN) and intrauterine growth restriction (IUGR), IPD with gestational diabetes (GDM) n = 4; IPD with chronic hypertension (cHTN) n = 3; cHTN only n = 11 and GDM only n = 13. We excluded the subjects with cHTN from the early DNA and RNA biomarker detection, although included in the pre-pregnancy body mass index (BMI) analyses. For the plasma cell-free nucleic acid study, we examined, 9 subjects bearing normal pregnancies, 5 subjects with preeclampsia, 3 subjects with gHTN and 7 subjects with GDM (who had been recruited between April 2017 and July 2018). Since PARENTs is an ongoing prospective cohort study, we could not selectively include more subjects with APOs but were limited in numbers, by having to rely on the actual subsequent occurrence of these conditions during pregnancy.
Gestational diabetes was defined as any degree of glucose intolerance with an initial recognition during pregnancy [Citation14]. The majority of women were diagnosed by the two-step Carpenter-Coustan (CC) criteria between 24 and 28 weeks gestation. This was based on an initial screen of a 50-g glucose challenge test (GCT). Women with glucose values >135 mg/dL underwent fasting diagnostic 3-hour 100-g glucose tolerance test (GTT). Women diagnosed with GDM were managed according to the American College of Obstetricians and Gynaecologists (ACOG) practice guidelines [Citation14].
Preeclampsia was defined as blood pressure (BP) 140/90 or higher on two occasions at least four hours apart after 20 weeks of gestation with a previously normal blood pressure, and proteinuria of 300 mg/24 hours or more [Citation15]. In the absence of proteinuria, preeclampsia was defined as new-onset hypertension with new onset of thrombocytopenia, renal insufficiency (serum creatinine greater than 1.1 mg/dL), impaired liver function (elevated liver transaminases to twice the normal concentration), pulmonary oedema, cerebral or visual symptoms. Gestational hypertension is hypertension developing after 20 weeks of gestation not associated with systemic features of preeclampsia (e.g., proteinuria, liver involvement, etc.). Chronic hypertension, on the other hand, was defined as blood pressure (BP) of 140/90 mm Hg or higher, that either predates pregnancy or develops before 20 weeks of gestation. Women diagnosed with these conditions were managed according to ACOG practice guidelines [Citation15].
Peripheral venous blood was collected into EDTA-coated tubes. Blood was then centrifuged at 2000 X g for 7 minutes at 4°C, in order to collect only the plasma fraction. Plasma was centrifuged at 16,000 X g for 10 min at 4°C to remove all the residual cells, aliquoted and stored at −80°C. Cell-free DNA and RNA were extracted from 200 μL of plasma using the QIAmp MiniElute Virus Spin kit (Qiagen), and the miRNeasy serum/plasma kit (Qiagen), respectively. Total RNA and DNA were quantified using the Qubit RNA HS Assay kit and Qubit dsDNA HS Assay kit (Thermofisher Scientific), respectively. RNA integrity was verified using the Agilent High sensitivity RNA Screen Tape System (Agilent) on a 2200 TapeStation System (Agilent). We used 10 μL of the extracted DNA or RNA (ranging from 2 to 4 ng of total DNA or RNA). Whole-genome bisulphite libraries were prepared using the pico methyl-Seq library prep kit (Zymo Research) according to manufacturer’s instructions. The RNA-sequencing (RNA-seq) library construction was performed using the ultra-low input specific kit, NuGen Ovation SoLo RNA-Seq kit with Human rRNA AnyDeplete kit (NuGen), according to the manufacturer’s instructions. Libraries were sequenced using 100 bp single-end reads on the Hiseq4000 System (Illumina). We first used the FastQC (version v0.11.8) program to assess the quality of our sequenced reads. All the samples passed this step of quality control before proceeding further into analysis.
Whole Genome Bisulphite Sequencing (WGBS) data processing and deconvolution analyses
Bs-seeker2 (version v2.1.0) was employed to align the reads to the human reference genome (hg19) and following removal of PCR duplications using the rmdup function in samtools (v1.9), methylated cytosines were detected. Each read was translated into binary values (0 or 1) indicating the methylation state of each CpG site: value 0 represents unmethylated CpG while value 1 the methylated CpG.
We aimed to infer T-tissue-type composition of a plasma cfDNA sample, which is denoted as a composition vector satisfying
and
and
is the cfDNA fraction of tissue t in the plasma. Given a set of T-tissue-type methylation signatures denoted as
(here we used the methylation signatures from Sun et al. 2015 [Citation8]), we used a collection of
cfDNA sequencing reads that were mapped into the genomic regions of all these methylation signatures. This methylation data at individual read level could be represented by a set of
sequencing reads or fragments
, where each read
was a sequence of binary values (0 or 1), indicating the methylation state of each CpG site covered by the
-th read (or fragment). Based on these denotations, we formulated the tissue composition inference problem as a maximum likelihood problem, which estimates the tissue composition
in plasma cfDNAs by maximizing the likelihood
. This is formally expressed as shown below:
where the log-likelihood is the summation of the log-likelihood of each cfDNA sequencing read:
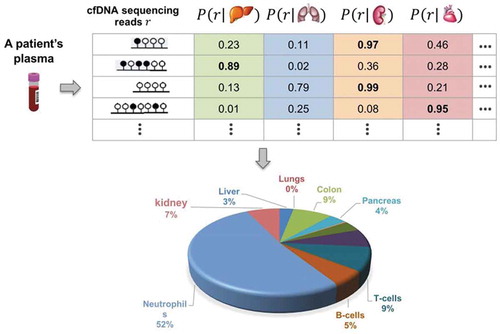
This problem formulation is illustrated in .
Figure 1. Illustration of tissue composition inference problem. Scheme identifying tissue-of-origin likelihood of cfDNA sequencing reads and their use for inferring normal tissue composition of plasma cfDNAs
Since we have T parameters in this formulation, we cannot use the grid searching for each parameter as it is overly time consuming. Instead, we could employ the Expectation-Maximization (EM) clustering algorithm [Citation16] to solve this problem, where each tissue type could be regarded as a cluster with unknown prior probability
and each read regarded as an object to be clustered. The EM clustering algorithm [Citation16] typically introduced a missing value or latent random variable
for each
to indicate which tissue type
this read originated from, i.e.,
and
. This latent variable
allows the categorical distribution
, therefore we have
. We rewrote
in Eq. (Equation3
(2)
(2) ) as
where is the tissue-of-origin likelihood of the cfDNA
for tissue
, and
is the methylation signature of tissue
(i.e., the methylation level provided by Sun et al. 2015 [Citation8]) in the marker’s region that
is mapped to. Let
denote the posterior probability of
, i.e.,
. According to the EM algorithm, we deduced the following alternative steps:
According to the EM algorithm, starting with a random initial value and iteratively performing EquationEqs. (4)
(4)
(4) and (Equation5
(5)
(5) ) this objective function (i.e., the log-likelihood function) converged to a local maximum of the log-likelihood function. We repeated this EM algorithm with different random initialized values of
, and chose the solution with the maximum log-likelihood. In the E-step, the tissue-of-origin likelihood of a cfDNA
for tissue t could be easily calculated as
, where
denotes
and
and
are the numbers of methylated and unmethylated CpGs in
, respectively.
Analysis of Differentially expressed genes (DEG) and RNA-sequencing validation by qRT-PCR
The RNA-seq reads were aligned to the human reference genome (hg19) using the STAR (v 2.5.2b) software which keeps unique alignments and those with up to 4 mismatches. We used the – quantMode GeneCounts option in STAR that counts the number of reads per gene while mapping. Starting with the RNA-Seq read counts matrix, we then used the DESEquationeq2(2)
(2) (version v1.20.0) package in R to perform data normalization (rlog function) and DEG analysis. We set a cut-off for adjusted P value ≤0.05 and a fold change ≥1 or ≤ −1.
For RT-PCR validation, the RNA was extracted following the same procedure described above and was subsequently converted into cDNA and pre-amplified using the Ovation PicoSL WTA system V2 (NuGen). We then performed the qRT-PCR with the TaqMan Fast Advanced Master Mix (Applied Biosystems) and the commercially available probes for the selected genes: BCL2L15 (Hs01017582_m1), ALPL (Hs01029144_m1), MS4A3 (Hs00960994_m1), S100A8 (Hs00374264_g1), MMP8 (Hs01029057_m1), and CSH2 (Hs00831897_s1). All the tested gene probes contained the FAMTM reporter dye. GAPDH (Hs01758991_g1) was used as the internal control and these probes had the VICTM reporter dye.
Classification models and early biomarker discovery
We used the Rlog normalized counts obtained with DESEquationeq2(2)
(2) from the cfRNA seq data in the 1st trimester of pregnancy. We selected the 40 upregulated genes in the 1st trimester compared to non-pregnant controls, with a P-adj ≤0.1 and a log2FC ≥1 or ≤ −0.1. Feature selection and biomarker discovery were performed using the glmnet package v2.0–16 for R v3.4.4 [Citation17]. Features were selected using logistic regression (LR) with the elastic-net regularization. The model was trained using a leave-one-out cross-validation (LOOCV) and an additional internal 7-fold cross-validation was used to select the penalty parameter, lambda, to minimize the mean absolute error or misclassification error of the predictions. Features with coefficients greater than zero after the elastic-net regularization were selected as potential biomarkers. Receiver operator characteristic (ROC) curves were constructed using the ROCplot package in R [Citation18].
Statistical analyses
Statistical analysis was performed using SPSS 23.0 software (SPSS Inc.). For multi-group or time-based comparisons, ANOVA models followed by Bonferroni correction were employed. The Mann–Whitney U test was used for non-paired comparisons of two groups (e.g., Normal versus GDM and Normal versus PreX/gHTN or Overweight versus Lean and Obese versus Lean) in the deconvolution analysis. The unpaired Student’s t test was used for the quantitative real-time PCR calculations. All the P values were two sided and the threshold for significance (α) was set at 0.05 unless specified otherwise. The adjusted P values in RNA sequencing analysis were calculated in DESEquationeq2(2)
(2) that used Benjamin-Hochberg correction [Citation19].
Results
Tissue-of-origin contribution with advancing gestation: a focus on pregnancies with adverse outcomes
We obtained plasma samples from twenty-six pregnant women at the latter part of the first trimester/early second trimester (12–17 weeks), latter part of second trimester (18–22 weeks), and third trimester (35–37 weeks) during pregnancy, at delivery and from cord blood for a total of 5 different samples obtained longitudinally from each subject. We also collected plasma from seven women who self-reported to be not pregnant, to serve as controls. In Supplementary Table 1, we have summarized detailed demographic information about the subjects that includes maternal age, baby/placental sex, pre-pregnancy body mass index (BMI; kg/m2) referenced categories, mode of delivery, and any adverse outcomes that ensued during pregnancy.
We first focused on cell-free nucleic acid content in the maternal plasma to gauge placental health, especially in the early phase of pregnancy, when clinical and laboratory features relevant to a high-risk pregnancy have not yet emerged. To this end, we first extracted cell-free DNA that was subjected to whole-genome bisulphite sequencing, followed by quantification of CG methylation of DNA. A decreasing trend in total CG methylation levels was observed with advancing gestation (). Since placental DNA is hypomethylated [Citation20] in comparison to other tissues (), increasing DNA contribution from the placenta with advancing gestation could affect the total CG methylation profile and underlie the observed decline. To confirm this possibility, we undertook a deconvolution analysis with the goal of identifying the contribution to total cfDNA from each tissue/cell-of-origin.
Figure 2. Changes in DNA methylation and cfDNA composition with advancing gestation. (a) The box plot shows the total CGs methylation in all the subjects (n = 26) recruited in the study across all pregnancies and in cord blood. (b) The box plot shows the total CpGs methylation over the whole genome for 12 normal tissue types and placenta. The normal tissues include four samples of heart, two of colon, and one of adipose tissue, adrenal gland, brain, liver, oesophagus, lung, pancreas and small intestine. The placenta includes 4 samples from normal individuals. The WGBS data for B-cells and neutrophils are from Hodges et al. 2009 [Citation21] and the rest of the normal tissue are from Roadmap Epigenomics Mapping Consortium (ftp://ftp.genboree.org/EpigenomeAtlas/). The placenta data are from Jensen et al. 2015 [Citation22] with mCG calculated as # of methylated CpGs/# of all CpGs from the sequencing data. (c) The plot shows the placenta relative percentage in maternal plasma during pregnancy. The plasma from 7 nulliparous young never pregnant women was used as controls and is represented with a grey bar. (D)The plot shows the deconvolution analysis result for seven tissues. Each bar is an average of the results we obtained from every single subject at each time point of the study. (e) The panel is a whole picture of the deconvolution results obtained from the cell-free DNA analyses. Each dot represents a single subject. (#) indicates statistically significant changes in comparison to the non-pregnant controls by the one-way ANOVA followed by Bonferroni correction. (#) p < 0.05; (##) p < 0.01. (*) indicates statistically significant changes when compared to 1st Trimester values by the one-way ANOVA followed by Bonferroni correction. (*) P < 0.05; (**) P < 0.01
![Figure 2. Changes in DNA methylation and cfDNA composition with advancing gestation. (a) The box plot shows the total CGs methylation in all the subjects (n = 26) recruited in the study across all pregnancies and in cord blood. (b) The box plot shows the total CpGs methylation over the whole genome for 12 normal tissue types and placenta. The normal tissues include four samples of heart, two of colon, and one of adipose tissue, adrenal gland, brain, liver, oesophagus, lung, pancreas and small intestine. The placenta includes 4 samples from normal individuals. The WGBS data for B-cells and neutrophils are from Hodges et al. 2009 [Citation21] and the rest of the normal tissue are from Roadmap Epigenomics Mapping Consortium (ftp://ftp.genboree.org/EpigenomeAtlas/). The placenta data are from Jensen et al. 2015 [Citation22] with mCG calculated as # of methylated CpGs/# of all CpGs from the sequencing data. (c) The plot shows the placenta relative percentage in maternal plasma during pregnancy. The plasma from 7 nulliparous young never pregnant women was used as controls and is represented with a grey bar. (D)The plot shows the deconvolution analysis result for seven tissues. Each bar is an average of the results we obtained from every single subject at each time point of the study. (e) The panel is a whole picture of the deconvolution results obtained from the cell-free DNA analyses. Each dot represents a single subject. (#) indicates statistically significant changes in comparison to the non-pregnant controls by the one-way ANOVA followed by Bonferroni correction. (#) p < 0.05; (##) p < 0.01. (*) indicates statistically significant changes when compared to 1st Trimester values by the one-way ANOVA followed by Bonferroni correction. (*) P < 0.05; (**) P < 0.01](/cms/asset/297b5074-144f-4af3-b3f5-f00ad8c6de5e/kepi_a_1816774_f0002_oc.jpg)
The cfDNA content was de-convoluted into seven major tissues/cells-of-origin: liver, pancreas, heart, placenta, T-cells, B-cells, and neutrophils. We developed a new deconvolution approach (detailed in materials and methods) that revealed a large contribution from placenta in our cfDNA samples, which increased with advancing gestation, reaching peak values in the third trimester and at delivery (). The inverse relationship noted between the placental contribution and the total CG methylation provides some evidence that placental DNA may be responsible for the decrease in global DNA methylation observed in the third trimester and at delivery. We also observed a slight decrease in the B-cell and T-cell contribution, with a more prominent reduction evident in the neutrophil contribution with advancing gestation (). Because neutrophils are the most abundant source of cfDNA in maternal plasma, the increase in placental contribution could also be responsible for this relative decreasing trend. In addition, we observed an increase in pancreatic cfDNA fraction across pregnancy perhaps signalling the expected relative insulin resistant state that is characteristic of late pregnancy. Compared to maternal cfDNA concentrations, an increased amount of cfDNA originating from the heart and a decrease from liver was seen in cord blood, perhaps reflective of the developmental state. The non-pregnant controls displayed low background values of placental DNA (mean of 0.7%), while subjects bearing normal pregnancies demonstrated 4-fold higher values (mean of 4%), supporting our detection of placental DNA even during early pregnancy, when the placental contribution is low.
In our cohort of participants, we sought to differentiate between subjects experiencing APOs from those bearing normal/unaffected pregnancies. In this comparison, we included normal pregnancies (Normal), gestational diabetics (GDM) and preeclampsia/gestational hypertensive (PreX/gHTN) groups (Supplementary Table 1). Based on our deconvolution analysis, we found no major differences in any tissue except for placenta and pancreas (Supplementary Figure 2 and Figure 3a-B).
The placental fraction in GDM significantly increased compared to normal pregnancies in the first trimester. This trend persisted through the second and third trimesters as well, although not reaching statistical significance. During the first trimester, intra-group variability was noted ( – circled) perhaps due to co-existing obesity present in one of the GDM subjects. This early detection of a difference between GDM (mean of 7.2%) and normal (mean of 4%) pregnancies based on the placental fraction is of interest for the future development of predictive biomarkers. Interestingly, a non-placental tissue-of-origin, namely pancreatic cfDNA fraction also significantly increased only in the 1st trimester in subjects who subsequently developed GDM, which is an insulin-resistant state (Figure S2). Additionally, pancreatic cfDNA also increased in the GDM cord blood, perhaps heralding a future state of pancreatic dysregulation in the offspring (Figure S2). Analysis of gestation-matched PreX/gHTN versus normal did not reveal any significant differences (). We also weighed the post-parturient placentas and observed no statistically significant differences between groups. While the birth weight and head circumference of the offspring demonstrated a statistical reduction, overall both measurements were within appropriate for gestational age established norms (except for one) consistent with adequate clinical management () and control of the GDM state.
Figure 3. Maternal plasma cfDNA composition and total CG methylation analysis in APOs. Box plot of the placental contribution expressed in percentage within the GDM (n = 7) (a) group or PreX/gHTN (n = 8) group (b) compared to subjects that did not develop any adverse outcomes during pregnancy (Normal; n = 9). The black circle (A) is to highlight the 1st trimester result for the single obese subject included in the GDM group. (c) Bar plot representing placental weight and baby’s measurements (weight, length, and head circumference) in normal, GDM and PreX/gHTN. Percentage of total CGs methylation in GDM (d) and PreX/gHTN groups (e) compared to the Normal group. The P-values were obtained by the non-parametric Mann-Whitney U test. Each dot represents an individual subject. (#) indicates statistically significant changes with respect to the non-pregnant. (#) p < 0.05; (##) p < 0.01
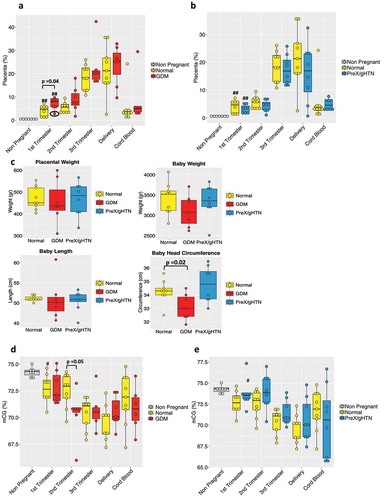
Again, we noted no major differences in the total CG methylation percentage between all three groups with advancing gestation, except in GDM during the second trimester where lower total CG methylation when compared to normal pregnancies was seen (). This may be due to lower placental methylation compared to that from other sources of cfDNA. In contrast, a trend towards total CG hypermethylation was observed in PreX/gHTN when compared to gestation-matched normal pregnancies (), distinguishing this sub-group from GDM subjects as well.
Impact of pre-pregnancy body mass index on cell-free DNA
We next examined inter-body mass index (BMI) differences by sub-grouping subjects based on their pre-pregnancy BMI into lean (BMI: 18.5 to 24.9 kg/m2), overweight (25–29.9 kg/m2) and obese (>30 kg/m2) categories. In the obese sub-group, one subject developed GDM, while several developed PreX/gHTN. Our deconvolution analysis revealed a decreasing trend in the placental contribution to cfDNA in maternal plasma at all trimesters in the obese versus lean, with overweight showing an intermediate trend ().
Figure 4. BMI effect on maternal plasma cfDNA. (a) The box plot shows placental tissue's relative contribution to the total cfDNA pool according to BMI sub-groups (lean, n = 9; overweight, n = 10; obese, n = 7). The non-pregnant group is represented in the graph as a baseline threshold. No information regarding their BMIs was available. (b) Bar plot of total CG methylation percentage in the different BMI groups during pregnancy and in cord blood. (c) Bar plot representing the placental weight and baby’s measurements (weight, length, and head circumference) in each BMI sub-group is shown. Each dot in the graph represents a single subject in the study. The P-values were obtained by the non-parametric Mann-Whitney U test. (*) indicates statistically significant differences with respect to lean subjects. (*) p < 0.05; (**) p < 0.01
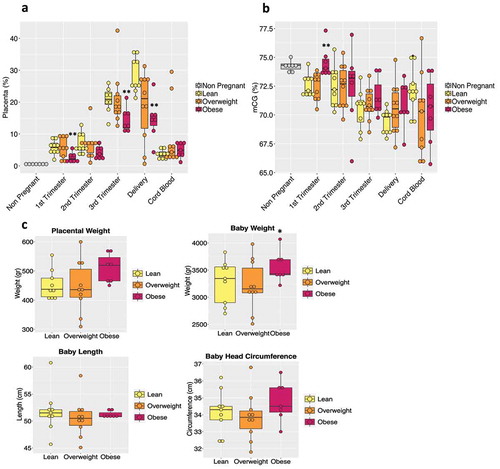
In contrast, no such change was evident in the contribution from other tissues/cells (Supplementary Figure 3). Supportive of this observation, total CG hypermethylation occurred in obese subjects when compared to normal, beginning in the first trimester, with the overweight category displaying intermediate levels (). To provide some context to these findings related to the placental contribution towards total CG methylation, we examined post-parturient placental weights and observed heavier placentas in the obese group along with higher trends in birth weight and head circumference of the offspring (). While the state of obesity is often associated with a chronic state of inflammation, no similar changes were observed with contributions from inflammatory cells, namely T-cells, B-cells, and neutrophils (Supplementary Figure 3).
Deciphering Cell-free RNA signatures during pregnancy
We also examined plasma cfRNA by RNA-seq analysis conducted at all trimesters of pregnancy, at delivery and in the umbilical cord blood. We first focused on tracing back the tissues and cells of origin in our cfRNA samples. For this purpose, we used SaVanT [Citation23], a web-based signature visualization tool that utilizes gene counts from the RNA-seq analysis, in order to provide an overview of the tissues and cells that are present in the cfRNA mixture. The cfRNA has been deconstructed into 16 different tissues (Supplementary Figure 4). Upon focusing on the placental tissue of origin during gestation, we observed a parallel trend to that seen with cfDNA. As expected, placental cfRNA signature increased with gestation (). We then examined the different adverse pregnancy outcomes in our subjects. The placenta-specific signature in GDM patients although not statistically significant trended higher compared to subjects carrying normal pregnancies (), mimicking the results obtained with cfDNA (). In contrast, the placental signature in subjects who developed preeclampsia or gestational hypertension was distinct from that observed with cfDNA. Again, not achieving statistical significance, the placenta-specific cfRNA trended higher in PreX/gHTN during gestation, when compared to normal pregnancy, akin to that seen in GDM subjects (). We also examined cfRNA in the different BMI categories of our cohort. Similar to cfDNA signatures, the placental cfRNA signature especially in the first trimester revealed a lower trend in obese subjects when compared to normal subjects, with the overweight group being in between the two ().
Figure 5. Deciphering cfRNA content with advancing gestation in normal pregnancy and in pregnancies with adverse outcomes. The box-plot shows the cfRNA placental (a) or bone marrow (e) signature in maternal plasma during pregnancy. The plasma from 7 nulliparous young never pregnant women was used as controls and is represented with a grey bar. (#) indicates statistically significant changes in comparison to non-pregnant controls by the one-way ANOVA followed by Bonferroni correction. (#) p < 0.05; (##) p < 0.01. (*) indicates statistically significant changes when compared to 1st Trimester values by the one-way ANOVA followed by Bonferroni correction. (*) P < 0.05; (**) P < 0.01
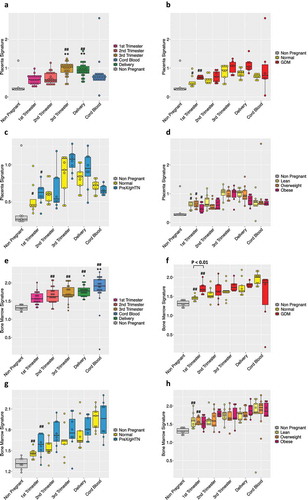
To closely mimic what we performed in cfDNA, we finally examined the immune cellular content within the total cfRNA. As observed with cfDNA, we did not notice any significant changes in cfRNA contribution from mature immune cells (Supplementary Figure 5). In contrast, when we examined immune cells arising from the bone marrow, which is a primary source of newly formed blood cells (progenitors, stem cells), we observed an increasing trend () with advancing gestation. This gestation induced change in bone marrow-derived cellular content is interesting given the fact that these cells are essential for successful placentation during the early phase and continue to be key in maintaining the pregnancy state [Citation24–26].
A similar trend was displayed in subjects who developed pregnancy-related complications. The cfRNA contribution from the bone marrow cells towards total cfRNA in subjects who later developed gestational diabetes was higher in comparison to that of normal pregnancies. Especially in the first trimester of pregnancy, this difference between GDM and normal pregnancies achieved statistical significance (). In subjects who develop preeclampsia, gestational hypertension or present with obesity, we noted a similar increasing trend with advancing gestation when compared to normal pregnancies (), albeit not statistically significant.
Cell-free Transcriptome in pregnancies with adverse pregnancy outcomes
Subsequently, we analysed the RNA-seq results focusing on specific genes that were differentially expressed during pregnancy ( and Supplementary Figure 6). We zeroed in on the first and second trimesters of pregnancy, particularly upon detection of differentially expressed genes prior to the development of symptomatology characteristic of a high-risk pregnancy. In comparing all the first and second trimesters of pregnant subjects with non-pregnant controls, we detected 71 differentially expressed genes (DEGs) (), 29 of them being upregulated as early as in the first trimester, while only 3 genes were downregulated.
Figure 6. 1st and 2nd trimesters differentially expressed genes (DEG). (a) Heatmap showing in a blue-red gradient the DEG genes in the 1st and 2nd trimesters of pregnancy (n = 26) when compared to non-pregnant controls (n = 7). All the represented genes had an adjusted P value ≤ 0.05 and a log2 Fold-Change ≥ 1 or ≤ −1. The adjusted P value was calculated in DESeq that used the Benjamin-Hochberg correction [Citation20]. The horizontal colour bars on the top of the heatmap represent the three different groups of subjects (the lower one) and different time points during pregnancy (the upper one). Each row of the heatmap refers to a single gene and each column is an individual subject. The red boxes highlight the genes that were selected for further analysis. (b) Venn diagram showing the numbers of differentially expressed genes for each group when compared to non-pregnant controls. Yellow represents Normal pregnancy, red GDM, and light blue PreX/gHTN. In addition, the Venn diagram shows the number of overlapping genes between the different groups during the 1st (top) and 2nd (bottom) trimesters of pregnancy
![Figure 6. 1st and 2nd trimesters differentially expressed genes (DEG). (a) Heatmap showing in a blue-red gradient the DEG genes in the 1st and 2nd trimesters of pregnancy (n = 26) when compared to non-pregnant controls (n = 7). All the represented genes had an adjusted P value ≤ 0.05 and a log2 Fold-Change ≥ 1 or ≤ −1. The adjusted P value was calculated in DESeq that used the Benjamin-Hochberg correction [Citation20]. The horizontal colour bars on the top of the heatmap represent the three different groups of subjects (the lower one) and different time points during pregnancy (the upper one). Each row of the heatmap refers to a single gene and each column is an individual subject. The red boxes highlight the genes that were selected for further analysis. (b) Venn diagram showing the numbers of differentially expressed genes for each group when compared to non-pregnant controls. Yellow represents Normal pregnancy, red GDM, and light blue PreX/gHTN. In addition, the Venn diagram shows the number of overlapping genes between the different groups during the 1st (top) and 2nd (bottom) trimesters of pregnancy](/cms/asset/df4ee8d6-ca5f-4e91-a291-3ecbefb49d65/kepi_a_1816774_f0006_oc.jpg)
In the second trimester, we detected 51 upregulated genes and 9 downregulated genes, but from the total list of 71 differentially expressed genes, only 21 were common between the 1st and the 2nd trimesters of pregnancy. Of the 21 genes that exhibited differential expression in both 1st and 2nd trimester, 20 genes were upregulated and only one gene, Heparan Sulphate Proteoglycan 1 (SDC2, gene ID:6383) was downregulated. We then investigated the 1st trimester of each sub-group, namely GDM, PreX or Normal, compared to the non-pregnant control results separately, and found only five genes differentially expressed in normal pregnancies when compared to non-pregnant subjects. Of these, three genes were differentially expressed between normal pregnancies and pregnancies with adverse outcomes (CSH1, CSH2, and CGA), with expression observed only in subjects who subsequently developed APOs (). Interestingly, 16 genes were differentially expressed during the 1st trimester only in subjects who developed APOs ().
We subsequently validated some of these differentially expressed genes by qRT-PCR. Concordance was observed between qRT-PCR and RNA-seq results (), although qRT-PCR lent to greater inter-subject variability within a group. To further confirm our findings, we performed the qRT-PCR, including, only the 1st trimester, with additional subjects in groups with adverse pregnancy outcomes (Supplementary Table 1, GDM, final n = 12; PreX, final n = 9).
Figure 7. qRT-PCR reflects gene expression changes observed with RNA sequencing. (A) Comparison of the log2 fold change in expression of six genes quantitated by RNA-seq and qRT-PCR assays. Statistically significant Pearson’s correlation is shown. Quantitative real-time PCR results for CSH2 (B), S100A8 (C), MMP8 (D), ALPL (E), MS4A3 (F), and BCL2L15 (G) are represented. For all genes, the absolute expression was quantified using GAPDH as the internal control employing the ΔCt method. Data are represented as the mean of 2^(-ΔCt) ± SEM. Three replicates were performed at each time point for each subject. The P-values shown in the figure were based on the unpaired Student’s t-test. (*) indicates statistically significant changes when compared to the normal pregnancy group (*) p < 0.05; (**) p < 0.01. (#) indicates statistically significant changes when compared to the non-pregnant group (#) p < 0.05; (##) p < 0.01
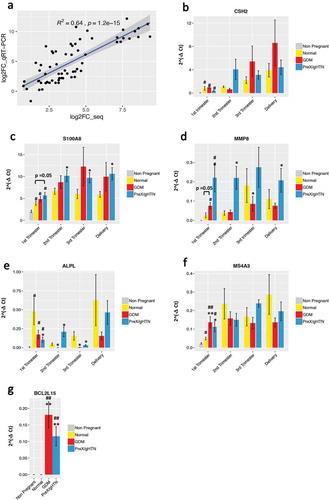
First, we selected the chorionic somatomammotropin hormone 2 (CSH2, gene ID:1443) that is a known pregnancy-related gene [Citation27] and validated the gene expression in pregnant but not in non-pregnant subjects. During pregnancy, CSH2 peaked in the third trimester and at delivery but was no different between normal and pregnancies with APOs ().
We then closely examined certain genes expressed during the 1st trimester of pregnancy, in subjects who subsequently developed APOs.
The S100 calcium-binding protein A8 (S100A8, gene ID: 6279), was upregulated in all pregnant subjects during the first trimester compared to non-pregnant subjects and was further increased in pregnancies with APOs compared to normal pregnancies at all gestational ages (). This increase in expression of S100A8 with PreX/gHTN and GDM is consistent with previously reported association with pre-term labour [Citation28]. S100A8 functions either with or independent of S100A9 during pregnancy providing biological relevance to our present observation [Citation29].
The matrix metallopeptidase 8 (MMP8, gene ID: 4317) is upregulated in pregnancy and particularly in both PreX/gHTN and GDM groups when compared to normal pregnancies by qRT-PCR, supporting our RNA sequencing results ().
Alkaline phosphatase, biomineralization associated gene (ALPL, gene ID: 249) was found to be upregulated during the 1st trimester of pregnancy by RNA-seq; however, it was significantly downregulated in pregnancies with adverse outcomes when compared to normal pregnancies, with qRT-PCR validation exhibiting a similar trend ().
The Membrane Spanning 4-Domains A3 (MS4A3, gene ID: 932) was significantly upregulated in both GDM and PreX/gHTN subjects. Despite the lack of any previous studies associating MS4A3 with APOs, the promoter of this gene has been reported to be hypomethylated in the offspring of GDM mothers [Citation30] (), providing indirect support to our present findings. Finally, BCL2CL15 (ID: 440,603) gene expression was upregulated in the first trimester of both GDM and PreX/HTN groups versus normal pregnancies by RNA-seq which was also validated by qRT-PCR ().
Classification models towards early biomarker discovery
We used the cfRNA sequencing information from the 1st trimester of pregnancy to identify candidate biomarkers for early detection of the subsequent propensity in developing adverse pregnancy outcomes. The goal was to propose a panel of genes that could be detected in plasma as early as the first trimester of pregnancy, which could indicate an increased risk for the subsequent development of adverse outcomes such as preeclampsia or gestational diabetes. Such gene panels once identified and validated could serve as the stepping stone for future larger biomarker studies engaging multiple cohorts. We first pooled all the subjects who developed APOs later in pregnancy into a single group and built a classifier that could predict these events as early as the first trimester of pregnancy. Using elastic-net regularization, we built a logistic regression (LR) model that was trained using a leave-one-out cross-validation (LOOCV) and found the model to detect around 90% of the true positive values (), and the most recurrent features according to this model were SRPK1, S100A9, NAMPT, MS4A3, MMP8, HAGLR, ALPL, ACSL1, S100A8, and KLHL2.
Figure 8. Receiver operator curves (ROC) of classification models
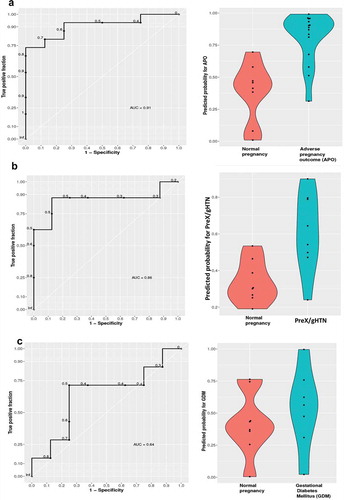
In order to detect transcript biomarkers specific for each type of adverse outcome, we built separate classifiers distinguishing between preeclampsia and normal pregnancy, or gestational diabetes mellitus and normal pregnancy. The Logistic Regression model for detecting preeclampsia and gestational hypertension revealed accuracy, with an AUC of 0.86 (). The genes selected were SRPK1, S100A9, S100A8, NAMPT, and MMP8. The Logistic Regression model did not perform as well in detecting GDM identifying only 64% of true positive values () with the selected genes being SRPK1, S100A8, S100A9, and MS4A3. Some of the selected genes were also supported by the quantitative real-time PCR results shown in . An overlap between the features selected for both preeclampsia and gestational diabetes, together with the lower performance by the Logistic Regression model in detecting GDM subjects alone, suggests that a distinction between these two APOs at an early stage of pregnancy may prove to be difficult.
This was true even when we tried the same approach using the cfDNA deconvolution results from the first trimester. We used an elastic-net regularization and built a logistic regression (LR) model that was trained using a leave-one-out cross-validation (LOOCV) and found the model to detect 80% of the true GDM positives while preeclampsia could only be detected with a rather low accuracy of an AUC = 0.47 (Supplementary figure S7).
While preeclampsia could be predicted using circulating transcriptomic changes of select genes, GDM could not be predicted with the same certainty employing gene expression strategies, although higher prediction accuracy was achieved when examining cfDNA. Within the limitation of the sample size inherent in our present temporally designed study, these results collectively highlight the fact that a single cell-free nucleotide strategy may not be sufficient to accurately predict the differing APOs encountered.
Discussion
Prenatal testing is an established part of modern obstetrics. Although analysis of maternal serum cell-free DNA has been employed clinically for the screening of genetic abnormalities within a pregnancy, limited attention has been paid to its use for the detection of placental function. Here, for the first time, we have examined cell-free DNA methylation signatures as a non-invasive method of detecting the placental contribution to maternal health. Employing a novel deconvolution method based on known tissue-of-origin DNA methylation profiles, the cell-free DNA was successfully apportioned to respective tissues of origin. Based on this apportioning, during the first/early second trimester, women with GDM showed a higher amount of placental DNA in maternal circulation. This increase persisted throughout pregnancy, although observed early before antenatal testing for glucose intolerance is routinely undertaken, providing high significance and biological relevance. The increased amount of cfDNA from placenta in GDM subjects could be explained by the presence of placental histological abnormalities, such as fibrinoid necrosis or chorangiosis, as previously described [Citation31]. Interestingly, changes in the pancreatic cfDNA fraction also seem to be related to the subsequent diagnosis of GDM. The pancreatic cfDNA was higher in GDM versus normal in the 1sttrimester, remaining elevated and trending higher at later pregnancy stages as well. The ability to detect any GDM induced changes, during an early critical period of pregnancy could help in appropriately intervening even before any symptoms or occurrence of perturbations in maternal-foetal metabolic profiles are seen. By contrast, the lack of change in PreX/gHTN subjects may be due to other associated co-morbidities (e.g., obesity reducing placental contribution to cfDNA) that may neutralize the (increasing) effect of PreX/gHTN on placental cfDNA methylation signatures, even if it exists.
Maternal obesity instead was associated with a reduction in DNA of placental origin seen in maternal circulation. This reduction in placental contribution towards cfDNA in maternal plasma is in keeping with previous observations from a human study that revealed reductions in placental cellular apoptosis and reduced cellular turnover in maternal obesity [Citation32]. A similar observation was made in obese mice, where a reduction in placental cfDNA release was observed [Citation33]. Regardless, these changes in placental contribution, found in maternal circulation early in gestation, have the possibility of predicting the subsequent development of associated APOs prior to the development of clinical features attesting to the high-risk nature of a pregnancy. In addition to these changes that were seen with GDM and maternal obesity, no effect of the mode of delivery or the foetal/placental sex was observed.
Our study employed tissue-specific epigenetic features thereby allowing the detection of male and female placental cfDNA with low depth coverage and using small amounts of maternal plasma samples.
During pregnancy with advancing gestation, we observed an inverse correlation between increasing amounts of circulating placenta-specific cfDNA and decreasing total CG methylated cfDNA. This was also true in subjects with GDM where we observed an increase in the placental cfDNA fraction, accompanied by a decrease in the total CG methylation that achieved statistical significance during the second trimester. This observation of an inverse relationship between the placental contribution to the cfDNA pool and total CG methylation of this cfDNA pool provides further credence to the fact that placental DNA is generally hypomethylated when compared to DNA arising from other tissues [Citation20]. Any epigenetic change during pregnancy and especially in the presence of subsequent APOs can serve as a useful indicator of an adverse intrauterine environment affecting mother and offspring. In addition, these changes may be associated with key changes in transcription, the products of which may underlie a specific disease pathogenesis.
Thus, the ability to temporally monitor but more importantly detect early changes may prove to be an important diagnostic modality for the prevention of adverse pregnancy outcomes.
More recently, investigations employing cell-free RNA have provided a non-invasive ability to predict the gestational age and thereby premature labour in women [Citation4]. Similarly, in a smaller cohort of subjects, the impact of immune response was reported [Citation34]. To further validate these results, we used a similar approach with cfRNA by employing the SaVanT method [Citation23] in order to decipher the cfRNA content in our samples. The placenta-specific signature increased in gestation among all the cfRNA samples and the subjects who developed APOs carried a higher amount of placenta-specific cfRNA in their plasma. However, cfRNA deconstruction in subjects with complications while exhibiting trends failed to accomplish statistical significance. A similar paradigm existed for cfRNA placental signature when differentiated into three BMI categories (lean, overweight, and obese). The cfRNA trend paralleled that observed with cfDNA, especially during the first trimester of pregnancy.
In the face of placental cfRNA not achieving statistical significance with advancing gestation in subjects who developed APOs, we next turned to analysing the contribution from immune cells to the maternal total cfRNA pool. Mature immune cells likewise also did not show any changes temporally during normal gestation nor with the development of complications. In contrast, the bone marrow cellular signature contribution to maternal cfRNA revealed an increase with advancing gestation with a similar tendency maintained in subjects with GDM and preeclampsia, achieving statistical significance during the first trimester in GDM subjects.
The bone marrow cells are the main source of all haematopoietic progenitor cells. In addition, they are also a source of nonhematopoietic decidual cells that play a fundamental role during the early phase of placentation [Citation35]. The increment of bone marrow cellular contribution to the maternal cfRNA pool we observed early in pregnancy in GDM subjects may aid in early detection of APOs besides heralding perturbed placentation. Based on our collective observations with cfDNA and cfRNA, it appears that use of these two approaches may be necessary to non-invasively detect APOs early in pregnancy.
To extend these results, we next examined the cell-free RNA sequencing to determine whether an early gestational transcriptomic signature can further sharpen the prediction of adverse pregnancy outcomes (APOs). Differentially expressed genes in pregnant versus non-pregnant women were identified initially to determine the predictability of a particular adverse outcome. Given that a limitation of our present prospective study is the ultimate yield of small numbers of subjects with APOs, our prediction ability may not be robust. However, despite this limitation, we demonstrated early attempts at identifying biomarkers which may motivate future studies within larger clinical trials. The prediction model we used identified a set of genes capable of predicting the subsequent development of adverse pregnancy outcomes inclusive of GDM and ischaemic placental disease. Individually, while predictability of pre-eclampsia based on transcriptomic signatures obtained early in pregnancy was reliable, prediction of GDM did not experience the same extent of reliability. Previously, studies employing large clinical databases detected clinical risk factors that predicted the subsequent development of gestational diabetes [Citation36] and preeclampsia [Citation37]. These studies employed various machine and deep learning methodologies to develop these predictions. However, none of these investigations concomitantly employed any maternal plasma analyses, particularly during early pregnancy.
Given that, there are many ongoing studies targeting early interventions for the prevention of a high-risk pregnancy, an example being the use of statins in preeclampsia [Citation38–40], there is a strong motivation to develop early gestational non-invasive biomarkers that can ultimately help the clinician in predetermining which subjects are more likely to develop APOs. This non-invasive testing may even act as a screen to determine those who would benefit from additional imaging modalities to assess their pre-condition. At the very least, such testing may be used to exclude pregnant women with risk factors from undergoing MR imaging (given that the sensitivity of ultrasound early in pregnancy is low).
In conclusion, we have presented cfDNA methylation signatures and transcriptomic signatures early in gestation that collectively could potentially assist in the prediction of subsequent development of APOs, prior to the emergence of characteristic clinical features. In addition, we have used a novel deconvolution methodology that allows determination of the placental tissue-of-origin within the cfDNA pool found in maternal circulation, that is specific for low coverage data and small tissue percentage. Despite the limitation of a small sample size of subjects who developed APOs, we are providing, for the first time, the results for both cfDNA and cfRNA analysis from 136 samples, collected temporally from 26 pregnant women and 7 non-pregnant subjects. Our longitudinally designed prospective cohort study warrants a future larger multi-centre clinical trial and suggests that these non-invasive approaches may be used effectively early in gestation, paving the way towards improving future testing and screening of all women [Citation41].
Author contributions
G.D.V. was responsible for undertaking DNA and RNA profiling and analyses of the datasets, Q. L. and W. L. worked on developing the cellular deconvolution methodology. S.T. undertook RT-PCR experiments, A. T. undertook the prediction modeling applied to RNA-sequencing, M.M. helped to set up the initial RNA library preparation protocol, K.S. assisted with the development of prediction models, C.J. helped with facilitating subject recruitment for the study and assisted in establishing the nationally accepted clinical criteria employed in this study to sub-classify subjects, X.Z. was responsible for oversight of the novel deconvolution methodology development, M.P. was responsible for the oversight of the data analyses, and S.U.D. was responsible for conduct of the overall study including the original concept for this study, oversight of sample collection and laboratory experiments involving DNA/RNA experiments, RT-PCR, and final analyses. G.D.V. generated the figures and wrote the initial draft of the paper, S.U.D. wrote parts of the paper as well, which was edited by C.J, K.S, M.P and S.U.D. The manuscript was seen by all authors.
Data and materials availability
The data discussed in this publication have been deposited in NCBI’s Gene Expression Omnibus [Citation42] and are accessible through GEO Series accession number.
GSE154378 (https://www.ncbi.nlm.nih.gov/geo/query/acc.cgi?acc=GSE154378).
Supplemental Material
Download PDF (8.8 MB)Acknowledgments
We are grateful to Teresa Chanlaw, Sarah Choi, and Irish del Rosario for blood collection and archiving the clinical information as part of the clinical trial. We thank Alibek Danyalov for helping with the development of prediction models and Laya Hodaei for assisting with the initial RNA extraction.
Disclosure statement
No potential conflict of interest was reported by the authors.
Supplementary material
Supplemental data for this article can be accessed here.
Correction Statement
This article has been republished with minor changes. These changes do not impact the academic content of the article.
Additional information
Funding
- Norton ME, Wapner RJ. Cell-free DNA Analysis for Noninvasive Examination of Trisomy. N Engl J Med. 2015;373:2581–2582.
- Heazell AE, Hayes DJ, Whitworth M, et al. Biochemical tests of placental function versus ultrasound assessment of fetal size for stillbirth and small-for-gestational-age infants. Cochrane Database Syst Rev. 2019;5:CD012245.
- Shao X, Liu D, Martin T, et al. Measuring human placental blood flow with multidelay 3D GRASE pseudocontinuous arterial spin labeling at 3T. J Magn Reson Imaging. 2018;47(6):1667–1676.
- Ngo TTM, Moufarrej MN, Rasmussen M-LH, et al. Noninvasive blood tests for fetal development predict gestational age and preterm delivery. Science. 2018;360(6393):1133–1136.
- van Boeckel SR, Davidson DJ, Norman JE, et al. Cell-free fetal DNA and spontaneous preterm birth. Reproduction. 2018;155(3):R137–145.
- Chen P-Y, Chu A, Liao -W-W, et al. Prenatal Growth Patterns and Birthweight Are Associated With Differential DNA Methylation and Gene Expression of Cardiometabolic Risk Genes in Human Placentas: A Discovery-Based Approach. Reprod Sci. 2018;25(4):523–539.
- Thamotharan S, Chu A, Kempf K, et al. Differential microRNA expression in human placentas of term intra-uterine growth restriction that regulates target genes mediating angiogenesis and amino acid transport. PLoS One. 2017;12(5):e0176493.
- Sun K, Jiang P, Chan KC, et al. Plasma DNA tissue mapping by genome-wide methylation sequencing for noninvasive prenatal, cancer, and transplantation assessments. Proc Natl Acad Sci U S A. 2015;112(40):E5503–5512.
- Moss J, Magenheim J, Neiman D, et al. Comprehensive human cell-type methylation atlas reveals origins of circulating cell-free DNA in health and disease. Nat Commun. 2018;9(1):5068.
- Kang S, Li Q, Chen Q, et al. CancerLocator: non-invasive cancer diagnosis and tissue-of-origin prediction using methylation profiles of cell-free DNA. Genome Biol. 2017;18(1):53.
- Li W, Li Q, Kang S, et al. CancerDetector: ultrasensitive and non-invasive cancer detection at the resolution of individual reads using cell-free DNA methylation sequencing data. Nucleic Acids Res. 2018;46(15):e89.
- Ananth CV. Ischemic placental disease: a unifying concept for preeclampsia, intrauterine growth restriction, and placental abruption. Semin Perinatol. 2014;38(3):131–132.
- Adams T, Yeh C, Bennett-Kunzier N, et al. Long-term maternal morbidity and mortality associated with ischemic placental disease. Semin Perinatol. 2014;38(3):146–150.
- Practice Bulletin ACOG. No. 190: gestational Diabetes Mellitus. Obstet Gynecol. 2018;131:e49–e64.
- Practice Bulletin ACOG. No. 202: gestational Hypertension and Preeclampsia. Obstet Gynecol. 2019;133:e1–e25.
- Dempster AP, Laird NM, Rubin DB. Maximum Likelihood from Incomplete Data via the EM Algorithm. J R Stat Soc Series B Stat Methodol. 1977;39:1–38.
- Friedman J, Hastie T, and Tibshirani R. Regularization paths for generalized linear models via coordinate descent. Journal of Statistical Software. 2010;33(1):1–22.
- Sachs MC. plotROC: A tool for plotting ROC curves. J statl softw. 2017;79:1–19.
- Benjamini Y, Hochberg Y. Controlling the false discovery rate - a practical and powerful approach to multiple testing. J Roy Stat Soc B Met. 1995;57:289–300.
- Lun FM, Chiu RW, Sun K, et al. Noninvasive Prenatal Methylomic Analysis by Genomewide Bisulfite Sequencing of Maternal Plasma DNA. Clin Chem. 2013;59(11):1583–1594.
- Hodges E, Smith AD, Kendall J, et al. High definition profiling of mammalian DNA methylation by array capture and single molecule bisulfite sequencing. Cold Spring Harbor Laboratory Press. 2009;19:1593–1605.
- Jensen TJ, Kim SK, Zhu Z, et al. Whole genome bisulfite sequencing of cell-free DNA and its cellular contributors uncovers placenta hypomethylated domains. Genome Biol. 2015;15:16–78.
- Lopez D, Montoya D, Ambrose M, et al. SaVanT: a web-based tool for the sample-level visualization of molecular signatures in gene expression profiles. BMC Genomics. 2017;18–824.
- Taylor HS. Endometrial cells derived from donor stem cells in bone marrow transplant recipients. Jama. 2004;292(1):81–85.
- Mints M, Jansson M, Sadeghi B, et al. Endometrial endothelial cells are derived from donor stem cells in a bone marrow transplant recipient. Hum Reprod. 2008;23:139–143.
- Ikoma T, Kyo S, Maida Y, et al. Bone marrow–derived cells from male donors can compose endometrial glands in female transplant recipients. Am J Obstet Gynecol. 2009;201(6):e1–8.
- Handwerger S, Freemark M. The roles of placental growth hormone and placental lactogen in the regulation of human fetal growth and development. J Pediatr Endocrinol Metab. 2000;13(4):343–356.
- Phillips RJ, Fortier MA, Lopez Bernal A. Prostaglandin pathway gene expression in human placenta, amnion and choriodecidua is differentially affected by preterm and term labour and by uterine inflammation. BMC Pregnancy Childbirth. 2014;14(1):241.
- Baker JR, Jeffery R, May RD, et al. Distinct roles for S100a8 in early embryo development and in the maternal deciduum. Dev Dyn. 2011;240(9):2194–2203.
- Hjort L, Martino D, Grunnet LG, et al. Gestational diabetes and maternal obesity are associated with epigenome-wide methylation changes in children. JCI Insight. 2018;3(17):e122572.
- Daskalakis G, Marinopoulos S, Krielesi V, et al. Placental pathology in women with gestational diabetes. Acta Obstetricia et Gynecologica Scandinavica. 2008;87(4):403–407.
- Edlow AG, Vora NL, Hui L, et al. Maternal obesity affects fetal neurodevelopmental and metabolic gene expression: a pilot study. PLoS One. 2014;9(2):e88661.
- Mhatre M, Adeli S, Norwitz E, et al. The Effect of Maternal Obesity on Placental Cell-Free DNA Release in a Mouse Model. Reprod Sci. 2019;26(9):1218–1224.
- Pan W, Ngo TTM, Camunas-Soler J, et al. Simultaneously Monitoring Immune Response and Microbial Infections during Pregnancy through Plasma cfRNA Sequencing. Clin Chem. 2017;63(11):1695–1704.
- Tal R, Shaikh S, Pallavi P, et al. Adult bone marrow progenitors become decidual cells and contribute to embryo implantation and pregnancy. PLoS Biol. 2019;17(9):e3000421.
- Lamain-de Ruiter M, Kwee A, Naaktgeboren CA, et al. Van ‘t Zelfde A, van Oirschot CM, Vankan-Buitelaar SA, Vonk MA, Wiegers TA, Zwart JJ, Franx A, Moons KG, Koster MP. External validation of prognostic models to predict risk of gestational diabetes mellitus in one Dutch cohort: prospective multicentre cohort study. BMJ. 2016;354:i4338.
- De Kat AC, Hirst J, Woodward M, et al. Prediction models for preeclampsia: A systematic review. Pregnancy Hypertens. 2019;16:48–66.
- Katsi V, Georgountzos G, Kallistratos M, et al. The Role of Statins in Prevention of Preeclampsia: A Promise for the Future? Front Pharmacol. 2017;8:247.
- Costantine MM, Cleary K, Hebert MF, et al. Safety and pharmacokinetics of pravastatin used for the prevention of preeclampsia in high-risk pregnant women: a pilot randomized controlled trial. Am J Obstet Gynecol. 2016;214(6):e1–720. e17.
- Marrs CC, Costantine MM. Should We Add Pravastatin to Aspirin for Preeclampsia Prevention in High-risk Women? Clin Obstet Gynecol. 2017;60(1):161–168.
- Chan KC, Jiang P, Chan CW, et al. Noninvasive detection of cancer-associated genome-wide hypomethylation and copy number aberrations by plasma DNA bisulfite sequencing. Proc Natl Acad Sci U S A. 2013;110(47):18761–18768.
- Edgar R. Gene Expression Omnibus: NCBI gene expression and hybridization array data repository. Nucleic Acids Research. 2002;30(1):207–210.