
ABSTRACT
Obesity promotes dysfunction and impairs the reparative capacity of mesenchymal stem/stromal cells (MSCs), and alters their transcription, protein content, and paracrine function. Whether these adverse effects are mediated by chromatin-modifying epigenetic changes remains unclear. We tested the hypothesis that obesity imposes global DNA hydroxymethylation and histone tri-methylation alterations in obese swine abdominal adipose tissue-derived MSCs compared to lean pig MSCs. MSCs from female lean (n = 7) and high-fat-diet fed obese (n = 7) domestic pigs were assessed using global epigenetic assays, before and after in-vitro co-incubation with the epigenetic modulator vitamin-C (VIT-C) (50 μg/ml). Dot blotting was used to measure across the whole genome 5-hydroxyemthycytosine (5hmC) residues, and Western blotting to quantify in genomic histone-3 protein tri-methylated lysine-4 (H3K4me3), lysine-9 (H3K9me3), and lysine-27 (H3K27me3) residues. MSC migration and proliferation were studied in-vitro. Obese MSCs displayed reduced global 5hmC and H3K4m3 levels, but comparable H3K9me3 and H3K27me3, compared to lean MSCs. Global 5hmC, H3K4me3, and HK9me3 marks correlated with MSC migration and reduced proliferation, as well as clinical and metabolic characteristics of obesity. Co-incubation of obese MSCs with VIT-C enhanced 5hmC marks, and reduced their global levels of H3K9me3 and H3K27me3. Contrarily, VIT-C did not affect 5hmC, and decreased H3K4me3 in lean MSCs. Obesity induces global genomic epigenetic alterations in swine MSCs, involving primarily genomic transcriptional repression, which are associated with MSC function and clinical features of obesity. Some of these alterations might be reversible using the epigenetic modulator VIT-C, suggesting epigenetic modifications as therapeutic targets in obesity.
Introduction
The increasing number of people with obesity has become a major burden for health-care systems worldwide, and created a global pandemic [Citation1]. Obesity is characterized by increased adipose tissue mass, but its complications largely stem from dysregulated cellular functions, which lead to chronic adipose tissue inflammation, escalating insulin resistance, and impaired tissue repair [Citation2].
At the cellular level, obesity further interferes with the normal function and reparative potential of mesenchymal stem cells (MSCs) [Citation3], these reparative cells are capable of proliferation, trans-differentiation, and self-renewal, and bestow beneficial effects on local or distant tissues exposed to noxious stimuli [Citation4,Citation5]. Development of obesity, accompanied by micro-environmental inflammatory changes in adipose tissue, increases the propensity of MSCs for differentiation into adipocytes and induces their senescence [Citation6]. However, the mechanisms underlying the phenotypical changes in MSC in obesity remain unclear.
Epigenetic alterations in cells and tissues have been implicated in the pathogenesis of inflammatory and metabolic conditions [Citation7–10]. Obesity and its comorbidities, such as dyslipidemia or hypertension, may lead to genomic epigenetic changes that in turn modulate cellular phenotype. For example, the recent longitudinal Bogalusa Heart Study demonstrated that body mass index (BMI) and obesity elicit changes in global DNA methylation over time [Citation11]. Reduced global DNA methylation was noted in DNA of blood mononuclear cells from hypertensive patients, while levels of DNA hydroxymethylation appeared to respond to variable salt intake in experimental hypertension models [Citation12]. In addition, DNA and histone methylation of endoplasmic reticulum stress genes are linked to adiposity, dyslipidemia, and insulin resistance [Citation13].
Epigenetic alterations described over the years [Citation14] include chromatin-modifying alterations, post-transcriptional modifications involving micro-RNAs, and post-translational regulation, and each can be targeted by different classes of epigenetic modulators. Previous studies suggested that small molecule modulators of chromatin-modifying enzymes can manipulate plasticity and phenotype of human adipose tissue-derived MSCs [Citation15]. For example, a persistent inflammatory state in obesity increases oxidative stress, which can deplete circulating and tissue antioxidant defences [Citation16,Citation17]. Vitamin C (VIT-C, L-ascorbic acid) is an important epigenetic regulator and a natural antioxidant. VIT-C is a cofactor for Ten-eleven translocation (TET) methylcytosine dioxygenases that are responsible for DNA hydroxymethylation of 5-methylcystosine residues to 5-hydroxymethylcytosine (5hmC), and for some Jumonji-C (JmjC) domain-containing histone demethylases that catalyse histone demethylation [Citation18–20].
We have previously found that obesity alters the transcriptome and protein contents of MSCs [Citation21,Citation22] and interferes with their paracrine function by modifying packaging within MSC-derived extracellular vesicles [Citation3,Citation23]. Whether these alterations are primarily related to global epigenetic alterations at the chromatin (genomic) level, or are subsequent to downstream targeting of post-transcriptional and post-translational regulations, is not well understood.
Therefore, this study tested the hypothesis that global DNA hydroxymethylation and histone tri-methylation levels are altered in obese compared to lean swine MSCs. Furthermore, we hypothesized that DNA and histone epigenetic alterations in obese MSCs would be reversible with the epigenetic modulator VIT-C in-vitro.
Materials and methods
Induction of experimental swine obesity
Female domestic pigs were randomly placed on either a standard pig chow (lean diet; 13% protein, 2% fat, 6% fibre, Purina Animal Nutrition LLC, MN, USA) (n = 7) or high-fat diet (5B4L, protein 16.1%, ether extract fat 43.0%, carbohydrates 40.8%, Purina Test Diet, Richmond, IN, USA) [Citation24] (n = 7). After 16 weeks of diet, blood samples were collected and the pigs euthanized by a terminal intravenous injection of sodium pentobarbital (100 mg/kg IV, Fatal Plus®, Vortech Pharmaceuticals, Dearborn, MI, USA), and 5–10 g of subcutaneous abdominal adipose tissue excised in order to isolate and expand MSCs in culture. The Mayo Clinic Animal Care and Use Committee approved this study. Animals were housed in an accredited facility and provided water ad libitum.
Systemic measurements
Blood pressure was directly measured through an arterial catheter and plasma levels of total cholesterol, triglyceride, low-density lipoprotein cholesterol (LDL-C), and high-density lipoproteins cholesterol (HDL-C) measured by standard procedures. Very-low density lipoprotein (VLDL) was defined by dividing triglyceride level by 5. Glucose and insulin levels were used to calculate the homoeostasis model-assessment of insulin resistance (HOMA-IR) (fasting plasma glucose×fasting plasma insulin/22.5) as an index of insulin resistance [Citation24].
MSC culture, characterization, and in-vitro studies
MSCs were isolated and expanded from abdominal adipose tissue, as described [Citation25]. The fat was immediately processed under sterile conditions by mincing and digesting in collagenase-H at 37°C for 45 min following tissue harvest. Serum-containing medium was added to stop the reaction. The suspension was filtered through a 100 µm cell-strainer to remove remaining tissue pieces, and then centrifuged to pellet cells. Cells were resuspended in advanced minimum essential medium supplemented with 5% platelet lysate (PLTmax, Mill Creek Life Sciences, Rochester, MN, USA), and expanded for three passages. We have previously shown by flow cytometry that these MSC express MSC-specific markers (CD73+, CD90+, and CD105+; CD45 – and CD34–), and phenotype was confirmed by trans-differentiation into osteocytes, adipocytes, and chondrocytes lineages [Citation26]. Following the third passage, MSC proliferation was studied using a Cytation™-5 Cell Imaging Multi-Mode Reader (BioTek Instruments, Winooski, VT). Cells were seeded into a 24-well-plate at equal density (30,000 cells/well) and maintained at 37°C and 5% CO2 for 24 hours. Cells were imaged every 2 h and percent confluence calculated generated in Gen5. MSC migration was studied using the QCM™ Colorimetric Assay.
Finally, lean (n = 7) and obese (n = 7) MSCs were cultured for another passage without and with co-incubation for 48 h (starting at 80–90% confluence) with the epigenetic-modifying agent VIT-C (50 µg/ml) [Citation27,Citation28].
Epigenetic assays
DNA was extracted from the MSCs using the PureLink™ Genomic DNA Mini-Kit extraction tool, according to the kit protocol (ThermoFisher Scientific, Cat# K182001), and concentrations measured by a Spectrophotometer (NanoDrop). The global DNA hydroxymethylation was then quantified by dot blotting (DB). Samples were prepared by diluting total DNA to final amounts of 2, 1, 0.5, and 0.25 μg with 0.1 M NaOH. The samples were denatured at 95°C for 10 min and cooled quickly on an ice bath followed by neutralization with ammonium acetate. Loading sample volumes of 400 μL were prepared by adding equal volumes of 0.1 M NaOH and 2 M ammonium acetate to the denatured DNA. The nitrocellulose membrane was pre-wet in distilled water, and placed on the Bio-Dot® Microfiltration Apparatus (Bio-Rad) as per manufacturer’s recommendations. Vacuum was applied and the screws retightened to hold the apparatus together. The membrane was rehydrated with 0.1 M NaOH to prepare for sample application. With vacuum off, denatured DNA was added to sample wells, while all other wells were filled with the same volume of distilled water to obtain homogenous filtration. The samples were filtered by applying gentle vacuum, followed by addition of 0.1 M NaOH to each well. The vacuum was applied again until wells were empty. The apparatus was disassembled and the membrane rinsed with 2× saline-sodium citrate. After air-drying, the membrane was blocked with 5% skimmed milk in PBS for 1 h. The membranes were washed with PBS, incubated with anti-5 hydroxymethyl cytosine (5hmC) overnight, and the next day washed with PBS and incubated with the anti-rabbit secondary antibody. The blots were washed and developed using the SuperSignal West Femto Maximum Sensitivity Substrate kit (ThermoFisher Scientific) by autoexposure settings on the ChemiDoc™ Touch Imaging System (Bio-Rad). Data were quantified by densitometry and analysed using Image-Lab software (MCM design, Birkerød, Denmark) by applying background subtraction and approximated for linearity [Citation29]. The chemiluminescent signal of 5hmC on DB was calculated based on weighted dilutions of three different anti-5hmC preparations using the following formula: [(4 × undiluted Adjusted Volume (Int.) (1:1)) + (2× Diluted Adjusted Volume (Int.) (1:2)) + (1× Diluted Adjusted Volume (Int.) (1:4))]/7. The blotting membranes were subsequently stained with methylene blue (Sigma-Aldrich) for loading control. The intensity of methylene blue colours representing the relative amount of loaded genomic DNA on each well was quantified using the ImageJ software (National Institute of Health, Bethesda, Maryland). Normalized dot-blot readings for all samples were then calculated by dividing their original dot-blot by the methylene blue quantifications.
Cell lysis and Western blotting (WB) for characterization of global histone tri-methylation were performed as described [Citation30], and proteins visualized using the ECL Prime detection kit. Primary antibodies used were against H3 (1:10,000; 05–928, Millipore), H3K4me3, H3K9me3, and H3K27me3 (1:5,000; 17–622, Millipore), and total H3 protein (1:10,000; E7, University of Iowa Hybridoma Bank).
Quantitative polymerase chain reaction (qPCR)
Pig MSCs (0.5–1 × 10⁶) were homogenized in 350ul of ice-cold lysis buffer, supplied by mirVana PARIS total RNA isolation kit (ThermoFisher Scientific, Cat# AM1556). Total RNAs were then isolated from homogenized samples according to the kit protocol, and concentrations measured by NanoDrop (ThermoScientific). First-strand cDNA was produced from 800 ng total RNA using SuperScript VILO cDNA Synthesis kit (ThermoFisher Scientific, Cat#11,754-050).
qPCR was performed with Taqman assays, containing 4ul of cDNA products, using primers purchased from Thermo Fisher scientific. These included DNA Methyltransferase-1 (DNMT1, Ss03392016), Enhancer of Zeste-2 Polycomb Repressive Complex-2 Subunit (EZH2, APAAC79; Probe Sequence: CCGTGTCCTTCGACTCC, Forward Sequence: CACCCCCACCATCAACGT, Reverse Sequence: CGCCTCCCTGTCACTGT), Histone Acetyltransferase-1 (HAT1, APRWGJE; Probe Sequence: ATGGAGCTACACTCTTTG, Forward Sequence: GATGGCACTACTTTCTAGTATTTGAGAAGT, Reverse Sequence: AGACTGTCATGTAGCCTACGGT), Histone Deacetylase-3 (HDAC3, Ss04325552), Sirtuin-7 (SIRT7, Ss03387334), Jumonji And AT-Rich Interaction Domain Containing-2 (JARID2, APGZG7X; Probe Sequence: CCGCTCGTCTACATCGA, Forward Sequence: GTCGGCCAAGGAGTTCCA, Reverse Sequence: CTGCACATGCCGTACTTCTC), TET Methylcytosine Dioxygenase-1 (TET1, APCE6T6; Probe Sequence: CATTGCCCAGCTCTC, Forward Sequence: AGGACACTATCATGCTCCACAAG, Reverse Sequence: GAGCTCCCTCCTTCCAATCTG), TET2 (APEPU23; Probe Sequence: ACAGTGGACCAGCATCT, Forward Sequence: GATGAATCAAGGACAGTCTCAAGGT, Reverse Sequence: GCACCTGGAGTGAGGGTTTT), TET3 (APFVNM2; Probe Sequence: CCAGGCACGGTCTCCA, Forward Sequence: CAAATGTCCACCCCTCTTTCAC, Reverse Sequence: GACACCAGGAGGTCAAGCT), Lysine-Specific Demethylase-1 (LSD1, KDM1a, Ss03389746), and LSD2 (KDM1b, APAADGN; Probe Sequence: CCGGGACCCCACCATG, Forward Sequence: ATGAGCTCTATGAGTTCCCAGAGT, Reverse Sequence: CAGGGCGAGGATGAGATTCC). Glyceraldehyde 3-Phosphate Dehydrogenase (GAPDH, Ss03375629), β-actin (Ss03376563), and TATA-Box-Binding Protein (TBP, SsAPCE6HF) were used as reference controls. Negative controls with no cDNA were cycled in parallel with each run. Testing of GAPDH, β-actin, and TBP maximized the probability of finding stable internal controls for the comparison of epigenetic enzymes between lean and obese MSCs. Moreover, previous studies used different loading controls to characterize differential expression in epigenetic enzymes evaluated in our study [Citation31,Citation32].
PCR analysis was done on Applied Biosystems ViiA7 Real-Time PCR systems using the following conditions: 50°C for 2 min, 95°C for 10 min, and 40 cycles of 95°C for 15 s and 60°C for 1 min. Fold-changes of gene expressions were calculated using 2ΔΔCT method. Fold changes >2 and with p < 0.05 were considered to represent significant differences between obese and lean MSCs.
mRNA-sequencing (mRNA-Seq) analysis
We performed RNA sequencing as previously described [Citation22] on Obese and Lean MSCs (n = 3 each). We prepared sequencing RNA libraries as per manufacturer’s protocol (TruSeq RNA Sample Prep Kit v2, Illumina, SanDiego, USA) and loaded onto flow cells (8–10 pM) to generate cluster densities of 700,000/mm2 following the standard protocol for the Illumina cBot and cBot Paired-end cluster kit version-3. Illumina HiSeq 2000 using TruSeq SBS kit version 3 and HCS v2.0.12 data collection software were employed to sequence the cells, and the MAPRSeq v.1.2.1 system and Bioinformatics Core standard tool to analyse data. The latter tool includes alignment with TopHat 2.0.6 [Citation33,Citation34] and gene counts with the feature Counts software [Citation33–36]. Finally, mRNA-Seq data were analysed using CAP-miRSeq v1.1 [Citation37] and normalization and differential expression analysis performed using edgeR 2.6.2 [Citation38]. We then used the repository from the EpiFactors database (http://epifactors.autosome.ru) [Citation39] to screen for possible altered expression of all epigenetic enzymes in our MSC mRNA-Seq database. Gene expression was normalized to 1 million reads and corrected for gene length (Reads Per Kilobasepair per Million mapped reads, RPKM). Genes encoding mRNAs with fold-change>1.4 and p< 0.05 were considered to be upregulated in Obese (n = 3) compared to Lean (n = 3) MSCs, while those with fold-change<0.7 and p < 0.05 were considered downregulated. We followed Benjamini-Hochberg approach to correct p values for the comparison of obese and lean MSCs on the mRNA-Seq.
Statistical analysis
Data are represented as mean±standard error and analysed by using JMP 14.1 Software. The normality assumption was tested using the Shapiro-Wilk Test. Differences between the epigenetic marks of lean and obese MSCs (n = 4–7 per group), as well as clinical characteristics of experimental pigs, were tested using the two-sample t-test for parametric comparisons, and Wilcoxon test for non-parametric comparisons. Changes of epigenetic marks in lean or obese MSCs with VIT-C treatment were tested using the paired t-test/Wilcoxon Signed-Rank test. Bivariate correlations of MSC epigenetic marks with MSC proliferation and migration, and clinical characteristics of experimental pigs were calculated using the Pearson’s correlation coefficient for parametric correlations and the Spearman’s correlation coefficient for non-parametric correlations. The resulting correlation coefficients for each pair of variables were visualized on a heat map plot demonstrating the strength of correlations. Type-1 error rate was set at 5% in all statistical tests.
Results
Characteristics and function of swine MSCs
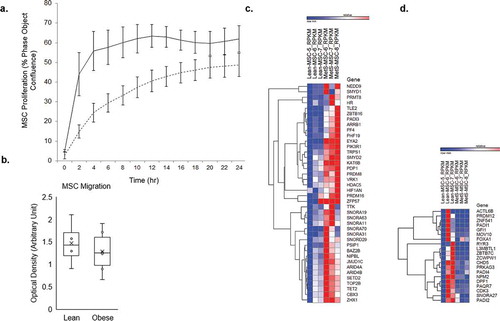
Obese pigs had higher body weight, total cholesterol, HDL-C, and LDL-C than lean pigs, whereas their mean arterial pressure, glucose, insulin, HOMA-IR, triglycerides, and VLDL levels were comparable . These findings underscore development of obesity and dyslipidemia in the obese group. Adipose tissue-derived MSCs obtained from Obese and Lean pigs had comparable migration ability (1.28 ± 0.47 vs. 1.47 ± 0.50 [arbitrary unit], p = 0.569), whereas Obese MSCs had decreased early proliferative capacity at 8 hours compared to Lean MSCs (33.3 ± 4.9 vs. 60.2 ± 5.7 [% phase object confluence], p < 0.001; ).
Table 1. Baseline characteristics of lean and obese pigs (n = 7 each)
Figure 1. A) proliferation capacity of Lean (n = 5) and Obese (n = 5) mesenchymal stem cells (MSCs) per group; obese MSCs (dashed lines) had reduced proliferative capacity compared to Lean MSCs (solid lines) over time, and at 8 hours (p < 0.001). Error bars represent standard errors of proliferation for MSC samples at each time point. b) migration capacity of Lean (n = 5) and Obese MSCs (n = 5); obese and Lean MSCs had comparable migration capacity (p = 0.569). Comparison of mRNAs in Obese and Lean MSCs with heat maps showed 40 mRNAs upregulated (c) and 20 mRNAs downregulated (d) in Obese MSCs
mRNA-Seq screening of epigenetic enzymes
We screened over 721 epigenetic enzymes found in the EpiFactors database (http://epifactors.autosome.ru) [Citation39] on our mRNA-Seq database for potential alterations in Obese compared to Lean MSCs. Of those, 40 (5.5%) epigenetic enzymes were upregulated and 20 (2.8%) downregulated in Obese compared to Lean MSCs. Therefore, overall almost 8.3% of all epigenetic enzymes had dysregulated expression in Obese compared to Lean MSCs, potentially indicating widespread upstream epigenetic changes occurring at the DNA (chromatin) level.
Global DNA epigenetic marks of swine MSCs
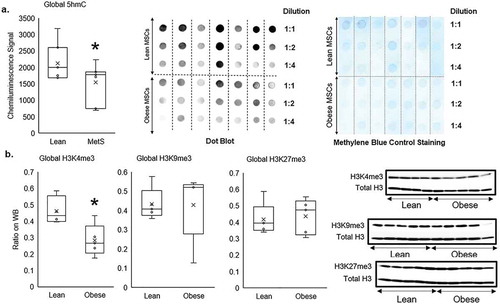
The average global 5 hmC marks of genomic DNA (normalized by methylene blue staining) was reduced in Obese compared to Lean swine MSCs (p = 0.042, ), as were global H3K4me3 marks (p = 0.019, ). By contrast, the average global levels of H3K9me3 and H3K27me3 were comparable between Obese and Lean MSC (p = 0.48, and p = 0.38, respectively; ). Therefore, global epigenetic alterations in Obese MSCs generally suppressed transcription of their genome compared to the lean samples.
Figure 2. Global epigenetic alterations in Obese compared to Lean MSCs demonstrated by: a) dot-blotting of DNA hydroxymethylation measuring genomic 5-hydroxymethyl-cytosine (5hmC), b) and Western blotting of histone-3 protein measuring genomic tri-methylation on lysine-4 (H3K4me3), 9 (H3K9me3), and 27 (H3K27me3) residues. Genomic 5hmC and H3K4me3 were reduced in Obese compared to Lean MSCs, but there were no different in Global H3K9me3 and H3K27me3 between Lean and Obese MSCs. *p ≤ 0.05 vs. Lean MSC
Effects of VIT-C on epigenetic marks in swine MSCs
To test the reversibility of epigenetic alterations in Obese MSCs, we co-incubated Lean (n = 3–5) and Obese (n = 3–4) MSCs in-vitro with the epigenetic modulator VIT-C. Treatment with VIT-C in-vitro did not change the normalized intensity of chemiluminescent signal from 5hmC residues in Lean MSCs (p = 0.368), but increased it in Obese MSCs (p = 0.045, ). VIT-C also reduced H3K4me3 (p = 0.002), but did not affect H3K9me3 (p = 0.486) or H3K27me3 (p = 0.374) expression in Lean MSCs . Contrarily, in Obese MSCs VIT-C decreased protein expression of H3K9me3 (p = 0.048) and H3K27me3 (p = 0.050) in WB , but did not affect H3K4me3 epigenetic marks (p = 0.355, ).
Figure 3. Effects of the epigenetic modulator vitamin C (VIT-C) on genomic 5hmC in Lean (solid lines) and Obese (dashed lines) MSCs. VIT-C increased genomic 5hmC in Obese MSCs, but did not change 5hmC in Lean MSCs. *p ≤ 0.05 vs. baseline
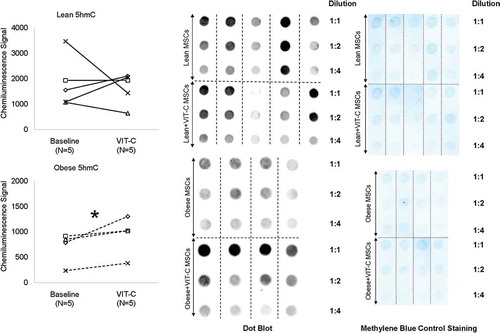
Figure 4. Effects of VIT-C on protein expression of genomic histone H3K4me3, H3K9me3, and H3K27me3 in Lean (solid lines) and Obese (dashed lines) MSCs. VIT-C reduced H3K4me3 in Lean MSCs, and H3K9me3 and H3K27me3 in Obese MSCs. *p ≤ 0.05 vs. baseline
Association of epigenetic marks with functional and biochemical characteristics of pigs and their MSCs
summarizes the correlation coefficients of MSC epigenetic marks with characteristics of all pigs, as well as with MSC function (migration and proliferation). Global 5hmC levels in MSCs were inversely correlated with levels of total cholesterol (p = 0.025, Pearson’s r = −0.732), HDL-C (p = 0.049, Pearson’s r = −0.669), and LDL-C (p = 0.007, Pearson’s r = −0.721), but not with body weight (p = 0.092, r = −0.594). Global H3K4me3 levels were inversely associated with body weight (p = 0.019, Pearson’s r = –0.740), total cholesterol (p = 0.045, Pearson’s r = −0.717), HDL-C (p = 0.048, Pearson’s r = –0.680), and LDL-C (p = 0.043, Pearson’s r = −0.721). Global H3K9me3 levels were positively correlated with plasma insulin (p = 0.036, Spearman’s rho = 0.699) and HOMA-IR (p = 0.050, Spearman’s rho = 0.667), but not with body weight (p = 0.723, Pearson’s r = −0.138), total cholesterol (p = 0.895, Pearson’s r = −0.052), HDL-C (p = 0.787, Pearson’s r = –0.106) or LDL-C (p = 0.911, Pearson’s r = −0.044). Contrarily, global H3K27me3 did not any correlation with swine clinical and serum measurement .
Table 2. Correlation coefficients of global 5hmC, H3K4me3, H3K9me3, and H3K27me3 with characteristics of lean and obese pigs and their MSC function (n = 14)
In addition, the chemiluminescent signal intensity of global 5hmC significantly and directly correlated with the migration ability of MSCs (p = 0.020, Spearman’s rho = 0.750), and with the proliferation of MSCs at 8 hours (p = 0.015, Pearson’s r = 0.769). MSCs proliferation further correlated with protein expression of global H3K4me3 (p = 0.048, Pearson’s r = −0.696), but not with those of H3K9me3 (p = 0.473, Pearson’s r = 0.276) and H3K27me3 (p = 0.976, Pearson’s r = 0.011). However, MSC migration did not correlate with any of the global histone tri-methylation marks, namely H3K4me3 (p = 0.651, Spearman’s rho r = 0.190), H3K9me3 (p = 0.831, Spearman’s rho r = 0.083) or H3K27me3 (p = 0.676, Spearman’s rho r = −0.152) .
Gene expression of epigenetic enzymes
While expression of GAPDH and β-actin housekeeping genes was comparable between Lean and Obese MSCs, TBP showed increased expression (2–CT values) in Obese compared to Lean MSCs (), as previously shown [Citation40], and was therefore not used for normalization. We then used β-actin to verify differential expressions of epigenetic enzymes using the GAPDH reference. Then, we normalized differential mRNA expression for several non-specific (general) epigenetic targets (DNMT1, EZH2, HAT1, HDAC3, SIRT7) between Lean and Obese MSCs to the GAPDH reference . Finally, we confirmed expression of the specific epigenetic enzymes which were highly relevant to the function of epigenetic modulator VIT-C (TET1, TET2, TET3, LASD1, LSD2, JARID2) using the housekeeping genes GAPDH, and β-actin. Since the findings obtained with β-actin and GAPDH were similar, we only report the results with GAPDH housekeeping gene . Obese MSCs had upregulated gene expression of the epigenetic enzymes EZH2, HAT1, TET1, TET2, and LSD2 compared to the Lean MSCs, whereas expression of DNMT1, TET3, LSD1, and JARID2 were comparable , as were HDAC3 and SIRT7 expressions (data not shown).
Figure 5. Gene expression of epigenetic enzymes in Obese compared to Lean MSCs. The epigenetic enzymes EZH2, HAT1, TET1, TET2, and LSD2 had increased expression in Obese MSCs relative to GAPDH on RT-qPCR. *p ≤ 0.05 vs. Lean MSC
Discussion
This study shows altered global DNA hydroxymethylation and histone tri-methylation epigenetic marks in adipose tissue-derived MSCs obtained from lean and obese pigs. Initially, dysregulated expression of over 8% of all epigenetic enzymes in Obese MSCs on mRNA-Seq provided evidence for a widespread global epigenetic change at the DNA and histone levels in these cells. We then found in obese MSCs diminished 5hmC and H3K4me3 marks compared to lean samples, whereas levels of H3K9me3 and H3K27me3 were comparable. We further observed that DNA hydroxymethylation and histone tri-methylation epigenetic marks of MSCs correlated with MSC migration and proliferation and clinical characteristics of dyslipidemia and obesity. Co-incubation of obese MSCs with the epigenetic modulator VIT-C attenuated the decline in their global 5hmC, and produced global demethylating effects over their H3K9me3 and H3K27me3 epigenetic marks. These findings suggest that obesity induces global epigenetic alterations in abdominal adipose tissue-derived MSCs, which are linked to global transcriptional repression rather than activation, and may respond to the epigenetic modulator VIT-C.
The obesity pandemic and its complications entail important clinical and public health concerns worldwide, and obesity-induced inadequate tissue repair is among the main mechanisms involved in long-term organ damage in affected subjects [Citation41]. For example, stem cells in the subcutaneous white adipose tissue of obese patients show upregulated inflammatory gene expression profile associated with diminished tissue repair capacity [Citation42]. Similarly, obesity also promotes dysfunction and impairs the reparative capacity of MSCs. The distinct potential of MSCs for tissue repair resides in their anti-inflammatory, anti-apoptotic, pro-angiogenic, and immunomodulatory properties [Citation43]. However, we have previously shown that adipose tissue-derived MSCs isolated from obese pigs show increased propensity for differentiation into adipocytes and cellular senescence [Citation6].
Epigenetic modulation is implicated in the pathogeneses of metabolic diseases, including obesity [Citation14]. Our previous observations indicate that obesity alters regulation of genome in swine adipose tissue-derived MSCs [Citation3,Citation21,Citation44]. Specifically, obesity upregulates transcriptome of genes involved in regulation of inflammation, senescence, cellular activation, and adhesion, but downregulates transcription, transmembrane, and extracellular regulation in MSCs [Citation22]. However, whether these changes are associated with upstream global epigenetic alterations at the genomic (chromatin) levels, or are mediated by down-stream post-transcriptional or post-translational modifications, is unclear.
This study shows that obese swine MSCs had lower global 5hmC levels than lean MSCs. Given the role of VIT-C as a main cofactor of TET enzymes to promote DNA hydroxymethylation [Citation19], this finding is consistent with relative VIT-C deficiency in the milieu of systemic oxidative stress and antioxidant depletion, as we have previously shown in our dyslipidemic pigs [Citation45–47]. Recently, our group also underscored mitochondrial dysregulation in obese MSCs, including impaired mitochondrial protein import [Citation48] and altered mitochondrial transcriptome [Citation3]. These in turn could adversely impact the Krebs cycle production of alpha-ketoglutarate (αKG), an important co-factor of TET enzymes [Citation19]. Indeed, the increased gene expression of TET1 and TET2 enzymes in obese MSCs in the current study might be consistent with their upregulation to compensate for possible depletion of their major cofactors, VIT-C and αKG in obesity.
Alternatively, genomic content of 5hmC has been linked to various cellular functions such as differentiation, proliferation, and migration. Global 5hmC staining of malignant urogenital tissues is dramatically reduced, compared to significantly higher 5hmC levels in the adjacent tumour-free tissues, in a clinical report of 250 patients [Citation49]. It was suggested that loss of 5hmC is an early event during carcinogenesis, supported by its direct correlation with cyclin-dependent kinase PTEN, p27 (a marker of cell cycle arrest and implicated in cell migration), and PI3K signalling pathway [Citation49]. Consistently, we found obese MSCs to have upregulated mRNA expression of genes involved in cellular function (e.g., cell differentiation, activation and adhesion) and senescence (e.g., evasion of apoptosis) compared to lean MSCs on high-throughput RNA sequencing [Citation22]. This ‘dysfunctional profile’ places obese MSCs at increased risk of switching to the neoplastic phenotype, characterized by aberrant cellular differentiation.
Previous reports have described comparable patterns of 5hmC reduction in obesity. Ciccarone et al. demonstrated a fall in 5hmC levels in mice fed with high-fat diet, accompanied by upregulation of TET3 gene and protein levels, despite a decrease in αKG [Citation50]. Pirola and colleagues observed lower amount of 5hmC in association with impaired mitochondrial biogenesis in non-alcoholic fatty liver disease (NAFLD) patients [Citation51], whereas Lyall et al. [Citation36] found dynamic 5hmC changes at a discrete number of functionally important genes in NAFLD mice fed with high-fat diet [Citation36]. Conversely, in obese patients undergoing bariatric surgery, BMI, waist circumference, total cholesterols, and triglycerides, directly correlated with global 5hmC levels [Citation52], underscoring a complex link between obesity and 5hmC epigenetic alterations.
Reversing epigenetic modifications or ‘epigenetic reprogramming’ of dysfunctional MSCs using the naturally occurring modulator VIT-C is a promising novel strategy [Citation19]. We observed restored 5hmC marks in obese MSCs co-incubated with VIT-C, whereas 5hmC levels in lean MSCs were unaffected. Responsiveness of global 5hmC levels in obese MSCs to VIT-C may stem from their higher gene expression of TET1 and TET2, for which VIT-C serves as a co-factor.
In our study, obese MSCs had less genomic H3K4me3 than lean MSCs, but comparable H3K9me3 and H3K27me3 levels, suggesting depletion of histone activating marks, which in tandem with lower global 5hmC contributes to decreased genomic transcription. This observation is consistent with the upregulation in our obese MSCs of LSD2, a histone demethylase enzyme specific for H3K4me3 residues [Citation53]. Congruently, H3K4me3 is depleted on different loci in morbidly obese subjects with prediabetes [Citation54], and also correlates with BMI and HOMA-IR [Citation54]. We similarly observed a significant correlation between diminished H3K4me3 marks and greater swine body weight. We did not observe changes in global H3K9me3 and H3K27me3 in our obese MSCs, possibly due to the early phase of the experimental models, given that these are late-phase epigenetic marks with lower turnover rates [Citation55].
Histone tri-methylation occur in response to changes in S-adenosylmethionine and S-adenosylhomocysteine from the methionine cycle. Dysregulated production of methionine has been linked to an acute drop in genome-wide H3K4me3 and decreased transcriptional activity. For example, dietary alterations of methionine intake induce rapid changes in global H3K4me3 levels [Citation56], whereas methionine-deprivation decreases levels of H3K4, H3K9, and H3K27, especially H3K4me3, suggesting a decrease in gene activation [Citation56].
Co-incubation with VIT-C modified histone tri-methylation marks in both lean and obese MSCs; VIT-C decreased H3K4me3 of lean MSCs, and decreased H3K9me3 and H3K27me3 marks in obese MSCs. VIT-C supplementation induced specific demethylation of H3K9me2, but did not affect H3K4me2, in mouse embryonic stem cells [Citation57], and has a specific effect on H3K27me3 epigenetic marks [Citation58]. Differential response of histone methylation to VIT-C between our obese and lean MSCs may again be related to upregulated gene expression of the epigenetic enzyme histone methyltransferase EZH2 (KMT6) in obese MSCs, which is associated with the Polycomb Repressive Complexes and is relatively specific for the H3K27 modifications [Citation59].
In our MSCs, 5hmC correlated directly with migration and proliferation of MSCs, 5hmC and H3K4me3 correlated inversely with serum cholesterol levels, and H3K4me3 correlated directly with MSC proliferation and inversely with body weight. Hence, reduced genomic 5hmC and H3K4me3 in our obese MSCs correspond with characteristics of obesity and its complications, including dyslipidemia and cellular dysfunction [Citation2]. Therefore, these data support the potential beneficial effects of VIT-C on DNA hydroxymethylation epigenetic marks of MSCs, as it increased 5hmC in obese MSCs. Notably, VIT-C induced a global demethylating epigenomic effect on both DNA and histone in obese MSCs, consistent with its role as a key cofactor of TET and histone demethylase enzymes.
This study is limited by the sample size of lean and obese MSCs. Second, future studies will need to examine other aspects of the reparative capacity of MSCs. For example, the correlation of 5hmC with MSC migration in our study should be tested before and after VIT-C co-incubation of MSCs, and gene-silencing of TET1/TET2/TET3 using isoform specific siRNAs (e.g., siGENOME). Third, serum measurement of VIT-C was not available in our samples. However, we previously found lower VIT-C levels in hypercholesterolemic swine experimental models [Citation45]. Finally, the detailed time course of the observed epigenetic changes warrants additional studies. Alterations in 5hmC, 5-methylcytosine, and expression of TET enzymes were also observed after 8 and 16 weeks in the hearts of mice treated with high-fat fed diet [Citation50].
In conclusion, we characterized global DNA hydroxymethylation and histone tri-methylation in adipose tissue-derived MSCs in experimental swine obesity. Reduced global 5hmC and H3K4me3 marks suggest that obesity imposes epigenetic changes in MSCs, but unchanged H3K9me3 and H3K27me3 suggest that its effects tend to impose mostly transcriptional repression rather than activation. VIT-C may be capable of reversing deleterious epigenetic changes in DNA hydroxymethylation of obese MSCs. Future studies are required to confirm these findings, and evaluate the possibility of epigenetic reversal using the VIT-C to ‘reprogram’ dysfunctional MSCs for enhanced reparative capacity in obesity.
Financial support
NIH grant numbers: DK120292, DK102325, and DK122734.
Disclosure statement
Dr Lerman receives grant funding from Novo Nordisk, and is an advisor to Weijian Technologies and AstraZeneca. Other authors declare they have no competing interest.
Additional information
Funding
References
- Swinburn BA, Sacks G, Hall KD, et al. The global obesity pandemic: shaped by global drivers and local environments. Lancet. 2011;378:804–814.
- Kim BS, Pallua N, Bernhagen J, et al. The macrophage migration inhibitory factor protein superfamily in obesity and wound repair. Exp Mol Med. 2015;47(5):e161.
- Meng Y, Eirin A, Zhu XY, et al. The metabolic syndrome modifies the mRNA expression profile of extracellular vesicles derived from porcine mesenchymal stem cells. Diabetol Metab Syndr. 2018;10(1):58.
- Eirin A, Zhu XY, Ferguson CM, et al. Intra-renal delivery of mesenchymal stem cells attenuates myocardial injury after reversal of hypertension in porcine renovascular disease. Stem Cell Res Ther. 2015;6(1):7.
- Nargesi AA, Lerman LO, Eirin AJ. Mesenchymal stem cell-derived extracellular vesicles for kidney repair: current status and looming challenges. Stem Cell Res Ther. 2017;8(1):273.
- Zhu XY, Ma S, Eirin A, et al. Functional plasticity of adipose‐derived stromal cells during development of obesity. Stem Cells Transl Med. 2016;5(7):893–900.
- Akinyemiju T, Do AN, Patki A, et al. Epigenome-wide association study of metabolic syndrome in African-American adults. Clin Epigenetics. 2018;10(1):49.
- Cheng Z, Zheng L, Almeida FA. Epigenetic reprogramming in metabolic disorders: nutritional factors and beyond. J Nutr Biochem. 2018;54:1–10.
- Rogers JM. Smoking and pregnancy: epigenetics and developmental origins of the metabolic syndrome. Birth Defects Res. 2019;111(17):1259–1269.
- Samblas M, Milagro FI, Martínez A. DNA methylation markers in obesity, metabolic syndrome, and weight loss. Epigenetics. 2019;14(5):421–444.
- Sun D, Zhang T, Su S, et al. Body mass index drives changes in DNA methylation: a longitudinal study. Circ Res. 2019;125(9):824–833.
- Friso S, Carvajal CA, Fardella CE, et al. Epigenetics and arterial hypertension: the challenge of emerging evidence. Transl Res. 2015;165(1):154–165.
- Ramos-Lopez O, Riezu-Boj JI, Milagro FI, et al. Endoplasmic reticulum stress epigenetics is related to adiposity, dyslipidemia, and insulin resistance. Adipocyte. 2018;7:137–142.
- Feinberg AP, Longo DL. The key role of epigenetics in human disease prevention and mitigation. N Engl J Med. 2018;378(14):1323–1334.
- Alexanian AR. Epigenetic modulators promote mesenchymal stem cell phenotype switches. Int J Biochem Cell Biol. 2015;64:190–194.
- Frühbeck G, Catalán V, Rodríguez A, et al. Involvement of the leptin-adiponectin axis in inflammation and oxidative stress in the metabolic syndrome. Sci Rep. 2017;7(1):6619.
- Rani V, Deep G, Singh RK, et al. Oxidative stress and metabolic disorders: pathogenesis and therapeutic strategies. Life Sci. 2016;148:183–193.
- Camarena V, Wang G. The epigenetic role of vitamin C in health and disease. Cell Mol Life Sci. 2016;73:1645–1658.
- Cimmino L, Neel BG, Aifantis I. Vitamin C in stem cell reprogramming and cancer. Trends Cell Biol. 2018;28(9):698–708.
- Wang T, Chen K, Zeng X, et al. The histone demethylases Jhdm1a/1b enhance somatic cell reprogramming in a vitamin-C-dependent manner. Cell Stem Cell. 2011;9(6):575–587.
- Conley SM, Zhu X-Y, Eirin A, et al. Metabolic syndrome alters expression of insulin signaling-related genes in swine mesenchymal stem cells. Gene. 2018;644:101–106.
- Pawar AS, Eirin A, Krier JD, et al. Alterations in genetic and protein content of swine adipose tissue-derived mesenchymal stem cells in the metabolic syndrome. Stem Cell Res. 2019;37:101423.
- Eirin A, Zhu XY, Woollard JR, et al. Metabolic syndrome interferes with packaging of proteins within porcine mesenchymal stem cell‐derived extracellular vesicles. Stem Cells Transl Med. 2019;8(5):430–440.
- Pawar AS, Zhu XY, Eirin A, et al. Adipose tissue remodeling in a novel domestic porcine model of diet‐induced obesity. Obesity. 2015;23(2):399–407.
- Conley SM, Shook JE, Zhu XY, et al. Metabolic syndrome induces release of smaller extracellular vesicles from porcine mesenchymal stem cells. Cell Transplant. 2019;28(9–10):1271–1278.
- Saad A, Zhu XY, Herrmann S, et al. Adipose-derived mesenchymal stem cells from patients with atherosclerotic renovascular disease have increased DNA damage and reduced angiogenesis that can be modified by hypoxia. Stem Cell Res Ther. 2016;7(1):128.
- Dai Y, Chen J, Li H, et al. Characterizing the effects of VPA, VC and RCCS on rabbit keratocytes onto decellularized bovine cornea. PLoS One. 2012;7(11):e50114.
- Thaler R, Maurizi A, Roschger P, et al. Anabolic and antiresorptive modulation of bone homeostasis by the epigenetic modulator sulforaphane, a naturally occurring isothiocyanate. J Biol Chem. 2016;291(13):6754–6771.
- Pollock K, Samsonraj RM, Dudakovic A, et al. Improved post-thaw function and epigenetic changes in mesenchymal stromal cells cryopreserved using multicomponent osmolyte solutions. Stem Cells Dev. 2017;26(11):828–842.
- Dudakovic A, Camilleri ET, Paradise CR, et al. Enhancer of zeste homolog 2 (Ezh2) controls bone formation and cell cycle progression during osteogenesis in mice. J Biol Chem. 2018;293(33):12894–12907.
- Konermann S, Brigham MD, Trevino AE, et al. Optical control of mammalian endogenous transcription and epigenetic states. Nature. 2013;500(7463):472–476.
- Tao H, Dai C, Ding JF, et al. Epigenetic aberrations of miR-369-5p and DNMT3A control Patched1 signal pathway in cardiac fibrosis. Toxicology. 2018;410:182–192.
- Kalari KR, Nair AA, Bhavsar JD, et al. MAP-RSeq: mayo analysis pipeline for RNA sequencing. BMC Bioinformatics. 2014;15(1):224.
- Kim D, Pertea G, Trapnell C, et al. TopHat2: accurate alignment of transcriptomes in the presence of insertions, deletions and gene fusions. Genome Biol. 2013;14(4):R36.
- Liao Y, Smyth GK, Shi W. featureCounts: an efficient general purpose program for assigning sequence reads to genomic features. Bioinformatics. 2014;30(7):923–930.
- Lyall MJ, Thomson JP, Cartier J, et al. Non-alcoholic fatty liver disease (NAFLD) is associated with dynamic changes in DNA hydroxymethylation. Epigenetics. 2020;15(1–2):61–71.
- Sun Z, Evans J, Bhagwate A, et al. CAP-miRSeq: a comprehensive analysis pipeline for microRNA sequencing data. BMC Genomics. 2014;15(1):423.
- Robinson MD, McCarthy DJ, Smyth GK. edgeR: a Bioconductor package for differential expression analysis of digital gene expression data. Bioinformatics. 2010;26(1):139–140.
- Medvedeva YA, Lennartsson A, Ehsani R, et al. EpiFactors: a comprehensive database of human epigenetic factors and complexes. Database. 2015;2015.
- Zemany L, Kraus BJ, Norseen J, et al. Downregulation of STRA6 in adipocytes and adipose stromovascular fraction in obesity and effects of adipocyte-specific STRA6 knockdown in vivo. Mol Cell Biol. 2014;34(6):1170–1186.
- Ahmad R, Rah B, Bastola D, et al. Obesity-induces organ and tissue specific tight junction restructuring and barrier deregulation by claudin switching. Sci Rep. 2017;7(1):5125.
- Oñate B, Vilahur G, Camino-López S, et al. Stem cells isolated from adipose tissue of obese patients show changes in their transcriptomic profile that indicate loss in stemcellness and increased commitment to an adipocyte-like phenotype. BMC Genomics. 2013;14(1):625.
- Eirin A, Zhu XY, Puranik AS, et al. Mesenchymal stem cell–derived extracellular vesicles attenuate kidney inflammation. Kidney Int. 2017;92(1):114–124.
- Meng Y, Eirin A, Zhu XY, et al. Obesity‐induced mitochondrial dysfunction in porcine adipose tissue‐derived mesenchymal stem cells. J Cell Physiol. 2018;233(8):5926–5936.
- Chade AR, Bentley MD, Zhu X, et al. Antioxidant intervention prevents renal neovascularization in hypercholesterolemic pigs. J Am Soc Nephrol. 2004;15(7):1816–1825.
- Rodriguez-Porcel M, Lerman LO, Holmes DR Jr, et al. Chronic antioxidant supplementation attenuates nuclear factor-κB activation and preserves endothelial function in hypercholesterolemic pigs. Cardiovasc Res. 2002;53(4):1010–1018.
- Traber MG, Buettner GR, Bruno RS. The relationship between vitamin C status, the gut-liver axis, and metabolic syndrome. Redox Biol. 2018;21:101091.
- Nargesi AA, Zhu XY, Hickson LJ, et al. Metabolic syndrome modulates protein import into the mitochondria of porcine mesenchymal stem cells. Stem Cell Rev Rep. 2019;15(3):427–438.
- Munari E, Chaux A, Vaghasia AM, et al. Global 5-hydroxymethylcytosine levels are profoundly reduced in multiple genitourinary malignancies. PLoS One. 2016;11(1):e0146302.
- Ciccarone F, Castelli S, Ioannilli L, et al. High dietary fat intake affects DNA methylation/hydroxymethylation in mouse heart: epigenetic hints for obesity‐related cardiac dysfunction. Mol Nutr Food Res. 2019;63:1800970.
- Pirola CJ, Scian R, Gianotti TF, et al. Epigenetic modifications in the biology of nonalcoholic fatty liver disease: the role of DNA hydroxymethylation and TET proteins. Medicine (Baltimore). 2015;94:e1480.
- Nicoletti CF, Nonino CB, de Oliveira BAP, et al. DNA methylation and hydroxymethylation levels in relation to two weight loss strategies: energy-restricted diet or bariatric surgery. Obes Surg. 2016;26(3):603–611.
- D’Oto A, Tian QW, Davidoff AM, et al. Histone demethylases and their roles in cancer epigenetics. J Med Oncl Ther. 2016;1:34–40.
- Castellano-Castillo D, Denechaud P-D, Fajas L, et al. Human adipose tissue H3K4me3 histone mark in adipogenic, lipid metabolism and inflammatory genes is positively associated with BMI and HOMA-IR. PLoS One. 2019;14(4):e0215083.
- Barth TK, Imhof A. Fast signals and slow marks: the dynamics of histone modifications. Trends Biochem Sci. 2010;35(11):618–626.
- Mentch SJ, Mehrmohamadi M, Huang L, et al. Histone methylation dynamics and gene regulation occur through the sensing of one-carbon metabolism. Cell Metab. 2015;22(5):861–873.
- Ebata KT, Mesh K, Liu S, et al. Vitamin C induces specific demethylation of H3K9me2 in mouse embryonic stem cells via Kdm3a/b. Epigenet Chromatin. 2017;10(1):36.
- Zhang T, Huang K, Zhu Y, et al. Vitamin C–dependent lysine demethylase 6 (KDM6)-mediated demethylation promotes a chromatin state that supports the endothelial-to-hematopoietic transition. J Biol Chem. 2019;294(37):13657–13670.
- Mentch SJ, Locasale JW. One carbon metabolism and epigenetics: understanding the specificity. Ann N Y Acad Sci. 2016;1363(1):91–98.