
 ?Mathematical formulae have been encoded as MathML and are displayed in this HTML version using MathJax in order to improve their display. Uncheck the box to turn MathJax off. This feature requires Javascript. Click on a formula to zoom.
ABSTRACT
Background: With the improved life expectancy of people living with HIV (PLWH), identifying vulnerable subpopulations at high mortality risk is important. Evidences showed that DNA methylation (DNAm) is associated with mortality in non-HIV populations. Here, we established a panel of DNAm biomarkers that can predict mortality risk among PLWH.
Methods: 1,081 HIV-positive participants from the Veterans Ageing Cohort Study (VACS) were divided into training (N = 460), validation (N = 114), and testing (N = 507) sets. VACS index was used as a measure of mortality risk among PLWH. Model training and fine-tuning were conducted using the ensemble method in the training and validation sets and prediction performance was assessed in the testing set. The survival analysis comparing the predicted high and low mortality risk groups and the Gene Ontology enrichment analysis of the predictive CpG sites were performed.
Results: We selected a panel of 393 CpGs for the ensemble prediction model that showed excellent performance in predicting high mortality risk with an auROC of 0.809 (95%CI: 0.767,0.851) and a balanced accuracy of 0.653 (95%CI: 0.611, 0.693) in the testing set. The high mortality risk group was significantly associated with 10-year mortality (hazard ratio = 1.79, p = 4E-05) compared with low risk group. These 393 CpGs were located in 280 genes enriched in immune and inflammation response pathways.
Conclusions: We identified a panel of DNAm features associated with mortality risk in PLWH. These DNAm features may serve as predictive biomarkers for mortality risk among PLWH.
Abbreviations: AUC: Area Under Curve; CI: Confidence interval; DMR: differentially methylated region; DNA: Deoxyribonucleic acid; DNAm: DNA methylation; DAVID: Database for Annotation, Visualization, and Integrated Discovery; EWA: epigenome-wide association; FDR: False discovery rate; FWER: Family-wise error rate; GLMNET: elastic-net-regularized generalized linear models; GO: Gene ontology; HIV: Human immunodeficiency virus; HM450K: Human Methylation 450 K BeadChip; k-NN: k-nearest neighbours; NK: Natural killer; PC: Principal component; PLWH: people living with HIV; QC: Quality control; SVM: Support Vector Machines; VACS: Veterans Ageing Cohort Study; XGBoost: Extreme Gradient Boosting Tree
Introduction
Combination antiretroviral therapy has significantly improved the life expectancy of people living with HIV (PLWH), but there is still a gap in life expectancy between PLWH and the general population [Citation1–4]. It is important to identify vulnerable groups with a high risk of mortality among PLWH and to deliver early interventions and clinical care for those patients. Previous studies have demonstrated that the Veterans Ageing Cohort Study (VACS) index is significantly associated with mortality and is considered a measure of mortality risk among PLWH [Citation5–7]. The VACS index is a composite score summing HIV progression measures and general organ injury indicators of the kidneys and liver, which may be able to capture the early stage of elevated risk for mortality.
A large body of evidence has demonstrated that epigenetic modification is influenced by internal and external environmental changes and is associated with the early stages of pathophysiological processes [Citation8–11]. DNA methylation (DNAm), one of the most widely studied epigenetic marks, is strongly correlated with ageing [Citation12–14], substance use (e.g., cigarette smoking and alcohol consumption) [Citation15–21], and a variety of diseases [Citation8–11,Citation22,Citation23]. Since DNAm is relatively stable and easy to detect in body fluids obtained through non-invasive procedures, DNAm marks have emerged as robust biomarkers for disease diagnosis [Citation24], disease subtype classification [Citation25,Citation26], and treatment response monitoring [Citation27,Citation28].
Since DNAm biomarkers are objectively measured and can reflect pathological processes of disease progression, DNAm can be used to identify individual vulnerability and mortality risk among PLWH. In some cases, DNAm alterations can occur before clinical diagnosis. For example, a longitudinal study of DNAm showed that most DNA methylome changes occurred 80–90 days before clinically detectable glucose elevation [Citation29]. As another example, mitochondrial epigenetic changes can indicate early-stage prediabetes [Citation30]. Although the clinical diagnosis of myocardial infarction has been well established, DNA methylation in the blood has utility in the diagnosis and monitoring of cardiac pathologies and in the study of normal human cardiac physiology and development [Citation31]. These studies support the utility of DNAm features as biomarkers of risk for future onset of disease. Here, we apply this approach to identify individuals with a high risk of mortality in an HIV-positive population.
DNAm plays an important role in HIV infection and disease progression. We previously reported the association of two CpG sites in the promoter region of NLRC5 with HIV infection [Citation32]. NLRC5 is a major transcriptional activator of the MHC class I gene. DNAm has also been linked to HIV comorbid diseases, such as diabetes and kidney function [Citation33,Citation34]. Furthermore, ageing is significantly associated with thousands of CpGs in the epigenome, and the epigenetic clock and DNAm age are becoming widely recognized [Citation12–14]. DNAm marks are predictive of mortality in non-HIV populations [Citation35–40]. Therefore, we hypothesized that DNAm is associated with mortality risk among PLWH and that DNAm signatures in the blood can serve as biomarkers to predict mortality among HIV-positive individuals.
Machine learning methods have been widely applied to select DNAm features that are informative for the clinical diagnosis and classification of complex diseases [Citation20,Citation41,Citation42]. Ensemble machine learning methods can aggregate multiple machine learning models (base models) and usually provide better prediction outcomes than single base models [Citation43,Citation44]. An ensemble approach has been shown to perform well in personalized medicine and disease outcomes, such as in cancer and diabetes [Citation45,Citation46].
In this study, by applying an ensemble machine learning approach, we aimed to identify DNAm features that can serve as biomarkers of mortality risk among HIV-positive individuals. Here, the VACS index was used as a measure of mortality risk in an HIV-positive population [Citation5–7,Citation47]. These predictive DNAm biomarkers can potentially be used for informing future clinical care and providing new insights into the epigenetic mechanism of mortality risk among HIV-positive patients.
Methods
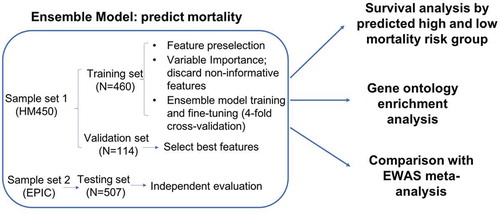
An overview of our analytical approach is shown in the flowchart in . Our prediction model was built with training and validation sets profiled on the 450 K array and then independently evaluated with the testing set profiled on the EPIC array. Briefly, we first applied an ensemble learning approach to build a machine learning model to predict high or low mortality risk, and we then examined the association of the selected CpG features with mortality by a survival analysis. Then, we conducted a Gene Ontology enrichment analysis for the selected DNAm features. Last, we conducted a meta-analysis of the epigenome-wide association (EWA) on the VACS index of the entire sample.
Figure 1. Flowchart of analytical procedures for selecting CpG sites in the peripheral blood methylome, machine learning prediction models to predict high and low mortality risk groups, survival analysis, Gene Ontology enrichment analysis, and epigenome-wide association analysis
Study population
All participants in sample sets 1 and 2 () were from the VACS that is a prospective cohort study of veterans focusing on the clinical outcomes of HIV infection [Citation5]. DNA samples were extracted from the peripheral blood of 1,081 HIV-positive men from the VACS. Participants in sample set 1 were randomly partitioned into a training set (80%, N = 460) and a validation set (20%, N = 114), and sample set 2 was used as the independent testing set (N = 507). shows the demographic and clinical information on patient age, sex, race, smoking status, CD4 count, viral load, HIV medication adherence, VACS index, and mortality in the training, validation, and testing sets. The training and validation sets included slightly older individuals and more African Americans than the testing set. The VACS index was slightly lower in the testing set than in the training and validation sets. There were no significant differences in sex, smoking, HIV medication adherence, CD4 count, log10 HIV-1 viral load or 10-year mortality across the three sample sets.
Table 1. Study sample characteristics
Mortality risk
The VACS index is a well-established score for mortality risk among PLWH [Citation5–7]. The VACS index is scored by summing preassigned points for age, CD4 count, HIV-1 RNA, hemoglobin, platelets, aspartate, and alanine transaminase (AST and ALT), creatine, estimated glomerular filtration rate (eGFR), and viral hepatitis C infection [Citation7]. High mortality risk among PLWH was defined as a VACS index score > 40, which was based on a prior observation that the predicted 3-year mortality of 10% for this group was significantly higher than that for the group with VACS index scores ≤ 40 [Citation48]. Prediction models were developed by machine learning methods to predict high mortality risk (VACS index > 40) and low mortality risk (VACS index ≤ 40) groups among PLWH.
Genome-wide DNAm profiling and quality control
DNA samples in sample set 1 were profiled by Infinium Human Methylation 450 K BeadChip (HM450K, Illumina Inc., CA, USA), and DNA samples in sample set 2 were profiled by the Infinium Human Methylation EPIC BeadChip (Illumina Inc., CA, USA) (). DNAm for the training and validation sets were evaluated using the same quality control (QC) protocol [Citation49] in the R package minfi [Citation50]. In detail, CpG sites on sex chromosomes and within 10 base pairs of a single nucleotide polymorphism were removed. The detection p-value threshold was set at 10−12 for both sample sets 1 and 2. After QC, 408,583 CpG sites common between the HM450K and EPIC arrays were used for analysis to ensure the same coverage between the two sets. DNA methylation among the common CpG sites was highly correlated between the HM450K and EPIC arrays (r = 0.986). Proportions of 6 cell types (CD4 + T cells, CD8 + T cells, natural killer T cells, B cells, monocytes, and granulocytes) were estimated for all participants in sample sets 1 and 2 using an established method [Citation51].
Feature selection of CpG sites in the training set
We first preselected a panel of CpG sites associated with high mortality risk among PLWH based on the EWA of the VACS index score in the training set. CpG sites with p < 0.001 were preselected to build the prediction models. A liberal cut-off of p < 0.001 was arbitrarily set to ensure a sufficient number of predictive DNAm features to build the prediction models. The variable importance (a score between 0 and 100) of each preselected CpG site was ranked by elastic-net regularized generalized linear models (GLMNET) by the R package caret [Citation52] based on 100 bootstraps, where each bootstrap included 70% of all samples. CpG sites with zero variable importance for 80% of the bootstraps were considered to be nonpredictive features and were removed from further model development. The remaining CpG sites were ranked based on the median importance ranking among 100 bootstraps and were divided into 20 groups. Each CpG group was used to build machine learning models.
Developing machine learning prediction models for mortality risk among PLWH
1) Model development in the training set: We developed an ensemble method that aggregated the prediction results from four base machine learning models: random forest (RF), GLMNET, support vector machines (SVM) and k-nearest neighbours (k-NN) [Citation53–56] using the model choice of ‘rf’, ”glmnet”, ”svmLinear” and ‘knn’ in the R package caret [Citation52]. These four base models have been commonly used in predicting binary outcomes and have expanded the diversity of algorithms [Citation53–56]. Ten-fold cross-validation was used in the model training process to minimize overfitting. These four base models were independently trained to predict mortality risk among PLWH in the training set and then aggregated by the ensemble method using the R package caretEnsemble (ver. 2.0.1) [Citation57]. The prediction performance of each ensemble model was evaluated by using area under the receiver operating characteristic curve (auROC) and the area under the precision-recall curve (auPRC).
2) Final CpG group selection in the validation set: The CpG group with the highest auROC in the validation set was selected as the final feature group for the ensemble model.
3) Independent evaluation in the testing set: Using the ensemble model and the final feature group, we predicted the high mortality risk group and evaluated prediction performance in the testing set by using auROC and balanced accuracy. Balanced accuracy was defined as the average accuracy obtained on each class, as shown in the following formula [Citation58]. Balanced accuracy was used in this study to avoid biased accuracy due to imbalanced samples [Citation58]. The 95% confidence interval of balanced accuracy was estimated by 1,000 stratified bootstraps of the testing set.
Survival analysis
By using the final ensemble model, we classified each individual in the entire sample as having as high or low mortality risk. Kaplan-Meier survival curves presented 10-year survival probability by high or low mortality risk group. Survival analysis was conducted using a Cox proportional hazards model on 10-year mortality comparing the high and low mortality risk groups. We used age as time scale t, and our model adjusted for sex, race, smoking, self-reported HIV medication adherence, log10 of HIV viral load and CD4 count.
Biological interpretation of the predictive panel of CpG sites on mortality risk among PLWH
We performed Gene Ontology (GO) enrichment analysis using missMethyl to adjust for bias by different numbers of CpG sites per gene [Citation59,Citation60]. Genes that harbour or are located near at least one predictive CpG site were used for GO analysis.
Epigenome-wide association analysis on mortality risk among PLWH in all samples
Since DNA methylation of two sample sets was measured by two different platforms, we performed EWA on high and low mortality risk groups separately in sample sets 1 and 2, and we then conducted a meta-analysis to detect epigenome-wide signals in the entire sample. In each EWA, we used a two-step linear model approach as previously described [Citation49]. The EWA model adjusted for confounding factors, including age, sex, race, smoking, cell type proportions and control principle components. EWA meta-analysis of sample sets 1 and 2 was conducted using METAL [Citation61]. The weights of effect size were the inverse of the corresponding standard errors for the meta-analysis [Citation61]. CpG sites with Bonferroni corrected p-value < 0.05 were considered statistically significant.
Results
Feature selection and ensemble model training for mortality risk among PLWH
High mortality risk among PLWH was defined as VACS index > 40 based on previous literature showing a predicted 3-year mortality of 10% for this group [Citation48]. Prediction models were developed by machine learning methods to predict high mortality risk (VACS index > 40) and low mortality risk groups (VACS index ≤ 40) among PLWH.
A panel of 856 CpGs with p < 0.001 was preselected based on EWA in the training set. We ranked these candidate predictors by median GLMNET importance ranking among 100 bootstraps using 70% of the training sample. We excluded 178 CpG sites that had a variable importance score of zero among 80% of the bootstraps. A final panel of 678 CpG sites were selected and formed into 20 groups based on importance ranking to determine the best performing CpG group for the ensemble model ().
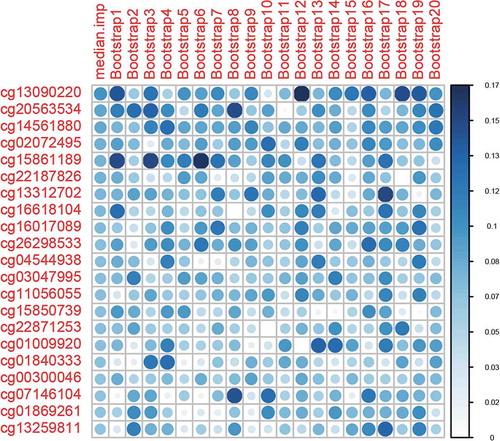
Figure 2. Variable importance ranking of predictive machine learning CpG sites. Variable importance is a score between 0 and 100, as calculated by elastic-net-regularized generalized linear models (GLMNET). We obtained variable importance scores from 100 bootstraps. The top 20 ranked CpG sites and 20 bootstraps are shown
In the training set, we used 4 common machine learning classification models (RF, GLMNET, SVM, and k-NN) as our base models for the ensemble method [Citation53–56] and trained them independently for the 20 groups of CpGs. The performance metrics of GLMNET, RF and SVM were mostly comparable in terms of auROC and auPRC, and they plateaued to 1 with an increasing number of CpGs in the training set (). The performance of k-NN was poorer than the other 3 methods, but its auROC and auPRC remained above 0.9 in the training set. An ensemble model combining the prediction results of all 4 base models was used ().
Figure 3. Area under the receiver operating characteristic (auROC) curve in the training and validation sets
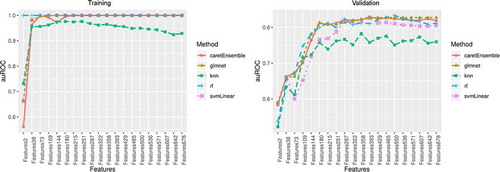
Figure 4. Area under the precision-recall curve (auPRC) in the training and validation sets
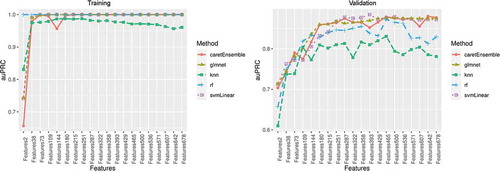
In the validation set, the performances of 4 base models varied. Three models, GLMNET, RF, and SVM, showed good performance with both auROC and auPRC > 0.8, but the performance of k-NN was poor with auROC < 0.8 (). The ensemble model showed the best performance at 393 CpG sites with an excellent performance of auROC (0.829). The accuracy of this prediction model was 0.807, and the balanced accuracy that accounted for class imbalances between participants at high and low risk of mortality was 0.782. Thus, the ensemble model with 393 DNAm features was used as the final prediction model (Table S1).
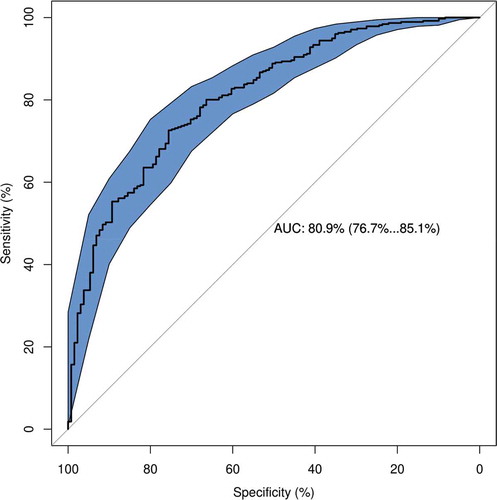
In the testing set, the ensemble model with 393 DNAm features showed excellent performance with auROC of 0.809 (95%CI: 0.767–0.851), prediction accuracy of 0.761 and balanced accuracy of 0.653 (95%CI: 0.611, 0.693) (), suggesting that our ensemble model with a panel of 393 features was able to differentiate between high and low mortality risk in an HIV-positive population.
Figure 5. Receiver operating characteristic (auROC) curve in the testing set
Survival analysis
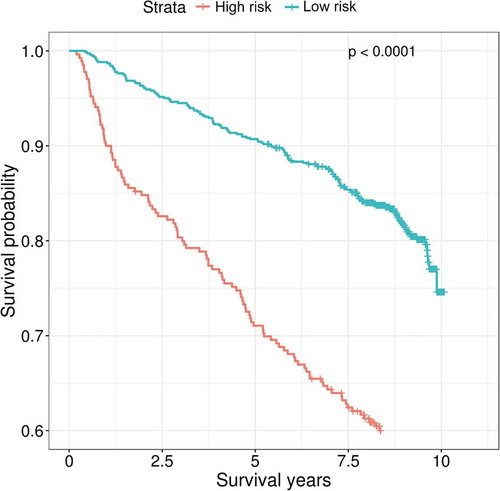
By using our ensemble model that predicts individual mortality risk, we found that participants predicted to have a high risk of mortality showed significantly lower 10-year survival probability than participants predicted to have a low risk of mortality (). Using a Cox proportional-hazards model adjusting for baseline age, sex, race, viral load, CD4 count and antiviral medication adherence, participants who were predicted to have a high risk of mortality remained to have an elevated risk of mortality compared with those predicted to have a low risk of mortality, with a hazard ratio (HR) of 1.79 (95%CI: 1.35–2.37, p = 4E-05).
Figure 6. Kaplan-Meier curves of predicted high and low mortality risk groups among people living with HIV
Biological interpretations of predictive CpGs by Gene Ontology enrichment analysis
The 393 predictive CpGs were located in or near 280 genes. The top 8 enriched pathways based on these 280 genes included response to virus (p = 4.26E-05), defence response (p = 1.29E-04), cytokine receptor binding (p = 1.48E-04) and regulation of response to interferon-gamma (p = 4.15E-04) (). Our findings suggested that the selected 393 CpG sites are biologically relevant to HIV pathogenesis and progression.
Table 2. Gene ontology term enrichment analysis of the selected 393 CpG sites that predict mortality risk among HIV-positive population
Table 3. Overlapping CpG sites between machine learning selected CpG sites and epigenome-wide significant CpG sites on mortality risk among people living with HIV
Epigenome-wide association on mortality risk among PLWH
A meta-analysis of EWA of sample sets 1 and 2 identified 208 epigenome-wide significant CpGs after Bonferroni correction (Figure S2). These significant CpG sites were located in 112 genes and included genes previously reported as being associated with HIV pathogenesis. For example, cg07839457 in NLRC5 was previously reported to be associated with HIV infection [Citation32]. Interestingly, 30 of 208 CpG sites were also in the panel of machine learning predictive CpGs (). Twenty out of the 30 overlapping CpG sites were negatively associated with mortality risk, while 10 CpG sites were positively associated with mortality risk. Some of the overlapping CpGs were located in viral response genes, such as IFITM1 and PARP9.
Discussion
In this study, we presented evidence that DNAm marks in blood were predictive of mortality risk in an HIV-positive population. We identified a panel of 393 CpG sites that were highly predictive for high vs. low risk of mortality among PWLH. We also found that our predicted mortality risk based on the ensemble model was strongly associated with mortality in HIV-positive individuals in the VACS cohort. In addition, the selected 393 DNAm features were located in genes enriched in HIV pathogenesis and progression. Thus, we identified a panel of 393 DNAm biomarkers that may enhance the understanding of the epigenetic mechanisms of mortality risk among PLWH.
We demonstrated that a machine learning approach can predict mortality risk among HIV-positive individuals across different methylation data sets. One of the challenges of a machine learning method is overfitting. We attempted to limit overfitting in the development of the ensemble prediction models in several ways: 1) model development and final model and feature selection were conducted separately in the training and validation sets, 2) 10-fold cross-validation was performed during the training, 3) the ensemble model was used to aggregate prediction results from multiple base models instead of arbitrarily choosing a specific machine learning prediction model, and 4) the final model was evaluated in an independent test set. We further observed that the performance of different models generated by the individual machine learning method varied. The ensemble-based modeling method outperformed some base models and could aggregate prediction results from all base models. Furthermore, our prediction model was built on training and validation sets profiled on the 450 K array, and it was independently evaluated in the testing set that was profiled on the EPIC array. Of note, removing batch effects is an important step in EWA analysis. Methods have been applied to address the bias related to batches [Citation62]. Here, our goal was to select a set of generalizable methylation markers that are relatively stable regardless of batch, cohort, and other confounding factors. Without removing batch effects within the set of CpG sites common to both arrays, our model still showed good predictive performance, indicating that our model is generalizable, regardless of methylation platform. Our results suggested that the ensemble prediction model is relatively stable and robust.
Our results showed that the CpG-based ensemble prediction model is strongly associated with mortality in an HIV-positive population. This finding is consistent with previous literature showing that DNAm marks in blood can predict mortality in non-HIV populations [Citation40]. We found that 30 out of 393 CpGs reached epigenome-wide significance. The majority of the 393 CpG sites are located within or near genes that are involved in known HIV pathology and progression. For example, cg22930808 on PARP9 and cg07107453 on IFI44 were selected by the machine learning prediction model and reached epigenome-wide significance; both genes are involved in HIV pathogenesis. Both cg22930808 and cg07107453 are less methylated in the high mortality risk group than in the low mortality risk group. IFI44 is an interferon-alfa inducible protein and is associated with infection by several viruses. A previous study showed that higher expression of IFI44 facilitated HIV-1 latency [Citation63], which may increase mortality risk. In addition, cg12359279 is located in the MX1 gene (Interferon-Induced GTP-Binding Protein Mx1). MX1 encodes a GTP-metabolizing protein that is induced by interferon I and II and is involved in interferon gamma signaling and the Toll-like signaling pathway.
Studies have shown that comorbidity and ageing are associated with HIV-related excess mortality [Citation64–66], and some immune biomarkers can partially explain HIV-related excess mortality risk [Citation67]. Since the VACS index included measures of immune function and indicators for general organ injury, it is plausible that predictive CpG sites (based on the VACS index) are located near genes involved in immune system development or other functions, such as liver or kidney functions. Among the 393 predictive CpG sites, no CpG site located on the genes overlapped with previously reported liver or kidney diseases. However, two of the 393 CpG sites, cg16249932, and cg00463367, are located near genes related to immune system development (MAEA and GATA3).
The biological relevance of these 393 CpG sites was further supported by the Gene Ontology enrichment analysis. The top enriched pathways, such as response to virus and cytokine receptor binding, may indicate important biological pathways that lead to increased risk of mortality among PLWH.
We acknowledge that there are several limitations in this study. We defined high mortality risk by a cut-off of 40 for the VACS index based on previous literature, with a predicted 3-year mortality of 10% for individuals with a VACS index score >40 [Citation48]; the cut-off for defining high mortality risk may vary in other populations. Additionally, the generalizability of our prediction model may be limited because our samples were predominantly middle-aged men. All samples in our study were HIV-positive, and we cannot infer whether the identified CpGs are relevant to predicting mortality in an HIV-negative population. Last, we are unable to validate the array-based DNA methylation of the selected CpG sites by machine learning or to identify significant CpG sites by EWAS through a different platform. However, in a different sample, we found a high correlation of PBMC methylome between EPIC and the methyl-capture sequencing platform (r = 0.986) on the same 4 peripheral blood monocyte cells. Future studies in other populations to validate the ensemble prediction model are warranted.
Conclusions
We identified a panel of 393 predictive DNAm features in blood that was predictive of mortality risk among PLWH. These DNAm features may serve as biomarkers to identify individuals at high risk for mortality and may help to prioritize genes to better understand the mechanisms of mortality risk in an HIV-positive population. These DNAm features have the potential to be used for monitoring HIV progression in future clinical care.
Authors’ contributions
CS was responsible for data analysis and manuscript preparation. ACJ provided DNA samples and clinical data and contributed to manuscript preparation. XZ was responsible for the bioinformatics data processing. VM was involved in clinical data collection and manuscript preparation. DH and EJ contributed to the analytical approach and to manuscript preparation. KX was responsible for the study design, study protocol, sample preparation, data analysis, interpretation of findings, and manuscript preparation.
Availability of data and materials
Demographic and clinical variables and DNAm data for the VACS samples were submitted to GEO dataset (GSE117861) and are available to the public. All codes for analysis are also available upon request to the corresponding author.
Ethics approval and consent to participate
The study was approved by the Committee of the Human Research Subject Protection at Yale University and the Institutional Research Board Committee of the Connecticut Veteran Healthcare System. All subjects provided written consent.
Supplemental Material
Download Zip (542.3 KB)Acknowledgments
The authors appreciate the supports of the Veteran Ageing Study Cohort Biomarker Core and the Yale Center of Genomic Analysis.
Disclosure statement
The authors declare that they have no competing interests.
Supplementary material
Supplemental data for this article can be accessed here.
Additional information
Funding
References
- Wandeler G, Johnson LF, Egger M. Trends in life expectancy of HIV-positive adults on antiretroviral therapy across the globe: comparisons with general population. Curr Opin HIV AIDS. 2016;11(5):492–500.
- Teeraananchai S, Kerr S, Amin J, et al. Life expectancy of HIV-positive people after starting combination antiretroviral therapy: a meta-analysis. HIV Med. 2017;18(4):256–266.
- Marcus JL, Chao CR, Leyden WA, et al. Narrowing the gap in life expectancy between HIV-infected and HIV-uninfected individuals with access to care. J Acquired Immun Def Syndr. 2016;73(1):39–46.
- Gueler A, Moser A, Calmy A, et al. Life expectancy in HIV-positive persons in Switzerland: matched comparison with general population. AIDS. 2017;31(3):427.
- Justice AC, Dombrowski E, Conigliaro J, et al. Veterans aging cohort study (VACS): overview and description. Med Care. 2006;44(8 Suppl 2):S13.
- Justice AC, Modur S, Tate JP, et al. Predictive accuracy of the Veterans Aging Cohort Study (VACS) index for mortality with HIV infection: a north American cross cohort analysis. J Acquired Immun Def Syndr. 2013;62(2):149.
- Tate JP, Justice AC, Hughes MD, et al. An internationally generalizable risk index for mortality after one year of antiretroviral therapy. AIDS. 2013;27(4):563–572.
- Lam K, Pan K, Linnekamp JF, et al. DNA methylation based biomarkers in colorectal cancer: a systematic review. Biochim Biophys Acta (BBA)- Rev Cancer. 2016;1866(1):106–120.
- Teroganova N, Girshkin L, Suter CM, et al. DNA methylation in peripheral tissue of schizophrenia and bipolar disorder: a systematic review. BMC Genet. 2016;17(1):27.
- Bakusic J, Schaufeli W, Claes S, et al. Stress, burnout and depression: a systematic review on DNA methylation mechanisms. J Psychosomatic Res. 2017;92:34–44.
- Li M, D’Arcy C, Li X, et al. What do DNA methylation studies tell us about depression? A systematic review. Transl Psychiatry. 2019;9(1):68.
- Horvath S. DNA methylation age of human tissues and cell types. Genome Biol. 2013;14(10):3156.
- Horvath S, Raj K. DNA methylation-based biomarkers and the epigenetic clock theory of ageing. Nat Rev Genet. 2018;19(6), 371 doi:10.1038/s41576-018-0004-3
- Hannum G, Guinney J, Zhao L, et al. Genome-wide methylation profiles reveal quantitative views of human aging rates. Mol Cell. 2013;49(2):359–367.
- Liu C, Marioni RE, ÅK H, et al. A DNA methylation biomarker of alcohol consumption. Mol Psychiatry. 2018;23(2):422.
- Breitling LP, Yang R, Korn B, et al. Tobacco-smoking-related differential DNA methylation: 27K discovery and replication. Am J Hum Genet. 2011;88(4):450–457.
- Gao X, Zhang Y, Breitling LP, et al. Relationship of tobacco smoking and smoking-related DNA methylation with epigenetic age acceleration. Oncotarget. 2016;7(30):46878–46889.
- Joubert BR, Håberg SE, Nilsen RM, et al. 450K epigenome-wide scan identifies differential DNA methylation in newborns related to maternal smoking during pregnancy. Environ Health Perspect. 2012;120(10):1425–1431.
- Lee KW, Pausova Z. Cigarette smoking and DNA methylation. Front Genet. 2013;4:132.
- Zhang X, Hu Y, Aouizerat BE, et al. Machine learning selected smoking-associated DNA methylation signatures that predict HIV prognosis and mortality. Clin Epigenetics. 2018;10(1):155.
- Zhang R, Miao Q, Wang C, et al. Genome‐wide DNA methylation analysis in alcohol dependence. Addict Biol. 2013;18(2):392–403.
- Kraiczy J, Nayak KM, Howell KJ, et al. DNA methylation defines regional identity of human intestinal epithelial organoids and undergoes dynamic changes during development. Gut. 2019;68(1):49–61.
- Nano J, Ghanbari M, Wang W, et al. Epigenome-wide association study identifies methylation sites associated with liver enzymes and hepatic steatosis. Gastroenterology. 2017;153(4):1096–106.e2.
- Delpu Y, Cordelier P, Cho W, et al. DNA methylation and cancer diagnosis. Int J Mol Sci. 2013;14(7):15029–15058.
- Figueroa ME, Lugthart S, Li Y, et al. DNA methylation signatures identify biologically distinct subtypes in acute myeloid leukemia. Cancer Cell. 2010;17(1):13–27.
- Holm K, Hegardt C, Staaf J, et al. Molecular subtypes of breast cancer are associated with characteristic DNA methylation patterns. Breast Cancer Res. 2010;12(3):R36.
- Berdasco M, Esteller M. Clinical epigenetics: seizing opportunities for translation. Nat Rev Genet. 2019;20(2):109–127.
- Mohammad HP, Barbash O, Creasy CL. Targeting epigenetic modifications in cancer therapy: erasing the roadmap to cancer. Nat Med. 2019;25(3):403–418.
- Chen R, Xia L, Tu K, et al. Longitudinal personal DNA methylome dynamics in a human with a chronic condition. Nat Med. 2018;24(12):1930–1939.
- Zheng LD, Linarelli LE, Brooke J, et al. Mitochondrial epigenetic changes link to increased diabetes risk and early-stage prediabetes indicator. Oxid Med Cell Longevity. 2016;2016:5290638.
- Zemmour H, Planer D, Magenheim J, et al. Non-invasive detection of human cardiomyocyte death using methylation patterns of circulating DNA. Nat Commun. 2018;9(1):1443.
- Zhang X, Justice AC, Hu Y, et al. Epigenome-wide differential DNA methylation between HIV-infected and uninfected individuals. Epigenetics. 2016;11(10):750–760.
- Chen J, Huang Y, Hui Q, et al. Epigenetic associations with estimated glomerular filtration rate (eGFR) among Men with HIV infection. Clin Infect Dis. 2020.70(4), 667–673.
- Mathur R, Hui Q, Huang Y, et al. DNA methylation markers of type 2 diabetes mellitus among male veterans with or without human immunodeficiency virus infection. J Infect Dis. 2019;219(12):1959–1962.
- Marioni RE, Shah S, McRae AF, et al. DNA methylation age of blood predicts all-cause mortality in later life. Genome Biol. 2015;16(1):25.
- Marioni RE, Harris SE, Shah S, et al. The epigenetic clock and telomere length are independently associated with chronological age and mortality. Int J Epidemiol. 2016;45(2):424–432.
- Perna L, Zhang Y, Mons U, et al. Epigenetic age acceleration predicts cancer, cardiovascular, and all-cause mortality in a German case cohort. Clin Epigenetics. 2016;8(1):64.
- Christiansen L, Lenart A, Tan Q, et al. DNA methylation age is associated with mortality in a longitudinal Danish twin study. Aging Cell. 2016;15(1):149–154.
- Fransquet PD, Wrigglesworth J, Woods RL, et al. The epigenetic clock as a predictor of disease and mortality risk: a systematic review and meta-analysis. Clin Epigenetics. 2019;11(1):62.
- Zhang Y, Wilson R, Heiss J, et al. DNA methylation signatures in peripheral blood strongly predict all-cause mortality. Nat Commun. 2017;8:14617.
- Holder LB, Haque MM, Skinner MK. Machine learning for epigenetics and future medical applications. Epigenetics. 2017;12(7):505–514.
- Crowgey EL, Marsh AG, Robinson KG, et al. Epigenetic machine learning: utilizing DNA methylation patterns to predict spastic cerebral palsy. BMC Bioinformatics. 2018;19(1):225.
- Dietterich TG. Ensemble methods in machine learning. International workshop on multiple classifier systems. Springer; 2000.
- Dietterich TG. Ensemble learning. Handbook Brain Theory Neural Net. 2002;2:110–125.
- Moon H, Ahn H, Kodell RL, et al. Ensemble methods for classification of patients for personalized medicine with high-dimensional data. Artif Intell Med. 2007;41(3):197–207.
- Alghamdi M, Al-Mallah M, Keteyian S, et al. Predicting diabetes mellitus using SMOTE and ensemble machine learning approach: the Henry Ford ExercIse Testing (FIT) project. PLoS One. 2017;12:7.
- Bebu I, Tate J, Rimland D, et al. The VACS index predicts mortality in a young, healthy HIV population starting highly active antiretroviral therapy. J Acquir Immune Defic Syndr. 2014;65(2):226–230.
- Justice AC, Modur SP, Tate JP, et al. Predictive accuracy of the Veterans Aging Cohort Study index for mortality with HIV infection: a North American cross cohort analysis. J Acquir Immune Defic Syndr. 2013;62(2):149–163.
- Lehne B, Drong AW, Loh M, et al. A coherent approach for analysis of the Illumina HumanMethylation450 BeadChip improves data quality and performance in epigenome-wide association studies. Genome Biol. 2015;16(1):37.
- Aryee MJ, Jaffe AE, Corrada-Bravo H, et al. Minfi: a flexible and comprehensive Bioconductor package for the analysis of Infinium DNA methylation microarrays. Bioinformatics. 2014;30(10):1363–1369.
- Houseman EA, Accomando WP, Koestler DC, et al. DNA methylation arrays as surrogate measures of cell mixture distribution. BMC Bioinformatics. 2012;13(1):86.
- KuhnMJ.Building Predictive Models in R Using the caret Package. J Stat Softw.2008;285 doi:10.18637/jss.v028.i05
- Hastie T, Tibshirani R, Friedman J, et al. The elements of statistical learning: data mining, inference and prediction. Math Intelligencer. 2005;27(2):83–85.
- Kotsiantis SB, Zaharakis I, Pintelas P. Supervised machine learning: A review of classification techniques. Emerg Artif Intelligence Appl Comp Eng. 2007;160:3–24.
- Chen T, Guestrin C, editors. Xgboost: A scalable tree boosting system. Proceedings of the 22nd acm sigkdd international conference on knowledge discovery and data mining; 2016: ACM.San Francisco, California, USA.
- Ogutu JO, Piepho H-P, Schulz-Streeck T. A comparison of random forests, boosting and support vector machines for genomic selection. BMC Proc. 2011;5 Suppl 3(Suppl 3)):S11–S.
- Deane-Mayer ZA, Knowles J. caretEnsemble: ensembles of caret models. R package version. 2016;2.
- Brodersen KH, Ong CS, Stephan KE, et al., editors. The balanced accuracy and its posterior distribution. 20th International Conference on Pattern Recognition; 2010: IEEE. Istanbul, Turkey.
- Phipson B, Maksimovic J, Oshlack A. missMethyl: an R package for analyzing data from Illumina’s HumanMethylation450 platform. Bioinformatics. 2015;32(2):286–288.
- Geeleher P, Hartnett L, Egan LJ, et al. Gene-set analysis is severely biased when applied to genome-wide methylation data. Bioinformatics. 2013;29(15):1851–1857.
- Willer CJ, Li Y, Abecasis GRJB. METAL: fast and efficient meta-analysis of genomewide association scans. Bioinformatics. 2010;26(17):2190–2191.
- Chen D-P, Lin Y-C, Fann CSJ. Methods for identifying differentially methylated regions for sequence- and array-based data. Brief Funct Genomics. 2016;15(6):485–490.
- Power D, Santoso N, Dieringer M, et al. IFI44 suppresses HIV-1 LTR promoter activity and facilitates its latency. Virology. 2015;481:142–150.
- Hentzien M, Dramé M, Allavena C, et al. Impact of age-related comorbidities on five-year overall mortality among elderly HIV-infected patients in the late HAART era—role of chronic renal disease. J Nutr Health Aging. 2016;20(4):408–414.
- Langebeek N, Kooij KW, Wit FW, et al. Impact of comorbidity and ageing on health-related quality of life in HIV-positive and HIV-negative individuals. AIDS. 2017;31(10):1471–1481.
- Hentzien M, Dramé M, Delpierre C, et al. HIV-related excess mortality and age-related comorbidities in patients with HIV aged≥ 60: a relative survival analysis in the French Dat’AIDS cohort. BMJ Open. 2019;9(1):e024841.
- So-Armah KA, Tate JP, Chang CCH, et al. Do biomarkers of inflammation, monocyte activation, and altered coagulation explain excess mortality between HIV infected and uninfected people? J Acquir Immune Def Syndr. 2016;72(2):206–213.