
ABSTRACT
A newly-developed platform, the Illumina TruSeq Methyl Capture EPIC library prep (TruSeq EPIC), builds on the content of the Infinium MethylationEPIC Beadchip Microarray (EPIC-array) and leverages the power of next-generation sequencing for targeted bisulphite sequencing. We empirically examined the performance of TruSeq EPIC and EPIC-array in assessing genome-wide DNA methylation in breast tissue samples. TruSeq EPIC provided data with a much higher density in the regions when compared to EPIC-array (~2.74 million CpGs with at least 10X coverage vs ~752 K CpGs, respectively). Approximately 398 K CpGs were common and measured across the two platforms in every sample. Overall, there was high concordance in methylation levels between the two platforms (Pearson correlation r = 0.98, P < 0.0001). However, we observed that TruSeq EPIC measurements provided a wider dynamic range and likely a higher quantitative sensitivity for CpGs that were either hypo- or hyper-methylated (β close to 0 or 1, respectively). In addition, when comparing different breast tissue types TruSeq EPIC identified more differentially methylated CpGs than EPIC-array, not only out of additional sites interrogated by TruSeq EPIC alone, but also out of common sites interrogated by both platforms. Our results suggest that both platforms show high reproducibility and reliability in genome-wide DNA methylation profiling, while TruSeq EPIC had a significant improvement over EPIC-array regarding genomic resolution and coverage. The wider dynamic range and likely higher precision of the estimates by the TruSeq EPIC may lead to the identification of novel differentially methylated markers that are associated with disease risk.
Introduction
DNA methylation is an essential epigenetic mechanism involved in gene regulation in the human genome. It is a DNA modification whereby a methyl group is added to Cytosine-5 at C-phosphate-G (CpG) dinucleotides. Methylation of CpG islands at the 5ʹ end of the promoter region of a gene is generally associated with gene repression [Citation1]. DNA methylation reflects both environmental and genetic influences and varies across individuals [Citation2,Citation3,Citation4]. Aberrant DNA methylation can lead to dysregulation of cellular processes and plays a critical role in the pathophysiology of various diseases including diabetes, cardiovascular diseases, and cancer [Citation5,Citation6,Citation7,Citation8]. Investigation of variation in DNA methylation in recent epigenome-wide association studies (EWAS) in large numbers of human samples have provided remarkable insight into the biological mechanisms that underlie health outcomes [Citation9,Citation10,Citation11].
The success of methylation studies requires the development of methods that can measure DNA methylation simultaneously across the genome. Whole-genome bisulphite sequencing (WGBS) is considered the gold standard method to interrogate DNA methylation with the highest genomic coverage and nucleotide resolution for quantification of DNA methylation [Citation12]. However, the high cost and high data analysis burden of this method make it infeasible for studies with a large number of samples. The Illumina Infinium Methylation EPIC Beadchip Microarray (EPIC-array) provides a cost-effective platform that has been commonly used for high-throughput profiling of DNA methylation for over 850 K CpGs [Citation13,Citation14]. This microarray-based method uses a fixed number of probes to survey specific genomic loci across the genome; thus, it is unable to expand beyond genomic regions dictated by both the number and specificity of the probes, thereby limiting the comprehensive screening of the genome for altered methylation loci. EPIC-array also suffers from the limitations inherent to the hybridization technology such as errors introduced by probe cross-hybridization when measuring methylation level. To overcome these limitations of EPIC-array and reduce sequencing-associated costs and processing time, Illumina, Inc. has recently developed a new platform, the TruSeq Methyl Capture EPIC Library kit (TruSeq EPIC), which builds on EPIC-array content with additional emerging epigenetic regions of interest [Citation15]. It leverages the power of next-generation sequencing (NGS) to perform targeted bisulphite sequencing and covers approximately 3.34 million CpG sites. TruSeq EPIC provides a balanced, intermediate option between WGBS and EPIC-array to survey the human methylome with an increased coverage and resolution.
As TruSeq EPIC complements and expands on EPIC-array, and the latter has been commonly used in recent EWAS of large human samples, TruSeq EPIC may become an attractive option for future EWAS that aims to enhance genome coverage and resolution but maintain research continuity. Only one study has been recently reported to compare the performance of TruSeq EPIC and EPIC-array in cord blood [Citation16]. However, no evaluation has been done to compare the two platforms in human breast tissue. Furthermore, no study has yet examined the performance of TruSeq EPIC in investigating inter-individual variation from human tissue samples, which is the main interest in EWAS. It is also unclear whether the higher resolution provided by TruSeq EPIC may help detect more genomic sites showing inter-individual variation. To address these issues, we compared the two platforms on DNA methylation profiling in 11 human breast tissue samples, including 3 normal breast tissue samples from healthy women, 4 breast tumour and 4 matched adjacent normal breast tissue samples from breast cancer patients. We first evaluated the technical performance of TruSeq EPIC in these tissue samples and then compared the two methods across key functional genomic regions in the context of their coverage and concordance of methylation calls. Lastly, as proof-of-principle, in this small sample, we examined the utility of the two methods in studying inter-individual variation and compared their performance in detecting genomic sites that are differentially methylated across breast tissue types. The goal of this study is to provide an empirical comparison of the two methods to inform researchers on considering and choosing an appropriate platform for future EWAS.
Results
Overview of TruSeq EPIC and EPIC-array analyses of human breast tissue samples
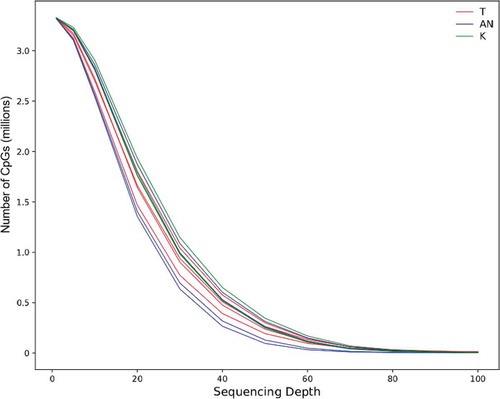
Sample information on the 11 breast tissue samples is presented in . We first evaluated the technical performance of the TruSeq EPIC method in these samples. Mapping efficiency, sequencing duplication rates, and sequencing bait specificities are summarized in . On average, approximately 56 million paired-end reads were generated per sample, of which 48 million aligned uniquely to the bisulphite-converted human reference genome (hg19/GRCH37). Thirty-two million reads remained after removal of duplicate reads and 96% of the reads were found within the target region. TruSeq EPIC is designed to have >90% overlap with the EPIC-array target regions and capture approximately up to 3.34 million CpG sites in its bait-targeted region. In our breast tissue samples, we detected on average 3.32 million CpG sites at any read depth. The number of CpGs detected at different read depths are shown in and . We detected approximately 2.74 million CpGs with at least 10X coverage in all of our samples. Our samples have an average read depth of 40X.
Table 1. Sample information for the 11 beast tissue samples in this study
Table 2. Summary of sequencing alignment and duplication rates for the 11 breast tissue samples in the study for TruSeq EPIC
Table 3. The number of CpGs detected by Truseq EPIC at different sequencing depths
Figure 1. Genomic coverage of the TruSeq EPIC at different sequencing depths for the 11 breast tissue samples. T, breast tumour tissue; AN, adjacent normal breast tissue; K, normal breast tissue
The EPIC-array is designed to capture 862,927 CpG sites in human genome, of which 587,611 CpG sites are common to the TruSeq EPIC platform by design. After comprehensive quality control [Citation17], we detected an average of 752,483 CpGs across our 11 breast tissue samples using EPIC-array, of which 507,206 and 398,579 CpGs were also captured by TruSeq EPIC with at least 1X and 10X coverage, respectively.
Comparison of genome coverage by TruSeq EPIC and EPIC-array
We evaluated the number and the distributions of CpGs that were designed to be captured and were empirically captured by TruSeq EPIC and EPIC-array with respect to CpG-island context and other genomic functional features. Out of approximately 3.34 million CpGs designed to be captured by TruSeq EPIC, 50%, 7%, 6%, and 37% belong to CpG islands, shores, shelves and open sea regions, respectively (); 13%, 17%, 6%, 19%, 2%, 8%, 10% and 26%, belong to promoter, 5’UTR, exon, intron, 3ʹUTR, TSS200, TSS1500, and intergenic regions, respectively (); and 47%, 40%, 39%, and 6% belong to DNaseI hypersensitive, open chromatin, TFBS, and FANTOM5 enhancer regions, respectively (). In our breast tissue samples, we detected the majority of the CpGs (>80%) at these genomic features with at least 10X coverage (). The observed distribution of CpGs with genomic features was also similar to the expected by design ().
Figure 2. The distribution of CpGs by different genomic annotations from TruSeq EPIC (≥10X) and EPIC-array platforms. (a) CpG-island context; (b) genomic function context; (c) regulatory region context; (d) chromosome
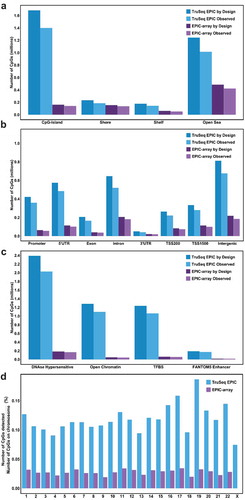
Compared to EPIC-array, TruSeq EPIC detected more CpGs in absolute numbers at each functional annotation class with no surprise (between 1.5 and 25.8 times more), as this methodology is not limited by probes and can therefore interrogate CpG sites comprehensively (). The proportion of CpG loci assessed by TruSeq EPIC and EPIC-array did not differ substantially with respect to genomic functional features except for CpG-islands, where 51% of CpGs detected by TruSeq EPIC were located in CpG-islands, compared to only 19% detected by EPIC-array (). Our data also showed that TruSeq EPIC, compared to EPIC-array, had slightly increased proportions of CpGs in promoter (13% vs. 7%), 5ʹ-UTR (18% vs. 13%), and exon (6% vs. 5%) regions, but significantly increased proportions of CpGs in open chromatin (40% vs. 6%) and TFBS (39% vs. 8%) regions (). Even though the two platforms are designed to cover the same CpG-island and promotor regions, TruSeq EPIC covered these regions at a much higher density and resolution, i.e. TruSeq EPIC detected more CpGs at the same promotor region when compared to EPIC-array. Likewise, TruSeq EPIC generally assayed other genomic regions at a much higher density.
We also evaluated the distribution of CpGs detected by TruSeq EPIC and EPIC-array on each chromosome (). In our breast tissue samples, EPIC-array detected less than 3.5% of CpGs on each chromosome in the human methylome, while TruSeq EPIC significantly increased the proportion by 4–6 folds, ranging between 7% and 19% of CpGs on different chromosomes. Because all samples were from women, no CpG sites were detected on chromosome Y as expected. Compared to the autosomal chromosomes, the X-chromosome has a relatively lower coverage by TruSeq EPIC (7%) and an almost negligible coverage by EPIC-array after quality control.
Comparison of methylation signal calling by TruSeq EPIC and EPIC-array
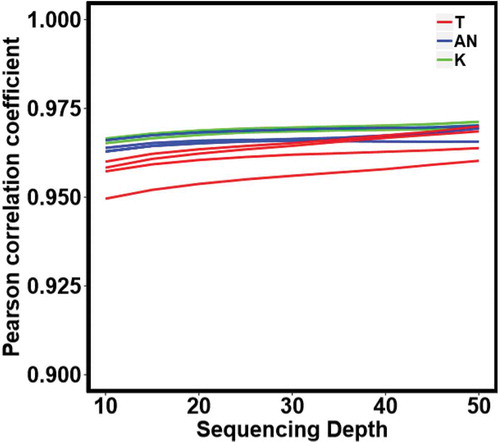
The distribution of methylation β values from both TruSeq EPIC and EPIC-array platforms followed a bimodal distribution as expected. The dynamic range, the range between the largest and the smallest values of the measurements, for methylation β values derived from EPIC-array was more condensed compared to those derived from TruSeq EPIC (). Among the 398,579 common CpGs that were detected by both platforms in all samples, the sample-based correlation between methylation β values from the two platforms was high and increased slightly with increasing coverage (average r = 0.962, 0.966, and 0.968 at 10X, 30X and 50X, respectively). In addition, high correlations were generally observed for all three breast tissue types, with the highest correlation in normal breast tissue, followed by adjacent normal breast tissue, and the lowest in tumour breast tissue ().
Figure 3. Distribution of methylation β values from the two platforms for our 11 breast tissue samples. (a) the common CpGs across the two platforms in TruSeq EPIC (≥10X); (b) the common CpGs in EPIC-array; (c) all CpGs detected in TruSeq EPIC (≥10X); (d) all CpG detected in EPIC-array
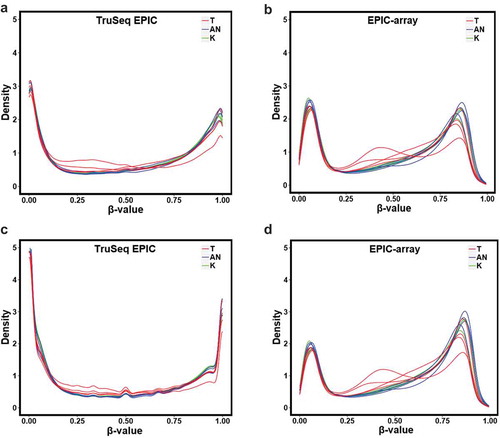
Figure 4. Pearson correlation between methylation β-values of the common CpGs across TruSeq EPIC (≥10X) and EPIC-array platforms by different sequencing depth for our 11 breast tissue samples
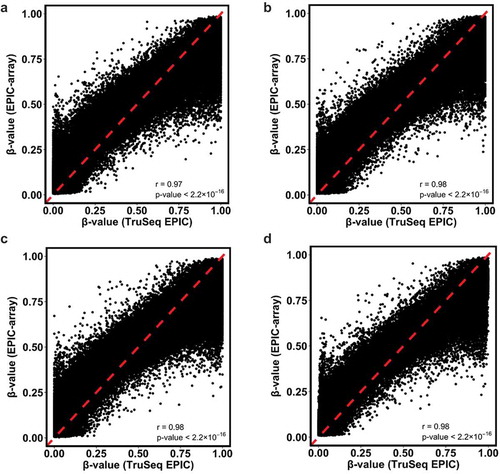
Although the overall correlation between TruSeq EPIC and EPIC-array methylation β values was high (Pearson correlation of 0.98, p < 2.2 X10⁻¹⁶), we observed that the most discrepant signals between the two methodologies occured at CpGs with extremes of either low (close to 0) or high (close to 1) methylation β values (). For CpGs with low β values, the corresponding region showed that TruSeq EPIC measurements clustered close to 0 and corresponding β values from EPIC-array tended to be larger; for CpGs with high β values, the corresponding region showed that TruSeq EPIC measurements clustered close to 1 and corresponding β values from EPIC-array tended to be smaller. The dynamic range of methylation β values from EPIC-array was narrower and more condensed compared to that of TruSeq EPIC. This pattern was consistently observed regardless of breast tissue type ().
Figure 5. Scatterplots and Pearson correlations of the mean methylation β values for the common CpGs from TruSeq EPIC (≥10X) and EPIC-array data. Red dotted lines denote Y = X. (a) T samples; (b) AN samples; (c) K samples; (d) all samples combined
To assess the number of CpGs with concordant and discordant methylation levels between the two methodologies, we grouped the CpGs into three categories based on β values: hypomethylated (β < 0.3), hemimethylated (0.3 ≤ β ≤ 0.7), and hypermethylated (β > 0.7). We observed that 86% of the CpGs were concordant between the two platforms with 32% hypo- and 35% hyper-methylated (). Approximately 5% of the CpGs were detected as hypomethylated by TruSeq EPIC but were detected as hemimethylated by EPIC-array, compared to 0.5% CpGs that were detected as hypomethylated by EPIC-array but were detected as hemimethylated by TruSeq EPIC. On the other hand, 6% of the CpGs were detected as hypermethylated by TruSeq EPIC but were detected as hemimethylated by EPIC-Array, compared to 2% of the CpGs that were detected as hypermethylated by EPIC-array but were detected as hemimethylated by TruSeq EPIC. We did not observe any common feature among these discrepant CpG sites between the two methods, such as sharing similar genomic or functional regions (Supplementary Table 1). It appeared that TruSeq EPIC tended to have measures closer to 0 or 1 at extremes compared to EPIC-array. This clustered distribution of CpGs at the lower and upper extremities of methylation suggested that the TruSeq EPIC may have a wider dynamic range and likely a higher quantitative sensitivity of the measurements than EPIC-array.
Table 4. Concordance of the mean methylation β values of the common CpGs from TruSeq EPIC (≥10X) and EPIC-array platforms
Comparison of the identification of differentially methylated positions (DMPs) by TruSeq EPIC and EPIC-array
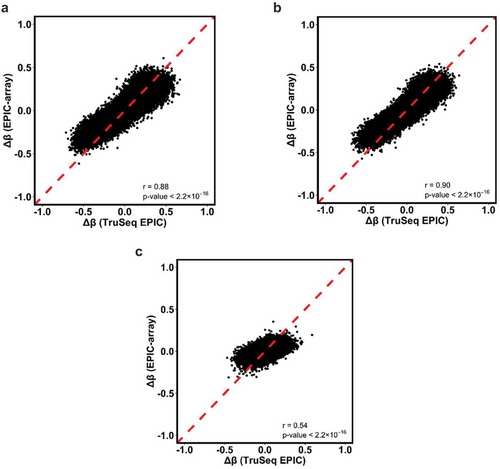
For the 398,579 common CpGs that were detected in all samples across both platforms, we further examined the correlation of the change in methylation β values (∆β) from the two methods in any pairwise comparison of two tissue types (). We found that the correlation of ∆β values was high in tumour vs. normal and tumour vs. adjacent normal breast tissue comparisons (r = 0.88 and 0.90, respectively; all p < 2.2x10⁻¹⁶), while the correlation was moderate in when comparing adjacent normal to normal breast tissue (r = 0.54, p < 2.2x10⁻¹⁶). Similar to the behaviour we observed with the correlation of β values between the two methodologies, we also observed that discrepant signals happened at CpGs with extremes of ∆β values (). As the absolute difference in β values (|∆β|) between any two tissue types increased, the corresponding regions in the two extremes showed more CpGs with larger |∆β| values measured from TruSeq EPIC than those from EPIC-array. This pattern was consistently observed in all pairwise comparisons between tissue types (), but was most pronounced in the comparison between adjacent normal vs. normal breast tissue ().
Figure 6. Scatterplots and Pearson correlations of the mean differences of methylation β values (∆β) for the common CpGs between two tissue types from TruSeq EPIC (≥10X) and EPIC-array data. Red dotted lines denote Y = X. (a) T vs. K; (b) T vs. AN; and (c) AN vs. K
Using |∆β| ≥0.2 as the cut-off, we assessed the number of CpGs with concordant and discordant differences in methylation levels between the two methodologies (). In the comparison between tumour vs. normal breast tissue, 90% of the CpGs had concordant ∆β values between the two platforms, with 6% having |∆β| consistently greater than 0.2. Compared to 8.7% of the CpGs that had |∆β| values greater than 0.2 from TruSeq EPIC but less than 0.2 from EPIC-array, only 1.0% of the CpGs had |∆β| values greater than 0.2 from EPIC-array but less than 0.2 from TruSeq EPIC. There were no CpGs with extreme differences in ∆β values (i.e. |∆β| greater than 0.2 but ∆β in opposite direction from TruSeq EPIC and EPIC-array, upper section). Similar patterns and numbers were observed in the comparison between tumour vs. adjacent normal breast tissue ( middle section). The most striking discrepancies were observed in the comparison between adjacent normal vs. normal breast tissue. Approximately 98% of CpGs had concordant ∆β values between the two platforms, but only 37 CpGs (less than 0.01%) had |∆β| consistently greater than 0.2. While the |∆β| values of 5,781 CpGs (1.5%) were greater than 0.2 from TruSeq EPIC, their corresponding |∆β| values from EPIC-array were less than 0.2. On the other hand, only 30 CpGs (less than 0.008%) had |∆β| values greater than 0.2 from EPIC-array but less than 0.2 from TruSeq EPIC ( lower section). This finding indicates that TruSeq EPIC might be more sensitive to detect subtle difference in DNA methylation between adjacent normal and normal breast tissue.
Table 5. Concordance of the mean differences of methylation β values (∆β) between two tissue types from TruSeq EPIC (≥10X) and EPIC-array data
We further assessed the number of DMPs detected by TruSeq EPIC and EPIC-array () in pairwise tissue comparisons. In the comparison between tumour vs. normal breast tissue, 123,118 and 72,171 out of the common 398,579 CpGs were identified as DMPs by TruSeq EPIC and EPIC-array, respectively, with 56,758 overlapping DMPs across the two methods. While 54% of the DMPs detected by TruSeq EPIC were missed by EPIC-array, only 21% of the DMPs detected by EPIC-array were missed by TruSeq EPIC ( left panel). Similarly, TruSeq EPIC detected approximately twice as many DMPs than EPIC-array in the comparison between tumour vs. adjacent normal breast tissue. The number and proportion of detected and missed DMPs by the two platforms were also similar ( middle panel). Most interestingly, we observed the largest discrepancy between the two platforms in the comparison between adjacent normal vs. normal breast tissue. As expected, with the smaller difference between adjacent normal and normal breast tissue, we detected 17,007 and 1,345 DMPs using TruSeq EPIC and EPIC-array, respectively, with 447 overlapping DMPs across the two methods. TruSeq EPIC detected 13 times more DMPs than EPIC-array and >97% of the DMPs detected by the TruSeq EPIC were missed by the EPIC-array ( right panel). This finding indicates that TruSeq EPIC might be more robust and sensitive to detect subtle differences between similar tissue types. As , our data demonstrated that TruSeq EPIC may detect more variable CpG sites than EPIC-array out of the common CpGs across the two platforms.
Figure 7. The number of differentially methylated positions (DMPs) between tissue types identified by TruSeq EPIC (≥10X) and EPIC-array platforms. DMPs were defined by FDR < 0.05 and |∆β| ≥ 0.1. (a) the common CpGs across the two platforms; (b) all CpGs detected by each platform
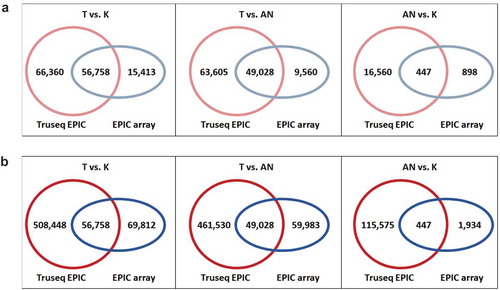
When considering all CpGs detected by each platform, TruSeq EPIC provided a more dense coverage of the epigenome than EPIC-array in our samples (2.74 million CpGs with at least 10X coverage vs. 752 K CpGs, respectively). We performed EWAS and detected approximately 565 K, 511 K, and 116 K DMPs by TruSeq EPIC in the comparisons between tumour vs. normal, tumour vs. adjacent normal, and adjacent normal vs. normal breast tissue, respectively, while the number of DMPs detected by EPIC-array for the corresponding comparisons were, as expected, significantly reduced to 127 K, 109 K, and 2.4 K, respectively (). TruSeq EPIC clearly provided a much higher resolution and allowed for the identification of more altered methylation sites as well as the interrogation of methylation heterogeneity in a given region.
Discussion
High-throughput approaches that measure genome-wide DNA methylation in human samples have been evolving and refined in the past decade, including microarray hybridization and sequencing technologies. In this study, we empirically examined and compared two platforms of high-throughput methylome profiling, TruSeq EPIC and EPIC-array, in human breast tissue samples. Compared to EPIC-array, TruSeq EPIC surveyed a much higher density of CpGs in key functional genomic regions and provided improved coverage of the human epigenome. For the common CpGs across the two platforms, these two technologies were comparable in terms of high correlation and a high concordance of DNA methylation quantification. However, TruSeq EPIC showed a wider dynamic range and a likely higher quantitative sensitivity at the extremes of methylation levels (β values close to 0 or 1) compared to EPIC-array. Finally, as proof-of-principle, we demonstrated in a small samples that methylation β values from TruSeq EPIC could distinguish different breast tissue types and identify more differentially-methylated sites.
Although TruSeq EPIC and EPIC-array are designed to cover similar genomic regions, TruSeq EPIC has a much higher density of CpGs and hence a higher coverage of variable sites. Although EPIC-array represents a significant improvement in genomic coverage compared to the earlier array-based platforms (such as HM450), the majority of regions are still targeted by just one or a few probes and the methylation level of one or a few CpG probes may not always reflect or capture the methylation of the neighbouring CpGs. Thus, the ability of EPIC-array to survey methylation is limited by the fixed number and the fixed location of CpG probes in a given genomic region. While TruSeq EPIC is based on NGS technology that theoretically provides a more comprehensive assessment of methylation in targeted genomic regions, it is of note that the detection of CpG sites also depends on the sequencing depth and usually a minimum of 10X is required for reliable measurements [Citation18]. At this sequencing depth, TruSeq EPIC measured genome-wide DNA methylation in our breast tissue samples at a much higher proportion and density in CpG-island, promoter, 5ʹ-UTR, open chromatin, and TFBS regions, which allowed us a more detailed investigation of methylation heterogeneity of these regulatory regions [Citation1,Citation19].
The excellent agreement of β values from TruSeq EPIC and EPIC-array suggested that the two methodologies were generally comparable and consistent in quantifying DNA methylation levels. The high cross-platform reproducibility facilitates comparative or joint analysis across studies and ensures research continuity. However, discrepancies of methylation calls were also observed, especially at sites with extreme methylation levels (β values closed to 0 or 1). TruSeq EPIC appeared to have a wider dynamic range of measured methylation β values compared to a more condensed range from the EPIC-array. This observation agrees with previous studies that compared microarray- and sequencing-derived methylome datasets [Citation16,Citation18,Citation20].
The discrepancies between TruSeq EPIC and EPIC-array may be attributable to technical differences in DNA methylation assessments, that is, microarray vs. NGS. EPIC-array is a probe-based approach that is limited by the specificity, location, and hybridization processes of the probes. Array signals could be affected by probe cross-reactivity or underlying genetic sequence variations that can influence the accuracy of probe hybridization [Citation21,Citation22,Citation23,Citation24]. Genetic variations, such as single nucleotide polymorphisms (SNPs), can impact DNA methylation estimates by altering the primary sequence of nucleotides to add or eliminate a CpG site or by influencing DNA methylation at nearby CpG loci [Citation25,Citation26]. Reliable estimates from microarrays may also be influenced by the probe signal intensity saturation level at extreme values [Citation27,Citation28]. On the other hand, the sequencing-based TruSeq EPIC approach is not limited by the probes and can directly measure SNPs. Thus, this NGS-based platform likely provides more accurate estimates of the actual methylation degrees compared to the array-based platforms [Citation14,Citation16,Citation29]. In our study, we observed that the most pronounced differences between the two methodologies occurred at CpG sites with extreme methylation levels. The more condensed dynamic range of the estimates from EPIC-array may be explained by imperfect hybridization and possible probe signal intensity saturation at these extreme values. More interestingly, we observed that the individual-level correlation of estimates from the two methods was the highest among normal breast tissue samples, followed by adjacent normal breast tissue, and the lowest among breast tumour tissue samples (). These results are consistent with the notion that tumours are characterized by excessive mutations and genomic instability [Citation30,Citation31]. Somatic mutations in tumours could interfere with probe hybridization and thus decrease the accuracy of DNA methylation measurements in array-based approaches such as EPIC-array, resulting in a lower correlation between array- and sequencing-based platforms in this tissue type.
Few studies have examined the performance of TruSeq EPIC and EPIC-array in measuring genome-wide DNA methylation. Only one study has been recently published by Heiss et al. that compared the performance of the two methods in cord blood [Citation16]. There are both similarities and major differences between our study and theirs. First, there are differences in reproducibility and precision. Neither study included a gold standard such as WGBS, which is important to assess the accuracy of the measurements and understand the discrepancies across the two methods. Their study assessed reproducibility with replicates and found EPIC-array had a higher correlation coefficient between replicates than TruSeq EPIC, while our study did not include replicates of study samples and thus was unable to assess the reproducibility of the two methods. However, reproducibility only reflects the stability, not the precision of the assays. Furthermore, the lower correlation coefficient in TruSeq EPIC in their study did not take into account the analytic pipeline used for the sequencing data, such as pooling and imputation, which could significantly decrease the correlation coefficient of replicates. Next, there are differences in tissue samples. Our study compared the two methods in three different types of breast tissue (tumour, adjacent normal, and normal), while their study compared the two methods in cord blood. It is possible that different tissue types could affect the performance of the two methods differentially. Compared to cord blood, breast tissue samples collected at much later point in life likely accumulate more somatic mutations that could interfere with the hybridization-based EPIC-array more than with TruSeq EPIC. Thus, it is possible that TruSeq EPIC may be the better option for measuring DNA methylation in tissue samples such as breast, other solid tissue, or tumours. Lastly, there are differences in analytic approaches. In our study we directly compared different breast tissue types using regression to identify differentially methylated DNA methylation sites. We found that TruSeq EPIC was able to identify more differentially methylated CpG sites with modest differences between tissue types when compared to EPIC-array. Meanwhile, the study by Heiss et al. performed EWAS using a large pre-existing EPIC-array dataset to form a ‘ground truth’ and compared the two methods’ ability to discriminate between positive and negative markers identified by this EWAS using c-statistics. These two studies had different analytic approaches and goals that may not be directly comparable. Furthermore, as their results showed, there were only slightly differences in c-statistics between the two methods. The differences may likely be due to correlated errors between the ‘ground truth’ and EPIC-array measurements, as they used the same technology, leading to a ‘bias in this benchmark in favor of EPIC,’ as acknowledged by the authors in their discussion. Nonetheless, both studies observed a similar genomic coverage regarding different functional annotations across the two methods as well as the common phenomena that EPIC-array had a reduced dynamic range of methylation measurements compared to TruSeq EPIC.
As proof-of-principle, we performed EWAS between different breast tissue types in a small samples to examine and compare the utility of TruSeq EPIC and EPIC-array in identifying differential methylation. It came no surprise that, compared to EPIC-array, TruSeq EPIC provided an increased density and coverage of the epigenome, and as a result, the detection of more genomic sites showing differential methylation. Certainly, many of these sites were only surveyed by TruSeq EPIC through sequencing. However, even among the common sites across the two platforms, it is worth noting that a much larger number and proportion of CpGs were found to be differentially methylated only by TruSeq EPIC but not by EPIC-array, comparing to a much smaller number and proportion of CpGs that were found differentially methylated only by EPIC-array but not by TruSeq EPIC. This is likely due to the wider dynamic range and/or more accurate measurement of methylation β values detected by TruSeq EPIC as discussed above. These results are consistent with previous studies comparing array-based and sequencing-based technologies in genome-wide DNA methylation profiling [Citation32,Citation33]. Because of the small sample size in our study, our differential methylation analysis across tissue types only serves as a proof-of-principle, which limits our power to interpret the biological relevance of our results when compared to EWAS with large number of samples.
Although TruSeq EPIC identified a similarly larger number of differentially methylated sites than that from EPIC-array in both comparisons of tumour vs. normal and tumour vs. adjacent normal breast tissue, the most intriguing findings came from the comparison between adjacent normal and normal breast tissue, where 97% of the differentially methylated sites identified by TruSeq EPIC were missed by EPIC-array. While the EPIC-array suggested negligible differences in methylation profiles between adjacent normal and normal breast tissue, TruSeq EPIC suggested somewhat otherwise. Commonly, adjacent normal tissue, due to its ready availability, was used as a baseline in comparison with tumour tissue to identify cancer-associated molecular changes. Although histologically normal, non-tumourous tissue adjacent to the tumour is sub-optimal as a baseline control as it is more likely to contain molecular changes in global gene expression and changes in epigenetic markers influenced by the nearby tumour [Citation34,Citation35]. Thus, findings from such comparisons should be interpreted with caution and must consider aberrant changes in adjacent normal tissue. Our results further suggest that the ability to detect subtle changes in adjacent normal tissue may be related to the technology used for epigenetic profiling and that the inherent limitations of EPIC-array in detecting moderate changes may need to be considered additionally when interpreting findings from previous studies that used this technology to compare tumour to adjacent normal tissue.
To the best of our knowledge, our study is the first to systematically investigate genome-wide DNA methylation differences in breast tumour, adjacent normal, and normal tissue using both TruSeqEPIC and EPIC-array technologies. We are not aware of any other studies that make similar comparisons as ours in breast or other tissue types. However, evidence from previous research has suggested that adjacent normal tissue, though pathologically normal, may not be real ‘normal’ at the molecular level. One such study examined gene expression in tumour, adjacent normal, and normal tissue of prostate samples using microarray technology and found distinct gene expression profile for each tissue type, with a subset of genes similarly deregulated in adjacent normal and tumour tissue [Citation36]. Similarly, other studies of breast tissue using microarrays suggested that adjacent normal tissue is not real ‘normal’ as its molecular profile can be altered in response to the adjacent tumour and is, to some extent, similar to that of tumour tissue [Citation34,Citation35,Citation37]. In our study, we not only found that there were methylation differences between normal and adjacent normal tissue, which was in line with these previous studies, but also showed that more methylation differences can be identified using TruSeqEPIC than using EPIC-array, which is a novel finding and has not been assessed in previous studies.
In summary, we performed the first study to empirically evaluate and compare the performance of TruSeq EPIC and EPIC-array in interrogating tissue-specific DNA methylation in breast tissue samples. Although the two platforms showed an excellent overall agreement on measured methylation β values and in the ability to detect sites of differential methylation between samples, TruSeq EPIC provided a much denser coverage of the epigenome as well as a wider dynamic range of methylation measurements. Based on our results, TruSeq EPIC identified a larger number of novel trait-associated sites of differential methylation between samples that were missed by EPIC-array, not only out of the sites interrogated by TruSeq EPIC alone, but also from sites interrogated by both methods. When validated in larger and independent studies, the newly identified sites can generate new knowledge and hypotheses that stimulate further research in understanding the role of DNA methylation in disease development and progression. Overall, our data suggest that TruSeq EPIC may represent a powerful and improved approach to interrogate the methylome and discover novel disease-associated methylation in human tissue in large cohorts.
Material and methods
Breast tissue samples and DNA extraction
This study included 11 breast tissue samples, including 3 normal (K), 4 tumour (T), and 4 matched adjacent normal (AN) breast tissue samples. Normal breast tissue samples were collected from healthy women with no history of breast cancer by the Susan G. Komen Tissue Bank, while breast tumour and matched histologically normal, adjacent tissue samples were collected from patients with primary untreated breast cancer at the Indiana University Simon Cancer Centre Tissue Bank. In general, adjacent normal tissue was excised within the same body site, but away from the cancer lesion macroscopically, and was confirmed to be histologically normal. The distance from the cancer margin to the area of the breast from which the adjacent normal tissue was taken varied case-by-case, but generally had a minimal distance of 3 cm. Normal and tumour samples were matched on race and age (within a year). Basic characteristics of the cohort are provided in . All breast tissue samples were snap-frozen in liquid nitrogen within five minutes of removal and determined to be of high quality through histological and molecular quality control tests. Tumour samples were pathologically verified for high tumour content. Genomic DNA was extracted from freshly frozen normal, tumour and adjacent-normal breast tissue samples using the Qiagen DNeasy Blood and Tissue Kit (Qiagen Venlo, Netherlands). Extracted DNA was first evaluated for its quantity and quality using Agilent TapeStation 4200 (Agilent Technologies, Santa Clara, CA, USA) electrophoresis and Thermo Fisher Qubit 3.0 (Thermo Fisher Scientific, Waltham, MA, USA) fluorometry technologies.
Genome-wide DNA methylation profiling using TruSeq EPIC
Genome-wide DNA methylation profiling was performed using the Illumina TruSeq Methyl Capture EPIC library Prep Kit [Citation15] and NGS technology for genomic DNA sequencing. Five hundred nanograms of high-quality genomic DNA were used for library preparation. Specifically, DNA library preparation first included fragmentation to an average size of 150–200bp using a Covaris S2 ultrasonicator (Covaris Inc., Wobnurn, MA, USA), followed by end-repair, 3ʹ A-tailing, and adaptor ligation. Libraries were then pooled in groups of four in equal aliquot, on which two rounds of hybridization and capture using Illumina-optimized EPIC probe sets (covering >3.3 million targeted CpG sites), bisulphite conversion, and amplification were performed. Five percent PhiX DNA (Illumina Inc.) was added to each library pool during cluster amplification to boost diversity. Construction of DNA libraries and subsequent processing and DNA sequencing of paired-end reads (2 × 100nt reads) were performed according to the standard Illumina protocol using the HiSeq4000 sequencing systems (Illumina Inc.).
TruSeq EPIC data processing
Raw sequencing reads were trimmed to remove both poor quality calls and adapters using Trim Galore! v0.4.4 [Citation38]. Trimmed reads were then aligned to the Genome Reference Consortium human genome build 37 (hg19/GRCH37) [Citation39] using Bismark v0.19.0 [Citation40]. Duplicated reads were removed and cytosine methylation calls were extracted from the deduplicated reads. Methylation calls that overlap with the Illumina EPIC-seq targets were used in downstream analyses. Deduplicated reads on each cytosine locus were used to determine the DNAm levels (β values); a β value is evaluated as the ratio of the number of sequenced methylated cytosine reads to the total number of reads for each locus. Thus, β values range from 0 (completely un-methylated) to 1 (completely methylated). A CpG site was included in downstream analysis if it had a β value determined with ≥10X total reads and was present in each of our tissue samples. After quality control a total of approximately 2.74 million CpG probes remained.
Evaluation of technical performance of TruSeq EPIC
We first assessed mapping efficiency, sequencing duplication rates, and sequencing bait specificities of the DNA methylome of 11 samples generated using TruSeq EPIC. We further examined the number of CpG sites detected at different sequencing depth by TruSeq EPIC in each sample.
Genome-wide DNA methylation profiling using EPIC-array
Genome-wide DNA methylation profiling was also performed using the Illumina Infinium Methylation EPIC Beadchip array (Illumina, San Diego, CA, USA) following the manufacturer’s instructions. Two hundred fifty nanograms of high-quality genomic DNA was subsequently bisulphite converted using the EZ DNA Methylation Kit (Zymo Research, Irine, CA, USA). Bisulphite-treated samples were then amplified, fragmented, purified and hybridized onto the EPIC Beadchip according to the manufacturer’s standard protocol. The arrays were washed and scanned using the Illumina HiScan System.
EPIC-array data processing
Signal intensities and raw methylation β values were extracted from Illumina’s GenomeStudio software. Probes with data from two beads or fewer or with signal detection p-values above 0.01 were removed. Signal intensities were normalized and background subtracted using negative control probes to generate methylation β values. Methylation β values were derived as the ratio of methylation probe intensity to overall intensity. An average of 752,483 CpGs remained after comprehensive quality control [Citation17].
A summary of the key features of TruSeq EPIC and EPIC-array platforms is presented in .
Table 6. Summary of the key features of TruSeq EPIC and the EPIC-array platforms
Comparative analysis of TruSeq EPIC and EPIC-array
To compare TruSeq EPIC and EPIC-array, we only considered the common CpG sites across the two platforms in targeted regions with at least x10 coverage from TruSeq EPIC data and were measured in every sample. We used three metrics: (i) genome coverage; (ii) methylation β values; (iii) identification of differential methylation sites across tissue types. First, we compared the coverage of the human epigenome by both methods in the context of CpG islands, genomic functions, regulatory regions, and chromosomal distributions. CpG island coordinates were obtained from UCSC genome browser, CpG shores were defined as up to 2kb from CpG islands, and CpG shelves were defined as up to 2kb from CpG shores. Genomic feature regions (promotor, 5ʹ-UTR, exon, intron, 3ʹ-UTR, and TSS) for unique genes were downloaded from UCSC genome browser to determine gene-centric coverage. Regulatory regions were defined using ENCODE DNAse hypersensitivity sites and FANTOM5 enhancers. Secondly, we compared methylation β values from TruSeq EPIC and EPIC-array at the same CpG sites using Pearson correlation, scatter plots, distribution plots, and concordance of methylation β values. Lastly, we performed differential methylation analysis to illustrate the utility of both methods for identifying differentially methylated CpG sites across breast tissue types. For EPIC-array data, we used the ChAMP R package [Citation41] and applied a generalized linear model to regress the β values on tissue types while controlling for age. For TruSeq EPIC data, we used the DSS R package [Citation42,Citation43] and applied generalized linear regression model using the read counts. A CpG site was considered differentially methylated when false discovery rate (FDR) was less than 0.05 and the absolute difference in β values was greater than 0.1. We then cross-referenced the differential methylation detected by the two methods.
Authors’ contributions
C.H. designed and directed the study. Y.L. and C.H. designed the assay. N.L. and J.L. performed the methylation sequencing data processing, and N.L. performed the comparative analysis pipeline and additional data processing. A.S. processed samples. J.R.C., J.W., C.W., and Y.L. provided valuable insight, interpretations and advice. N.L. and C.H. wrote the manuscript with inputs from the other authors. All authors read and approved the final manuscript.
Supplemental Material
Download MS Word (19.9 KB)Acknowledgments
We would like to acknowledge the Susan G. Komen ® Tissue Bank and women who contributed breast tissue samples to this study. We thank the Center for Medical Genomics at Indiana University School of Medicine for performing DNA methylation sequencing assay, and EpigenDx, Inc. for performing EPIC-array DNA methylation assay.
Disclosure statement
All authors declare no conflicts of interest.
Supplementary material
Supplemental data for this article can be accessed here.
Additional information
Funding
References
- Greenberg MVC, Bourc’his D. The diverse roles of DNA methylation in mammalian development and disease. Nat Rev Mol Cell Biol. 2019;20(10):590–607.
- Liu Y, Li X, Aryee MJ, et al. GeMes, clusters of DNA methylation under genetic control, can inform genetic and epigenetic analysis of disease. Am J Hum Genet. 2014;94(4):485–495. .
- Zeisel SH. Epigenetic mechanisms for nutrition determinants of later health outcomes. Am J Clin Nutr. 2009;89(5):1488S–1493S.
- Heijmans BT, Tobi EW, Stein AD, et al. Persistent epigenetic differences associated with prenatal exposure to famine in humans. Proc Natl Acad Sci U S A. 2008;105(44):17046–17049.
- Robertson KD. DNA methylation and human disease. Nat Rev Genet. 2005 Aug;6(8):597–610. doi: 10.1038/nrg1655.
- De Carvalho DD, You JS, Jones PA. DNA methylation and cellular reprogramming. Trends Cell Biol. 2010;20(10):609–617.
- Herceg Z, Vaissière T. Epigenetic mechanisms and cancer: an interface between the environment and the genome. Epigenetics. 2011;6(7):804–819.
- Heyn H, Esteller M. DNA methylation profiling in the clinic: applications and challenges. Nat Rev Genet. 2012;13(10):679–692.
- Teschendorff AE, Menon U, Gentry-Maharaj A, et al. Age-dependent DNA methylation of genes that are suppressed in stem cells is a hallmark of cancer. Genome Res. 2010;20(4):440–446.
- Dick KJ, Nelson CP, Tsaprouni L, et al. DNA methylation and body-mass index: a genome-wide analysis. Lancet. 2014;383(9933):1990–1998.
- Rakyan VK, Down TA, Balding DJ, et al. Epigenome-wide association studies for common human diseases. Nat Rev Genet. 2011;12(8):529–541.
- Ziller MJ, Hansen KD, Meer A, et al. Coverage recommendations for methylation analysis by whole-genome bisulfite sequencing. Nat Methods. 2015;12(3):230.
- Moran S, Arribas C, Esteller M. Validation of a DNA methylation microarray for 850,000 CpG sites of the human genome enriched in enhancer sequences. Epigenomics. 2016;8(3):389–399. In.: Epub 2015/ 12/18.PMID: 26673039. .
- Pidsley R, Zotenko E, Peters TJ, et al. Critical evaluation of the illumina MethylationEPIC beadchip microarray for whole-genome DNA methylation profiling. Genome Biol. 2016;17(1):208.
- Illumina (2016) TruSeq methyl capture EPIC library prep kit.1-8
- Heiss JA, Brennan KJ, Baccarelli AA, et al. Battle of epigenetic proportions: comparing Illumina’s EPIC methylation microarrays and TruSeq targeted bisulfite sequencing. Epigenetics. 2020;15(1–2):174–182.
- Heiss JA, Just AC. Identifying mislabeled and contaminated DNA methylation microarray data: an extended quality control toolset with examples from GEO. Clin Epigenetics. 2018;10:73-81.
- Teh AL, Pan H, Lin X, et al. Comparison of methyl-capture sequencing vs. Infinium 450K methylation array for methylome analysis in clinical samples. Epigenetics. 2016;11(1):36–48.
- Lee E-J, Luo J, Wilson JM, et al. Analyzing the cancer methylome through targeted bisulfite sequencing. Cancer Lett. 2013;340(2):171–178.
- Gujar H, Liang JW, Wong NC, et al. Profiling DNA methylation differences between inbred mouse strains on the illumina human infinium methylationEPIC microarray. PLoS One. 2018;13(3):e0193496.
- Aryee MJ, Jaffe AE, Corrada-Bravo H, et al. Minfi: a flexible and comprehensive bioconductor package for the analysis of Infinium DNA methylation microarrays. Bioinformatics. 2014;30(10):1363–1369.
- Dedeurwaerder S, Defrance M, Bizet M, et al. A comprehensive overview of infinium humanMethylation450 data processing. Brief Bioinform. 2014;15(6):929–941.
- Assenov Y, Müller F, Lutsik P, et al. Comprehensive analysis of DNA methylation data with RnBeads. Nat Methods. 2014;11(11):1138.
- Price EM, Cotton AM, Lam LL, et al. Additional annotation enhances potential for biologically-relevant analysis of the illumina infinium humanMethylation450 BeadChip array. Epigenetics Chromatin. 2013;6(1):4.
- Harris RA, Wang T, Coarfa C, et al. Comparison of sequencing-based methods to profile DNA methylation and identification of monoallelic epigenetic modifications. Nat Biotechnol. 2010;28(10):1097.
- Carmona JJ, Accomando WP, Binder AM, et al. Empirical comparison of reduced representation bisulfite sequencing and Infinium BeadChip reproducibility and coverage of DNA methylation in humans. NPJ Genom Med. 2017;2(1):1–10.
- Jaksik R, Iwanaszko M, Rzeszowska-Wolny J, et al. Microarray experiments and factors which affect their reliability. Biol Direct. 2015;10(1):46.
- Skvortsov D, Abdueva D, Curtis C, et al. Explaining differences in saturation levels for affymetrix GeneChip® arrays. Nucleic Acids Res. 2007;35(12):4154–4163.
- Lee J-R, Ryu D-S, Park S-J, et al. Successful application of human-based methyl capture sequencing for methylome analysis in non-human primate models. BMC Genomics. 2018;19(1):267.
- Hanahan D, Weinberg RA. The hallmarks of cancer. cell. 2000;100(1):57–70.
- Hanahan D, Weinberg RA. Hallmarks of cancer: the next generation. cell. 2011;144(5):646–674.
- Bock C, Tomazou EM, Brinkman AB, et al. Quantitative comparison of genome-wide DNA methylation mapping technologies. Nat Biotechnol. 2010;28(10):1106–1114.
- Allum F, Shao X, Guenard F, et al. Characterization of functional methylomes by next-generation capture sequencing identifies novel disease-associated variants. Nat Commun. 2015;6:7211.
- Graham K, Ge X, de Las Morenas A, et al. Gene expression profiles of estrogen receptor–positive and estrogen receptor–negative breast cancers are detectable in histologically normal breast epithelium. Clin Cancer Res. 2011;17(2):236–246.
- Yan PS, Venkataramu C, Ibrahim A, et al. Mapping geographic zones of cancer risk with epigenetic biomarkers in normal breast tissue. Clin Cancer Res. 2006;12(22):6626–6636. .
- Chandran UR, Dhir R, Ma C, et al. Differences in gene expression in prostate cancer, normal appearing prostate tissue adjacent to cancer and prostate tissue from cancer free organ donors. BMC Cancer. 2005;5:45-55.
- Teschendorff AE, Gao Y, Jones A, et al. DNA methylation outliers in normal breast tissue identify field defects that are enriched in cancer. Nat Commun. 2016;7:10478-10489.
- Krueger F (2015) Trim Galore!A wrapper tool around Cutadapt and FastQC to consistently apply quality and adapter trimming to FastQ files.
- Church DM, Schneider VA, Graves T, et al. Modernizing reference genome assemblies. PLoS Biol. 2011;9(7):e1001091. .
- Krueger F, Andrews SR. Bismark: a flexible aligner and methylation caller for Bisulfite-Seq applications. Bioinformatics. 2011;27(11):1571–1572.
- Tian Y, Morris TJ, Webster AP, et al. ChAMP: updated methylation analysis pipeline for illumina beadChips. Bioinformatics. 2017;33(24):3982–3984.
- Wu H, Xu T, Feng H, et al. Detection of differentially methylated regions from whole-genome bisulfite sequencing data without replicates. Nucleic Acids Res. 2015;43(21):e141–e141.
- Park Y, Wu H. Differential methylation analysis for BS-seq data under general experimental design. Bioinformatics. 2016;32(10):1446–1453.