
ABSTRACT
Tremendous work has demonstrated the critical roles of genetics, epigenetics as well as their interplay in brain transcriptional regulations in the pathology of schizophrenia (SZ). There is great success currently in the dissection of the genetic components underlying risk-conferring transcriptomic networks. However, the study of regulating effect of epigenetics in the etiopathogenesis of SZ still faces many challenges. In this work, we investigated DNA methylation and gene expression from the dorsolateral prefrontal cortex (DLPFC) region of schizophrenia patients and healthy controls using weighted correlation network approach. We identified and replicated two expression and two methylation modules significantly associated with SZ. Among them, one pair of expression and methylation modules were significantly overlapped in the module genes which were significantly enriched in astrocyte-associated functional pathways, and specifically expressed in astrocytes. Another two linked expression-methylation module pairs were involved ageing process with module genes mostly related to oligodendrocyte development and myelination, and specifically expressed in oligodendrocytes. Further examination of underlying quantitative trait loci (QTLs) showed significant enrichment in genetic risk of most psychiatric disorders for expression QTLs but not for methylation QTLs. These results support the coherence between methylation and gene expression at the network level, and suggest a combinatorial effect of genetics and epigenetics in regulating gene expression networks specific to glia cells in relation to SZ and ageing process.
Introduction
Schizophrenia (SZ) is known to be a highly heritable and developmental neuropsychiatric disorder, which has around 1% prevalence worldwide [Citation1,Citation2]. In previous neuroimaging studies, SZ has been characterized by brain-wide grey matter reduction [Citation3], functional disconnectivity [Citation4,Citation5] and myelination decrease [Citation6,Citation7] along with significant impairments in cognition [Citation8], and presence of positive and negative symptoms. These brain abnormalities are thought to be mediated by complex molecular processes involving neuronal cell development, differentiation and death, even during the early stage of brain development [Citation9]. Despite substantial efforts on exploring the underlying molecular mechanisms through advanced genomics, epigenetics and transcriptomics techniques, there are still many challenges given the complex interplay among these factors for the aetiology of SZ.
Brain transcriptomics studies have demonstrated substantial transcriptional alterations in the frontal cortex, cerebellum or hippocampus of SZ [Citation10]. Keeping gene expression in balance is critical in maintaining neuronal function, as well as their synaptic interactions. Genetics is a major factor in regulating gene expression and functional pathways [Citation11,Citation12]. Recent landmark work based on dorsolateral prefrontal cortex (DLPFC) post-mortem tissue RNA sequencing has reported 20 ~ 50% of SZ risk loci [Citation13] showing strong cis-effect to regulate the expressions of their nearby genes, further elaborating the liability of these risk variants in aetiology of SZ [Citation14,Citation15]. Co-expression network analyses of brain expression data have identified some modules highly associated with SZ harbouring- the SZ risk loci with strong cis-acting effects [Citation14,Citation15,Citation16]. However, some co-expression modules show discrepancy in relation with SZ and the polygenic risk score for SZ. Several SZ-related modules fail to be significantly enriched in SZ genetic susceptibility [Citation15]. In addition, differentially expressed genes could have diverse patterns among brain regions [Citation17], neural cells [Citation18,Citation19] and neural developmental stages [Citation20]. Collectively, these findings suggest the influence of complex interplay of genetics and other factors (e.g. environmental factors) in determining the process of gene expression.
Epigenetics can mediate gene by environment effects in modifying how genes are structured and expressed. DNA methylation is an epigenetic modification widely studied in psychiatric disorders such as SZ [Citation21,Citation22]. It changes the genome’s response to transcriptional factors by attaching a methyl group in DNA sequence (mostly on cytosine site as CpG). The influence of DNA methylation in gene transcription can be stable and heritable across cell generations, and also reversible according to external condition changes [Citation23]. The dynamics of DNA methylation plays a vital role in the pathogenesis of SZ, especially in neuronal diversity, plasticity and neurogenesis [Citation24,Citation25]. Besides environmental and developmental effects, DNA methylation can also be influenced by sequence variants (e.g. genotype variation or specific allele on a locus), which represents a methylation quantitative trait loci (meQTL). Previous studies have demonstrated prevalent meQTL effects across genome, especially during the early neural development, and their relation to multiple psychiatric disorders including SZ [Citation26–28]. The study for common and tissue-specific meQTL effects across brain and peripheral tissues shows that cross-tissue meQTLs are more likely to reside at regulatory elements (e.g. enhancer) of transcriptional genes and also highly enriched in expression quantitative trait loci (eQTL) [Citation29], suggesting the role of DNA methylation in mediating genetic effects on gene expression.
Although DNA methylation plays a very important role in the control of gene expression by modulating both genetics and environmental factors, there are currently limited number of studies directly investigating the relationship between DNA methylation and gene expression in the human brain. By leveraging public datasets of methylation and gene expression from brain DLPFC tissues, we performed a comprehensive network analysis with an aim to characterize the relationship between them. Given the co-regulation among genes in expression and the clustering of methylation in functional pathways, we sought to identify the relationship between functional transcriptional modules and epigenetic modules in the context of the human interactome. We applied network analyses to construct expression and methylation networks and prioritize them into multiple sub-network modules, followed by a systematic characterization of both types of modules in terms of their associations with SZ and ageing, neuronal cell specification, CpG-expression co-localization and their underlying genetic effects. Using these analyses, we were able to link gene expression and methylation at the module level.
Materials and methods
Gene expression data
The data were downloaded from dbGaP (Accession: phs000979.v1.p1). Briefly, brain post-mortem tissues of DLPFC grey matter region (Brodmann area 46) from 546 subjects including SZ and healthy controls (HCs) were used for RNA extraction and gene expression assays. Further information about tissue dissection, clinical characterization, neuropathological screening, and toxicological analyses were described in [Citation30]. SZ patients were assessed for schizophrenia or schizoaffective disorder based on DSM-IV lifetime Axis I. HCs were included if they had no history of psychological or psychiatric problems and negative toxicology results.
Gene expression was assayed by an Illumina whole-genome HT-12-V4 expression chip covering 47,323 probes. The transcript level of each probe was passed through quality control steps by the ‘limma’ R package [Citation31], including correction for background level using negative control probes, quantile normalization using both negative and positive controls, and log2 transformation on the transcription intensities. Probes were removed if they were not significantly expressed (detection p-value > 0.01) in at least 90% subjects as applied in [Citation32]. Subjects were excluded if they had age information missing or were less than 16 years old, or poor RNA quality (RNA integrity number: RIN<6.5) or less than 10% of probes significantly expressed (quality detection p-value < 0.01). After these quality control steps, we had 20,370 probes from 419 subjects (241 HCs and 178 SZ) left for analyses. Batch effects were corrected for each probe using a parametric Bayes framework implemented in the ‘combat’ function [Citation33] in an R package surrogate variable analysis (SVA) [Citation34]. Confounding factors including pH, PMI (post-mortem interval) and RIN were further regressed out by a linear model prior to main analyses.
DNA methylation data
The data were from NCBI GEO database (GEO database: GSE74193). Briefly DNAs from DLPFC region (BA9/46) of 244 subjects (108 SZ and 136 HCs) with age greater than 16 years old were assayed using Illumina Infinium Methylation450k assay, covering 485,512 CpG sites. More details about the criteria for patients and controls recruitment and diagnosis can be seen in [Citation28].
DNA methylation data went through a series of quality control steps performed by R package ‘minfi’ [Citation35] as applied in [Citation28,Citation36]. After applying quantile-based normalization to both methylated and unmethylated signals on each site, we calculated the beta values for subsequent analysis. CpGs were removed if they 1) coincided with SNPs or at single-base extension [Citation37], 2) located in non-specific probes [Citation38], 3) contained more than 1% missing values (methylation values with detection p > 0.05 were treated as missing values), or 4) were located on sex chromosomes. The remaining missing beta values were further imputed by k-nearest neighbours (KNN) method as used in [Citation39]. 377,698 CpGs were kept after preprocessing. Further CpG removal was applied if CpGs standard deviation (SD) was less than the measurement error standard deviation (SD = 0.047) estimated by 78 test–retest samples, resulting in 61,853 CpGs for analyses. Batch effects were then corrected for each CpG using the same steps as with expression data. Neuronal cell-type proportions and the top four principal components of negative control methylation as estimated by [Citation28] were regressed out for subsequent analysis.
Network analysis
After preprocessing of both expression and methylation data, we constructed co-expression and co-methylation networks separately by using the R package weighted correlation network analysis (WGCNA) [Citation40]. WGCNA has been widely applied to omics data to construct correlation networks based on the correlations among the features (e.g. genes), cluster features for module detection, and summarize measurements of features from modules for traits association studies. We employed WGCNA to explore clusters (modules) of highly related genes or CpGs in relation to the traits and psychiatric diseases, and to investigate the correspondence among omics data at the module level. In brief, for each dataset the adjacency matrix was calculated by a power of 6 of the correlation matrix among nodes (i.e. expression probes and CpG) to have scale-free topology larger than 0.85, from which topology overlap matrix (TOM) was derived to measure connection similarity among nodes – the overlap between any two nodes in terms of the extent they were connected to the same other nodes in the network. Through the TOM matrix, an unsigned co-methylation/expression network was constructed and densely interconnected CpGs or expression probes were clustered into modules. Module eigengene (ME), the first principal component of methylation or expression matrix in a module, was computed and tested for the association with SZ diagnosis, controlling for age, race and sex. ME represents the expression profile of genes or CpGs in the module. Within a module, the correlation of each expression probe or CpG with ME was computed as the measure of their module membership (MM) [Citation41], indicating how close a CpG or probe relates to the module. Each CpG or probe’s association with SZ diagnosis was also computed as group significance (GS), from which the correlation between MM and GS on each CpG or probe in the module was tested. The top CpGs or probes with both high MM and GS values were utilized to represent the module for demonstration.
Overlap test between expression and methylation modules
After prioritizing probes or CpGs into different expression or methylation modules, respectively, we assigned them with ensemble IDs based on genome assembly GRCh38 using R package ‘BioMart’ [Citation42]. We only annotated a methylation site to a gene and ensemble ID if it was located within the gene or nearby the transcriptional start site (TSS) of the gene (distance < 5 k bps). For each pair of expression and methylation modules, we tested the significance of ensemble ID overlap by both two-sided Fisher’s 2 × 2 table exact test and permutation test. In Fisher’s exact test, given an expression module, we compared the odd of shared ensemble IDs with a methylation module to the odd of shared ensemble IDs with the other methylation modules and estimated the significance of ensemble ID overlap. To account for the cases that some methylation sites were not annotated to any genes and the number of methylation sites varied by modules, we applied a permutation method to reduce these influences in the test. For a tested expression module, the proportion of overlapped ensemble ID from a methylation module was taken as an observation. Then, we randomly sampled 105 sets of methylation sites with the same methylation module size from the whole methylation set. For each randomly selected methylation set, the proportion of shared ensemble ID included in the expression module was calculated to generate the null distribution. The percentage of sampled methylation sets having higher proportion than the observed proportion was taken as empirical p-value. The significance levels from both Fisher’s 2 × 2 table exact test and permutation test were used to determine the significance of overlap between expression and methylation modules.
Replication analyses
We used independent expression and methylation data sets to validate the findings from the discovery data in three aspects: module’s association with phenotypes, module’s preservation (explained later), and probe-level associations between expression and methylation from linked modules.
Expression replication dataset 1 (ExpRep1; GSE36192): post-mortem samples from frontal cortex of 455 neurologically normal Caucasian subjects were assayed by HumanHT-12_v3 Expression BeadChips (Citation48,803 probes). More details about expression profiling were described in [Citation43,Citation44]. After applying the same quality control and preprocessing (e.g., batch correction) as in the discovery data, there were 343 subjects (age > 16) with 18,196 probes left for replication.
Expression replication dataset 2 (ExpRep2; GSE21138): post-mortem tissues from DLPFC (brodmann area (BA) 46) of 30 SZ patients and 29 age- and sex-matched HCs [Citation45] assayed by Affymetrix Human Genome U133 Plus 2.0 Array (54,675 probes), followed by normalization using dChip statistical model (DNA-Chip Analyser) and log2 transformation as applied in [Citation45] and batch correction by R package SVA [Citation34]. Probes with present calls in at least one sample were left, resulting in 30,061 probes from 58 (30 SZ and 28 HCs) subjects for analysis. Probes were assigned by gene symbols and matched with those from discovery expression data at gene level for replication.
Methylation replication dataset1 (MethyRep1; GSE61380): 33 post-mortem brain DLPFC (BA9) samples (18 SZ and 15 HCs) were obtained from Douglas Bell-Canada brain bank with more information about participant recruitment and diagnosis criteria introduced in [Citation46]. DNA methylation was profiled using the Illumina Infinium HumanMethylation450K BeadChip and went through the same normalization, quality control, and imputation process as applied in discovery data to have 368,998 methylation sites remained for validation. Batch correction and neural cell type proportion estimations were also applied using the same algorithms as in discovery data analysis.
Methylation replication dataset 2 (MethyRep2; GSE36194): corresponding to expression replication dataset ExpRep1, methylation data from the same tissue of same subjects were profiled using with the Illumina Infinium HumanMethylation27K beadchip. The methylation data were preprocessed and quality controlled through the same steps as in discovery data analysis, resulting in 26,424 CpGs from 330 subjects for validation analysis.
Replication for disease association and age relatedness
For those modules with ME vectors significantly associated with diagnosis, we validated the associations in the independent datasets. For expression modules, we used ExpRep2 to select the probes from the same genes as the probes in the module and calculated the first eigengene of expression data to test their associations with disease and age. A similar validation was applied for each significant methylation modules in MethyRep1. Replication significance level was set as p < 0.05.
Replication for module preservation
Three different measures were applied to validate if the properties of selected modules were preserved across different datasets. First, a local clustering coefficient was to measure a normalized average number of all triangle connections associated with each node. In this study, we applied the generalized clustering coefficient (GCC) for weighted network to account for weight information in each edge [Citation47]. GCC reflected the presence of the module structure and mean prevalence of connectivity around the nodes. A permutation test was applied to test the significance of GCC in replication datasets. In each of 105 runs, we randomly selected features (expression probes or methylation sites) from the entire set and calculated GCC to build the null distribution. P-value can be derived by the proportion of runs with GCC larger than the observed GCC. Second, a composite preservation statistic was previously proposed to combine the measures of module density preservation (i.e. to test if the connections in the module remain in an independent dataset) and module connectivity preservation (i.e. to test if the connectivity pattern is similar to that in the independent dataset) and tested in [Citation16]. A permutation was performed to estimate the mean and variance of each measure (i.e. module density and module connectivity) under the null hypothesis that there was no preservation of module in the measures, followed by the standardization of each observed measure to the mean and variance under null distribution, denoted by Z_density and Z_connectivity, respectively. The composite preservation statistic, denoted by Z_summary, was defined as the average of Z_density and Z_connectivity. Z_summary < 2 indicates no preservation, 2 < Z_summary<10 indicates weak to moderate evidence of preservation, while Z_summary>10 indicates strong evidence [Citation16]. The p-value of the composite statistic was the combination of p values of module density and module connectivity.
Probe-level expression-methylation relation
To test the direct regulation relation between expression and methylation at probe level for the linked modules, we leveraged the data from ExpRep1 and MethyRep2 that were collected from same samples, and tested pair-wise associations of expression probes and methylation sites if they were located within 500 k bps, using linear regression controlling for age, sex and PMI.
Neural cell type and functional enrichment
To understand the cell specificity of each expression and methylation modules, we tested their enrichment in the genes expressed specifically in five cell types (neuron, astrocytes, microglia, endothelia cells, and oligodendrocytes using the R Package for specific expression analysis (pSI package) [Citation49] with Fisher’s exact test threshold as 0.05 and FDR as 0.05. The purified cell expression data from GSE73721 were used for the test [Citation50]. The overlap of our modules with those cell-specific modules identified in a recent transcriptional study for psychiatric disorders [Citation18] was also evaluated by Fisher’s exact test. In addition, methylation data of both neuron and glia cells from post-mortem prefrontal tissues of 29 control subjects (GSE41826 [Citation51]) were used to extract two sets of CpGs showing significant (p < 1 × 10⁻¹⁰) hyper-methylation in neuron (denoted by neuron-up’) and glia cells (denoted by glia-up”), respectively. These two sets of CpGs were then used to test the CpG overlap with identified methylation modules.
To understand the biological function of each module, we performed a gene ontology (GO) and KEGG enrichment analysis on the genes in the module using the web tool Webgestalt (http://www.webgestalt.org/option.php).
Psychiatric disorders GWAS risk loci enrichment
Public meQTL database (GSE74193) and eQTL databases (GTeX: https://gtexportal.org/home/; BrainSeq: http://eqtl.brainseq.org/phase1/devel) from brain DLPFC tissue were applied to access the genetic effects underlying expression and methylation networks. To test if the QTLs from target modules were significantly enriched in genetic risk loci of psychiatric disorders compared to the QTLs from the other modules, we adopted both Fisher’s exact test and permutation test as applied in [Citation29]. Specifically, we first applied linkage disequilibrium (LD) pruning to the whole QTL set with R-square R2 > 0.7. The pruning was supervised by PGC genome-wide association study (GWAS) risk loci using LD structure from 1000 genome project EUR group as reference. After pruning, the proportion of QTLs from the target module showing GWAS risk was treated as the observation. Then we generated a null distribution by randomly sampling 105 sets of QTLs from the pruned QTL set with the same number of QTLs and similar minor allele frequency distribution as those from the target module. Empirical p-value was computed as the percentage of sampled QTL sets having higher proportion than the observed proportion and denoted by P_perm. Fisher’s exact test was used to test the odds ratio of risk loci in target module QTLs and the QTLs from the other modules, denoted by P_Fisher.
The demographic information of subjects from all the datasets used in this study is listed in Table S1 in Supplementary file 1.
Results
Co-expression modules and their associations with SZ
We clustered expression probes into 22 modules using WGCNA software with the dendrogram plot as shown in . The eigengenes of each module were tested for association with multiple traits as shown in . Two modules coloured by magenta (including 276 probes; Supplementary file 2) and yellow (including 1098 probes; Supplementary file 2) were identified to have significant associations with SZ diagnosis (yellow: t-stat = 4.1, p = 2 × 10⁻³; magenta: t-stat = 3.55, p = 9.7 × 10⁻³) after controlling for covariates (i.e. age, race and sex) and correcting for multiple tests by false discovery rate (FDR). For each SZ related module, we tested the correlation between module membership and SZ group significance for all probes within the module, as shown in Fig.S1 A-B (Supplementary file 1). The correlation is significant in both modules with values of 0.53 and 0.28, respectively, showing that the probes with higher disease association tend to be more important in representing the module.
Figure 1. Co-expression analysis on brain DLPFC expression data. (a) shows the dendrogram clustering the correlated probes into several modules labelled with different colours; (b) lists the relationship between module eigengenes and traits. The numbers indicate -log10(FDR) and colours indicate the T-values. (c) shows the enrichment of module genes in seven reported modules which are specific to neural cells (i.e., neuron, endothelial, astrocyte,microglia and oligodendrocyte). (d) and (e) plot the network structure for the top 20 representative genes and their functional enrichment in gene ontology for magenta and yellow modules, respectively
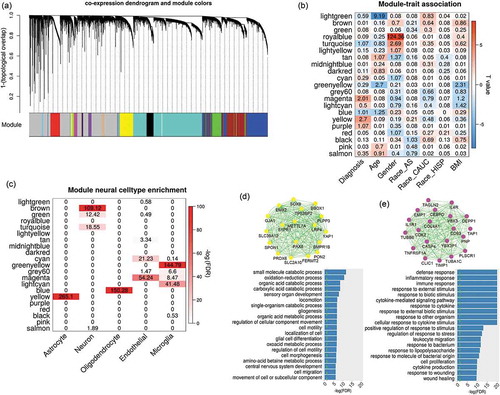
Independent validations were applied to verify both SZ-related modules in two expression datasets (ExpRep1 and ExpRep2). In ExpRep1 dataset, 90.8% of expression probes from the yellow module and 88.8% probes from the magenta module were identified. By permutation tests, we found that both modules were well preserved with significantly larger GCC than random selection of probes (p < 1 × 10⁻⁵, Fig.S3 A-B) and higher Z_summary statistics (yellow module: Z = 38; magenta module: Z = 18, Fig.S1 C). As recommended in [Citation16], the module is preserved if Z_summary >10. In ExpRep2 dataset, 72.6% genes from the yellow module and 73.3% genes from the magenta module were identified. The expressions of those probes from the matched genes were used to calculate the first eigengene for each module, and its association with SZ diagnosis was then examined. We replicated the associations between SZ diagnosis and yellow and magenta modules with the same direction as identified in the discovery dataset (yellow module: t-stat = 2.54, p = 0.014; magenta module: t-stat = 2.68, p = 9.6 × 10⁻³). In addition, both modules consistently showed significantly larger GCC in ExpRep2 data (p < 1 × 10⁻⁵, Fig. S3 C-D).
Several co-expression modules were significantly enriched in different neural cell types. As shown in , the yellow expression module contains the genes mostly expressed in astrocytes, while the blue module is more specifically expressed in oligodendrocytes. Gene ontology enrichment analysis identified that yellow module genes were significantly enriched in the pathways mainly involved the cell growth, migration, differentiation, movement, and organ development and morphogenesis, as shown in (p < 0.05 after FDR correction). Moreover, these genes were highly enriched in neurodevelopment pathways, such as gliogenesis, glial and astrocyte cell differentiation, and central nervous system development. As shown in , genes from the magenta module were mostly involved in the inflammatory response to external stimulus (e.g., cytokine and lipopolysaccharide), and specifically expressed in endothelial and microglia cells. Besides these modules, several others also contained genes significantly enriched in the cell-specific co-expression modules reported in a previous study [Citation18], as shown in Fig.S4.
Methylation modules and their associations with SZ
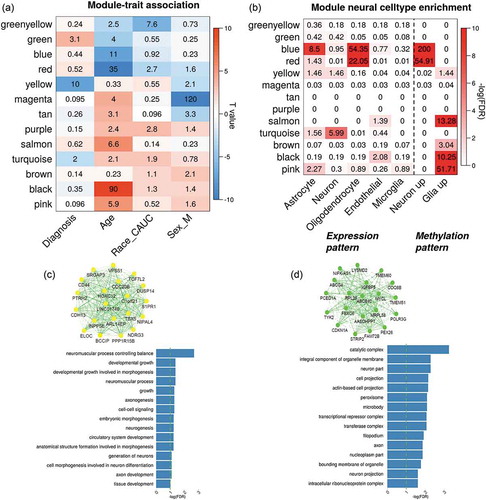
Using a similar network analysis, we identified 13 methylation modules and tested their eigen genes associations with multiple traits, and the results are displayed in . Three modules coloured by yellow (641 CpGs, t-stat = −7.22, p = 6.6 × 10⁻¹¹), green (475 CpGs, t-stat = 3.78, p = 7.5 × 10⁻⁴) and turquoise (15,983 CpGs, t-stat = −2.87, p = 0.01) showed significant associations with schizophrenia diagnosis (Supplementary file 3). In each of the three modules, CpGs tended to have more significant SZ vs. HC group differences if they demonstrated higher membership within the module (correlations were 0.91, 0.61, and 0.43, respectively, Fig.S2 A-C). ) show the network structure of the top 20 genes with high module membership in yellow and green methylation modules and the gene ontology (GO) enrichment of both module genes. The genes from the yellow module were significantly enriched in the functional pathways for developmental growth, axonogenesis, neurogenesis, and neuron generations, while the genes from the green module were related to cell projection. Although genes in the turquoise module were also enriched in some neural development pathways such as forebrain development and central nervous system neuron differentiation, this module had a large module size with less focus on specific functions. Thus, the turquoise module was not further analysed in this study. By matching the methylation nearby genes (<5kbp) with those expressed in specific cells, we observed that blue and red methylation modules were strongly enriched in the genes specifically expressed in the oligodentrocytes . Based on CpG patterns specific to neuron and glia cells, we identified that CpGs from the blue and red methylation modules were more likely hypo-methylated in glia cells compared to neurons in the human brain.
Figure 2. Network analysis on brain DLPFC methylation data. (a) shows the associations between module eigengenes and traits. The numbers indicate -log10(FDR) and colours indicate the T-values. (b) lists the enrichment tests of each methylation module in cell-specific expressed genes and CpG patterns; and (c-d) plot the network of top 20 representative genes and their functional enrichment in gene ontology for yellow and green module, respectively
Using the dataset MethyRep1, we matched 95.48% and 97.47% of CpGs identified in the aforementioned yellow and the green modules, respectively. The first eigengene of the yellow module (p = 0.28) did not show group differences, while the second eigengene showed significant group differences (t = −2.42, p = 0.02). The association between the green module and SZ diagnosis was replicated (t = 2.98, p = 7.1 × 10⁻³). Moreover, both yellow and green modules were well preserved in the replication dataset MethyRep1 with significantly higher GCC (p < 1 × 10⁻⁵, Fig.S3 E-F) and Z_summary statistics (yellow: Z = 13; green: Z = 21), as shown in Fig.S2 (D).
Overlap between expression and methylation modules
After annotating methylation sites and expression probes to their target gene ensemble IDs, we tested the overlap among the expression and methylation modules based on both Fisher’s test (i.e. FDR_Fisher) and permutation test (i.e. FDR_perm). As shown in Fig.S5 (Supplementary file 1), we identified three sets of significantly overlapped modules which can be grouped to two categories: SZ-related and age-related overlapping sets.
The SZ-related overlapping set included the yellow expression module and yellow methylation module (odds ration (OR) = 1.75, FDR_Fisher = 0.04, FDR_perm = 0.009). Both modules were significantly associated with SZ disease as shown in . There were 1109 expression probes (nearby 893 genes; Supplementary file 2) and 641 CpGs (nearby 591 genes; Supplementary file 3) from each module, respectively, with 5.2% probes located closely (<5kbp) to 9.5% CpGs, denoted by ‘overlap CpGs’ and ‘overlap probes’. As shown in Fig.S6 (Supplementary file 1), overlap probes and CpGs were mainly located nearby the genes enriched in GO terms of regulating nitrogen compound metabolic process, biosynthetic process and fatty acid oxidation (FDR p < 0.05; Fig.S6 A) and some interesting KEGG pathways such as Wnt signalling, Adipocytokine signalling, and Glutamatergic synapse(FDR p < 0.15; Fig.S6 B). By annotating each CpG to its nearest gene, we found that 17.9% (p = 1.3 × 10⁻³) of CpGs were located within 100kbp of transcription start site (TSS) of genes from the expression module, while 41.5% (p = 2.2 × 10⁻³) were within 500kbp, as shown in the density plot . Compared to those CpGs not included in the module, the overlap CpGs and the module CpGs (i.e., non-overlapped CpGs in the module) were significantly enriched in CpG islands (CGI) north shore (odds ratio: OR = 1.38 and 1.72), south shore (OR = 1.5 and 1.36), TSS200 regions (OR = 1.17 and 1.24), and 5ʹUTR (OR = 1.34 and 2.18) as shown in .
Figure 3. The characteristics of overlapping expression and methylation modules related to SZ and age. (a) and (d) show the histogram plots of the distance between each methylation site and the nearest transcription start site of the linked modules. (b) and (e) plot the distribution of three sets of CpGs (overlap CpGs, module CpGs and all CpGs) across the genome. (c) and (f) list the enrichment tests of cis-meQTL and cis-eQTL in risk loci of five psychiatric disorders (SZ: schizophrenia, MDD: major depressive disorders, BIP: bipolar disorder, ADHD: attention deficit hyperactivity disorder, ASD: autistic disorder) from PGC study
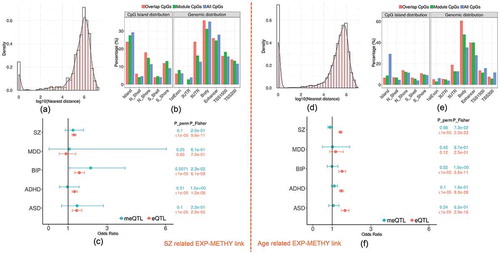
From previously reported eQTL and meQTL findings, we found that 32.8% of CpGs in the module (including 32% of overlap CpGs) were modified by cis-meQTLs, while 74% of expression probes (including 95.7% of overlap probes) were regulated by cis-eQTLs. 12.6% of the cis-meQTLs were also cis-eQTLs for the expression module. In particular, 36.3% of cis-meQTLs affecting overlap CpGs, were also cis-eQTLs. In addition, 13 out of total 205 protein-coding genes in the methylation module were located in 108 SZ risk regions [Citation52] as listed in Table S2. The eQTLs also showed significant enrichment in risk loci of SZ (OR = 1.31, p_perm <1 × 10⁻⁵; p_Fisher = 9.6 × 10⁻¹¹) and three other psychiatric disorders (Autism spectrum disorder (ASD), Attention-deficit/hyperactivity disorder (ADHD) and bipolar disorder (BIP)) as shown in . No significant enrichment was found for meQTLs in any psychiatric disorders.
Two age-related overlapping sets were found. One was between the blue expression module and the blue methylation module (OR = 2.39, FDR_Fisher = 1 × 10−39, FDR_perm <1 × 10⁻⁵), namely ‘blueExp-blueMethy’ link. The other was between the blue expression module and the red methylation module (OR = 5.79, FDR_Fisher = 1 × 10⁻³⁰, FDR_perm <1 × 10⁻⁵), namely ‘blueExp-redMethy’ link. The blue expression module has a negative association with age as shown in (partial R2 = 0.025, p = 9.6 × 10⁻³) and the association was replicated in ExpRep1 (89.6% probes included, p = 8.4 × 10⁻³) and ExpRep2 (61.2% genes included, p = 4 × 10⁻³). The blue and red methylation modules were also negatively significantly associated with age as shown in (blue: partial R2 = 0.19, p = 1.2x10⁻¹¹; red: partial R2 = 0.49, p = 2.5 × 10−36) and the age-methylation associations were also replicated (blue module: 96.6% CpGs included, p = 0.016; red module: 97% CpGs included, p = 2.3 × 10⁻⁶) in MethyRep1. GO term enrichment analysis showed that genes overlapped by blueExp-blueMethy modules were mainly enriched in functional pathways involving glial cell differentiation, gliogenesis, neurogenesis, axon ensheathment, and myelination (Fig.S7 A). Similar pathways were also significantly enriched by the overlapped genes from blueExp-redMethy linked modules, as shown in Fig.S7 (B).
In blueExp-blueMethy link, there are 2317 expression probes and 6308 CpGs with 20.9% CpGs located nearby 25.8% gene TSS <5kbps. plots the distance distribution between CpGs and their nearest expression probes in the linked modules, showing that 36.4% CpGs were located within 100kbps of gene TSS and 65.5% CpGs were located within 500 kbps. The overlap CpGs and module CpGs were mostly enriched in body of the gene and enhancer regions (OR = 1.77, p = 8.1 × 10−100 and OR = 1.85, p = 1.4 × 10−107, respectively) compared to all other CpGs, as shown in . In addition, 42.2% of CpGs from the module including 40.2% of overlap CpGs were significantly modified by cis-meQTLs, while 73.3% of expression probes including 94.9% of overlap probes were affected by cis-eQTLs. In particular, 46.2% of the cis-meQTLs are also cis-eQTLs for the expression module. shows the significance of eQTLs enriched in risk loci of SZ, BIP, ADHD and ASD but no significant enrichment was found for meQTLs in any psychiatric disorders risk loci.
In the red methylation module (440 CpGs) which was also overlapped with blue expression module as shown in Fig.S8, 41.3% CpGs located closed to 5.4% of the expression genes (<5kbps). 54.5% CpGs and 75.6% CpGs were located within 100kbps and 500kbps of TSS of genes from the expression module, respectively. CpGs from the red methylation module were significantly enriched in gene body (OR = 1.7, p = 1.5 × 10⁻⁷) and enhancer regions (OR = 2.8, p = 2.9 × 10⁻²⁷) compared to all other CpGs. 54.5% of CpGs including 48.5% of overlap CpGs were modified by meQTLs, while 94.6% of overlap probes were affected by eQTLs. 35.7% of meQTLs were also cis-eQTLs in regulating the gene expression of the module.
Using the independent ExpRep1 and MethyRep2 datasets assayed from the same subjects, we tested the associations between expression probes and their nearby (<500 kbps) CpGs from each of the above overlapping sets. There were only few expression-methylation pairs (1.2 ~ 8.9%) matched due to lower resolution in MethyRep2. After controlling for age, sex and PMI, 20%, 25% and 47.8% of matched pairs showed significant associations (FDR p < 0.05) in yellowExp-yellowMethy, blueExp-blueMethy and blueExp-redMethy links, respectively.
Discussion
We used large transcriptomics and epigenetics data from human brain frontal cortex to explore the relationship between co-expression and methylation modules by investigating their overlap in genes, associations with SZ and ageing, as well as their shared underlying genetic risk. Our findings were replicated by multiple independent datasets on module’s associations with SZ and age, and module’s preservation, and further verified by direct associations between individual CpGs and gene expression probes. We found two modules in each modality showing significant associations with SZ, and three pairs of overlapping methylation and expression modules related to SZ or ageing.
SZ-related modules and their expression-methylation relationship
Two co-expression modules were significantly associated with SZ with one (yellow module) including the genes more specifically expressed in astrocytes. This module is highly preserved across studies and also in line with the identified modules in previous RNA-sequencing studies of DLPFC tissue [Citation25, Citation27, Citation53, Citation69], consistently showing the up-regulation of module expression in SZ compared to HCs. In particular, the genes from the yellow module were also highly enriched in the module (CD4: astrocyte) reported in a recent study of transcription across five psychiatric disorders [Citation18], which demonstrated significant changes of the module expression in SZ, autism, and bipolar disorder. Astrocytes are known to be involved in synaptic metabolism and regulation of neurotransmitter release and reuptake (e.g., GABA and glutamate) and thereby critical for psychosis development [Citation54]. Our pathway analysis found significant enrichment of the module genes in some SZ-related KEGG metabolic pathways involving the metabolism on fatty acid [Citation55], glycine [Citation56], glutamate [Citation57] and tryptophan [Citation58], as shown in Fig.S9 (A) (Supplementary file 1). Compared to the yellow module, the magenta module expression was also up-regulated in SZ, but more specific to endothelial and microglia cells with genes mainly related to immune response. Endothelial cell is one of major component in formation of the brain-blood-barrier which has complex interaction with immune system in response to neuroinflammation [Citation59,Citation60]. Microglia also plays a critical role in neuroinflammatory pathways by involving in innate immune system in the central nervous system (CNS) [Citation61]. Previous studies have reported high involvement of immune system pathways in SZ development via glia cells as well as their interactions with neurons in neurotransmitters perturbations [Citation62,Citation63]. Therefore, the transcriptional changes of these immune system-related genes suggest the complex co-expression patterns in downstream modulation of neuroinflammation in SZ.
The yellow methylation module showed a significant association with SZ. Those methylation nearby genes included astrocyte highly-affinity glutamate transporters SLC1A2 and SLC1A3 [Citation64], and astrocyte-specific-expressed marker gene ALDH1L1 [Citation65]. As shown in Fig.S9 (B) and Table S3 (Supplementary file 1), the nearby genes were also marginally enriched in GABAergic synapse (GABRA1, GABRD, GNAO1, GNG7, PLCL1, PRKCA, CACNA1A) and serotonergic synapse (HTR1B, HTR2A, HTR3B, KCNJ3), which are crucial neurotransmitter pathways in pathogenesis of SZ [Citation66–68]. Significant down-regulation of DNA methylation in most of CpGs near these genes (partial R2 = 1.8%~16.1%; Supplementary file 1, Table.S2) in SZ, along with significant enrichment of module genes in growth development and neurogenesis, suggests the potential role of epigenetics in regulating glia cell function via these neurotransmitter signalling pathways. This is in agreement with previous findings of astrocyte epigenetic regulation in the pathophysiology of psychiatric disorders [Citation54,Citation69,Citation70]. In addition, the genes nearby CpGs in the module were more likely to be mapped to PGC SZ risk regions (p = 0.057) than the genes from the other methylation modules. SZ high-risk genes (Supplementary file 1, Table S2) from the module included RERE, MAD1L1, FURIN, and GATAD2A which have been reported to show significant methylation level alterations in SZ from previous DNA methylation genome-wide association studies [Citation71–72].
The significant overlap between the yellow expression and the yellow methylation modules was mainly from the genes involving some metabolic processes, biosynthetic process and fatty acid oxidation, which demonstrated the potential relationship with nervous system development in previous studies [Citation65,Citation73]. In particular, CpGs nearby genes SLC1A2, SLC1A3 and PRKCA from glutamate synapse showed hypo-methylation in SZ which may lead to up-regulated expressions of these genes in astrocyte of SZ, consistent with our results as shown in Table.S1 (Supplementary file 1). Significantly, a higher percentage of CpGs in the module were enriched in CGI shores which is known to be variable, compared to the CpGs from the other modules. In addition, cis-eQTLs were identified for a large proportion of genes and enriched for SZ and other three psychiatric disorders, while there was no significant enrichment of meQTLs in genetic risk of any psychiatric disorders. MeQTLs are of increasing interest for psychiatric epigenetic studies due to their significant enrichment for susceptible genetic risk loci of psychiatric disorders, especially functions at the early stage of neurodevelopment [Citation15,Citation26,Citation74,Citation75]. It has been reported that meQTLs are more likely to reside at regulatory elements and may associate with other factors (e.g. transcription factor binding and chromatin conformation) in regulating gene expression, RNA splicing, and further changes on cellular function and disease risk [Citation29,Citation76]. These psychiatric epigenetic studies suggest a potential path of genetic risk in regulating gene expression through DNA methylation. However, the non-significant enrichment of meQTLs for disease risk loci for the yellow module suggests a less likelihood of direct genetic risk influence on the methylation, but likely environmental modulation of methylation in astrocytes, and dysregulation of which is associated with SZ.
Ageing-related modules and their expression-methylation relationship
The module genes from blue expression module were highly enriched in the genes expressed in oligodendrocytes, which are the CNS cells involved in myelination [Citation77,Citation78]. GO enrichment test further validated that the functions of those module genes mainly involved oligodendrocytes differentiation, gliogenesis and development, ensheathment and myelination, which have been reported to be critical in maintenance of white matter integrity and structural connectivity in central nervous system [Citation79,Citation80]. We found down-regulation of module expression, especially of the oligodendrocyte OLIG2 gene (t = −2.56, p = 0.01) along with increase of age. OLIG2 can promote the formation of oligodendrocyte precursors and oligodendrocyte differentiation. Lower expression of OLIG2 may cause deficits in oligodendrocyte production and differentiation and thus affect the formation of myelin, which is potentially related to the decreased ability of remyelination in the ageing brain [Citation81]. Although marginal association with SZ was found in the first module eigengene, previous studies have shown the relationship between oligodendrocyte-associate gene expression in frontal cortex of SZ and myelination impairment and cognitive loss [Citation6,Citation82]. Given that several studies have shown the dramatic loss of structural connectivity and white matter integrity across the brain regions in SZ, it is promising to probe the role of oligodendrocytes-related expression module in the development of SZ. In addition, the module harboured 13% SZ risk genes and their cis-eQTLs were significantly enriched in most of psychiatric disorders risk loci, suggesting the potential pathology of genetic risk in SZ through the alteration of module gene expressions in oligodendrocytes.
Two methylation modules (blue and red) were significantly enriched in oligodendrocyte expressed genes and negatively associated with ageing, pointing out the role of epigenetics in ageing process by affecting oligodendrocyte development and differentiation. Previous work has reported the critical role of epigenetics in regulating gene expression in oligodendrocyte and thereby leading to inefficient of remyelination during ageing [Citation83]. In our data DNA methylation nearby myelin regulatory genes including MYRF, MBP, MAG, MOG, CNP [Citation84], critical in oligodendrocyte development and myelination of axons, demonstrated significant negative associations with age (partial R2 = 2%~18%; Supplementary file 1, Table S4) in the blue module. CpGs nearby genes MYRF, MBP and MAG also showed significant decreases (partial R2 = 9%~39%; Supplementary file Table S4) along with the increase of age in the red methylation module. Additional pathway analyses showed that those myelin-related genes together with many other genes in the modules were enriched for several functional pathways including central nervous development, neurogenesis, and glia cell differentiation, suggesting the potential of epigenetic regulations of these pathways in altering the oligodendrocyte differentiation and myelinations during ageing process [Citation85].
Functional pathways related to oligodendrocyte development and differentiation were shared by both expression and methylation modules, leading to significant overlap between the modules. There was a significant proportion of CpGs (20.9 ~ 41.3%) located nearby TSS of expression module genes (<5kbp), mostly enriched in gene body and enhancer regions, suggesting the regulation effect of those methylation module in expression modules [Citation29]. In particular, by the association tests on the methylation and gene expression from the same subjects, we identified 25 ~ 47.8% of matched expression-methylation pairs mainly showing significant negative associations (Supplementary file 1, Table S5), including some oligodendrocyte highly associated genes MYRF, MAG and SOX10. Enrichment tests on neural-specific methylation patterns showed that both methylation modules were enriched for hypo-methylation in glia cells compared to neurons, and thereby potentially contributed to their associated gene expression specificity in oligodendrocytes. These further evidence suggest epigenetic regulation on gene expression in oligodendrocytes to change myelination process. Genetics was also found to have large effects on both methylation and expression modules. A majority of module gene expressions were regulated by cis-eQTLs (74–95%) and a relative high proportion of CpGs (40.2 –54.5%) from both methylation modules were significantly regulated by cis-meQTLs. Especially, 35.7 ~ 46.2% meQTLs modifying overlap CpGs were also cis-eQTLs, indicating a pathology of genetic risks in regulating oligodendrocyte gene expression through epigenetics. This genetic, epigenetic and expression interplay is in line with our previous knowledge of both gene and environmental factors involved in the process of demyelination during ageing [Citation86].
In addition, we found significant enrichment of cis-eQTLs in most of psychiatric disorders’ risk loci, which suggests shared genetics between risk for psychiatric disorders and regulating ageing process, which alters gene expression of oligodendrocytes, and partially reflect the similar decreases of myelination in both ageing and SZ patients. Previous studies have investigated different biological ageing biomarkers (e.g., neuroimaging, epigenetics, and proteins) to estimate the biological age against chronological age and reported accelerated ageing process in psychiatric disorders, although how the ageing process interacts with psychiatric diseases is still unclear [Citation87–89]. A recent work on gene expression of post-mortem brain tissues estimated the ‘molecular age’ from the age-related genes and found older molecular brain ageing in severe mental illnesses including SZ and BIP [Citation90]. Genetic variants related to the molecular age deviation were also associated with SZ and major depressive disorder diagnostics, suggesting the pleiotropic genetic effect for the ageing process and the diseases [Citation91], which is in line with what we observed here.
To sum up, using a network analysis focused on DLPFC post-mortem tissues, we identified and replicated two expression and two methylation modules significantly associated with SZ. One pair of expression and methylation modules showed significant overlap in the genes which were specifically expressed in astrocyte and mainly involved in gliogenesis. Additional overlapped expression-methylation module pairs were also replicated in relation with ageing process with module genes mostly involved in oligodendrocyte development and myelination. Further examination of underlying QTLs showed the significant enrichment of eQTLs in most of psychiatric disorders’ risk loci, but not for meQTLs, suggesting combinatorial effects of genetics and epigenetics in regulating gene expression in glia cells of psychiatric disorders. This work as proof-of-concept demonstrates the existence of coherence between gene expression and DNA methylation at the network level, and provides support for the critical role of epigenetics in glial cell development and function during ageing process and psychosis development.
The findings of this study should be interpreted in consideration of several limitations. Firstly, the analysis was performed on the datasets from different studies of different cohorts. Tests on the associations between methylation and expression from the same cohorts are still waiting for more efforts in psychiatric genetics field. Although we tried to validate our findings in a study with both datasets, lower resolution of methylation array and missing of psychosis information limit our knowledge of the broad relationship between two features. Secondly, we have removed effects of some covariates (e.g. RNA quality, PMI, cell type and batch) prior network construction, but the modules may still be sensitive to the other factors (e.g. disease status and medication) and parameter settings in the method (e.g. block size and power index). Although we validated the preservation of identified modules in several independent datasets, more experiments are needed to evaluate the module robustness. Thirdly, genetic risk (eQTL and meQTL) were also discussed in the study, instead of computing eQTL from the data, we used the reports from public eQTL databases on RNAseq studies based on large sample size for eQTL detection. Although previous study has showed high overlap of RNAseq eQTLs with our microarray data [Citation14], the results may still subject to the power and platform for eQTL detection.
Authors’ contributions
DDL, VDC, and JYL designed and performed the computational analyses, analyzed the data, and interpreted the results. JYC, KKD and JS contributed the data collection and data analysis. NPB contributed with ideas and participated in evaluating results and discussions. DDL, VDC and JYL wrote the manuscript with input from all authors. All authors approved the final manuscript.
Ethics approval and consent to participate
Since all of datasets were from public database, this work subjected to ethic approval from each study.
Additional files
Additional File 1: Figure S1. The plots of module membership vs. group difference significance for the expression modules. Figure S2. The plots of module membership vs. group difference significance for the methylation modules. Figure S3. Permutation test of generalized clustering coefficient (GCC) for identified expression and methylation modules. Figure S4. Enrichment test of genes from all of expression and methylation modules. Figure S5. Overlap test between expression and methylation modules. Figure S6. Enrichment test of the overlap genes between yellow expression and yellow methylation modules in GO terms and KEGG pathways. Figure S7. The enrichment plot for the overlap genes in blueExp-blueMethy and blueExp-redMethy link, respectively. Figure S8. The characteristics of blue expression module and red methylation module. Figure S9. The KEGG pathway enrichment of genes from yellow expression module and yellow methylation module. Table S1. Demographic information of subjects from all datasets. Table S2. The list of PGC SZ risk genes from SZ-related yellow expression and yellow methylation modules. Table S3. SZ associations for CpGs(yellow methylation module) and expression probes(yellow expression module) involving neurotransmitter pathways. Table S4. The CpGs from oligodendrocyte expressed genes in blue and red modules and their associations with age. Table S5. Expression-methylation associations in blueExp-blueMethy and blueExp-redMethy links.
Supplementary File 2: Supplementary data file listing the genes from yellow expression module.
Supplementary File 3: Supplementary data file listing the CpGs from yellow methylation module.
Supplemental Material
Download Zip (2.3 MB)Acknowledgements
We would like to thank Dr. Andrew Jaffe from the Lieber Institute for Brain Development for sharing the meQTL results from brain tissue.
Disclosure statement
The authors declare that they have no competing interests.
Declarations Availability of data and materials
The datasets generated during the current study are available in the dbGAP repository (Accession: phs000979.v1.p1) and GEO database (GSE74193, GSE36192, GSE21138, GSE61380, GSE36194, GSE73721 and GSE41826).
Supplementary material
Supplemental data for this article can be accessed here.
Additional information
Funding
- Mathers C, Fat DM, Boerma JT. The global burden of disease: 2004 update. Geneva: World Health Organization; 2008.
- Sullivan PF, Kendler KS, Neale MC. Schizophrenia as a complex trait: evidence from a meta-analysis of twin studies. Arch Gen Psychiatry. 2003;60(12):1187–1192.
- Gupta CN, Calhoun VD, Rachakonda S, et al. Patterns of gray matter abnormalities in schizophrenia based on an international mega-analysis. Schizophr Bull. 2015;41(5):1133–1142.
- Romme IA, de Reus MA, Ophoff RA, et al. Connectome disconnectivity and cortical gene expression in patients with schizophrenia. Biol Psychiatry. 2017;81(6):495–502.
- Calhoun VD, Eichele T, Pearlson G. Functional brain networks in schizophrenia: a review. Front Hum Neurosci. 2009;3:17.
- Flynn SW, Lang DJ, Mackay AL, et al. Abnormalities of myelination in schizophrenia detected in vivo with MRI, and post-mortem with analysis of oligodendrocyte proteins. Mol Psychiatry. 2003;8(9):811–820.
- Kelly S, Jahanshad N, Zalesky A, et al. Widespread white matter microstructural differences in schizophrenia across 4322 individuals: results from the ENIGMA Schizophrenia DTI Working Group. Mol Psychiatry. 2018;23(5):1261–1269.
- Keefe RS, Harvey PD Cognitive impairment in schizophrenia. In: Novel antischizophrenia treatments. Berlin, Heidelberg: Springer; 2012. p. 11–37.
- Bale TL, Baram TZ, Brown AS, et al. Early life programming and neurodevelopmental disorders. Biol Psychiatry. 2010;68(4):314–319.
- Horvath S, Janka Z, Mirnics K. Analyzing schizophrenia by DNA microarrays. Biol Psychiatry. 2011;69(2):157–162.
- Dixon AL, Liang L, Moffatt MF, et al. A genome-wide association study of global gene expression. Nat Genet. 2007;39(10):1202.
- Stranger BE, Raj T. Genetics of human gene expression. Curr Opin Genet Dev. 2013;23(6):627–634.
- Ripke S, Neale BM, Corvin A, et al. Biological insights from 108 schizophrenia-associated genetic loci. Nature. 2014;511(7510):421.
- Jaffe AE, Straub RE, Shin JH, et al. Developmental and genetic regulation of the human cortex transcriptome illuminate schizophrenia pathogenesis. Nat Neurosci. 2018;21(8):1117–1125.
- Fromer M, Roussos P, Sieberts SK, et al. Gene expression elucidates functional impact of polygenic risk for schizophrenia. Nat Neurosci. 2016;19(11):1442–1453.
- Radulescu E, Jaffe AE, Straub RE, et al. Identification and prioritization of gene sets associated with schizophrenia risk by co-expression network analysis in human brain. Mol Psychiatry. 2020;25:791–804.
- Katsel P, Davis KL, Gorman JM, et al. Variations in differential gene expression patterns across multiple brain regions in schizophrenia. Schizophr Res. 2005;77(2–3):241–252.
- Gandal MJ, Haney JR, Parikshak NN, et al. Shared molecular neuropathology across major psychiatric disorders parallels polygenic overlap. Science. 2018;359(6376):693–697.
- Torkamani A, Dean B, Schork NJ, et al. Coexpression network analysis of neural tissue reveals perturbations in developmental processes in schizophrenia. Genome Res. 2010;20(4):403–412.
- Nowakowski TJ, Bhaduri A, Pollen AA, et al. Spatiotemporal gene expression trajectories reveal developmental hierarchies of the human cortex. Science. 2017;358(6368):1318–1323.
- Aberg KA, McClay JL, Nerella S, et al. Methylome-wide association study of schizophrenia: identifying blood biomarker signatures of environmental insults. JAMA Psychiatry. 2014;71(3):255–264.
- Vogel Ciernia A, LaSalle J. The landscape of DNA methylation amid a perfect storm of autism aetiologies. Nat Rev Neurosci. 2016;17(7):411–423.
- Ramchandani S, Bhattacharya SK, Cervoni N, et al. DNA methylation is a reversible biological signal. Proc Nat Acad Sci. 1999;96(11):6107–6112.
- Yao B, Christian KM, He C, et al. Epigenetic mechanisms in neurogenesis. Nat Rev Neurosci. 2016;17(9):537–549.
- Delgado-Morales R, Agis-Balboa RC, Esteller M, et al. Epigenetic mechanisms during ageing and neurogenesis as novel therapeutic avenues in human brain disorders. Clin Epigenetics. 2017;9:67.
- Jaffe AE, Gao Y, Deep-Soboslay A, et al. Mapping DNA methylation across development, genotype and schizophrenia in the human frontal cortex. Nat Neurosci. 2016;19(1):40–47.
- Hannon E, Spiers H, Viana J, et al. Methylation QTLs in the developing brain and their enrichment in schizophrenia risk loci. Nat Neurosci. 2016;19(1):48.
- Andrews SV, Ellis SE, Bakulski KM, et al. Cross-tissue integration of genetic and epigenetic data offers insight into autism spectrum disorder. Nat Commun. 2017;8(1):1011.
- Lin D, Chen J, Perrone-Bizzozero N, et al. Characterization of cross-tissue genetic-epigenetic effects and their patterns in schizophrenia. Genome Med. 2018;10(1):13.
- Lipska BK, Deep-Soboslay A, Weickert CS, et al. Critical factors in gene expression in postmortem human brain: focus on studies in schizophrenia. Biol Psychiatry. 2006;60(6):650–658.
- Ritchie ME, Phipson B, Wu D, et al. limma powers differential expression analyses for RNA-sequencing and microarray studies. Nucleic Acids Res. 2015;43(7):e47.
- Hemani G, Shakhbazov K, Westra HJ, et al. Detection and replication of epistasis influencing transcription in humans. Nature. 2014;508(7495):249–253.
- Johnson WE, Li C, Rabinovic A. Adjusting batch effects in microarray expression data using empirical Bayes methods. Biostatistics. 2007;8(1):118–127.
- Leek JT, Johnson WE, Parker HS, et al. The sva package for removing batch effects and other unwanted variation in high-throughput experiments. Bioinformatics. 2012;28(6):882–883.
- Aryee MJ, Jaffe AE, Corrada-Bravo H, et al. Minfi: a flexible and comprehensive Bioconductor package for the analysis of Infinium DNA methylation microarrays. Bioinformatics. 2014;30(10):1363–1369.
- Lin D, Chen J, Ehrlich S, et al. Cross-Tissue exploration of genetic and epigenetic effects on brain gray matter in schizophrenia. Schizophr Bull. 2018;44:443–452.
- Chen YA, Lemire M, Choufani S, et al. Discovery of cross-reactive probes and polymorphic CpGs in the Illumina Infinium HumanMethylation450 microarray. Epigenetics. 2013;8(2):203–209.
- Naeem H, Wong NC, Chatterton Z, et al. Reducing the risk of false discovery enabling identification of biologically significant genome-wide methylation status using the HumanMethylation450 array. BMC Genomics. 2014;15(1):51.
- Rahmani E, Yedidim R, Shenhav L, et al. GLINT: a user-friendly toolset for the analysis of high-throughput DNA-methylation array data. Bioinformatics. 2017;33(12):1870–1872.
- Langfelder P, Horvath S. WGCNA: an R package for weighted correlation network analysis. BMC Bioinformatics. 2008;9(1):559.
- Willer CJ, Li Y, Abecasis GR. METAL: fast and efficient meta-analysis of genomewide association scans. Bioinformatics. 2010;26(17):2190–2191.
- Durinck S, Spellman PT, Birney E, et al. Mapping identifiers for the integration of genomic datasets with the R/Bioconductor package biomaRt. Nat Protoc. 2009;4(8):1184–1191.
- Hernandez DG, Nalls MA, Moore M, et al. Integration of GWAS SNPs and tissue specific expression profiling reveal discrete eQTLs for human traits in blood and brain. Neurobiol Dis. 2012;47(1):20–28.
- Gibbs JR, van der Brug MP, Hernandez DG, et al. Abundant quantitative trait loci exist for DNA methylation and gene expression in human brain. PLoS Genet. 2010;6(5):e1000952.
- Narayan S, Tang B, Head SR, et al. Molecular profiles of schizophrenia in the CNS at different stages of illness. Brain Res. 2008;1239:235–248.
- McGirr A, Tousignant M, Routhier D, et al. Risk factors for completed suicide in schizophrenia and other chronic psychotic disorders: a case-control study. Schizophr Res. 2006;84(1):132–143.
- Onnela JP, Saramaki J, Kertesz J, et al. Intensity and coherence of motifs in weighted complex networks. Phys Rev E Stat Nonlin Soft Matter Phys. 2005;71(6 Pt 2):065103.
- Langfelder P, Luo R, Oldham MC, et al. Is my network module preserved and reproducible? PLoS Comput Biol. 2011;7(1):e1001057.
- Dougherty JD, Schmidt EF, Nakajima M, et al. Analytical approaches to RNA profiling data for the identification of genes enriched in specific cells. Nucleic Acids Res. 2010;38(13):4218–4230.
- Zhang Y, Sloan SA, Clarke LE, et al. Purification and characterization of progenitor and mature human astrocytes reveals transcriptional and functional differences with mouse. Neuron. 2016;89(1):37–53.
- Guintivano J, Aryee MJ, Kaminsky ZA. A cell epigenotype specific model for the correction of brain cellular heterogeneity bias and its application to age, brain region and major depression. Epigenetics. 2013;8(3):290–302.
- Ripke S, Sanders AR, Kendler KS, et al. Genome-wide association study identifies five new schizophrenia loci. Nat Genet. 2011;43(10):969.
- Radulescu E, Jaffe AE, Straub RE, et al. Identification and prioritization of gene sets associated with schizophrenia risk by co-expression network analysis in human brain. bioRxiv, 2018
- Bernstein H-G, Steiner J, Guest PC, et al. Glial cells as key players in schizophrenia pathology: recent insights and concepts of therapy. Schizophr Res. 2015;161(1):4–18.
- Solberg D, Bentsen H, Refsum H, et al. Association between serum lipids and membrane fatty acids and clinical characteristics in patients with schizophrenia. Acta Psychiatr Scand. 2015;132(4):293–300.
- Sumiyoshi T, Anil AE, Jin D, et al. Plasma glycine and serine levels in schizophrenia compared to normal controls and major depression: relation to negative symptoms. Int J Neuropsychopharmacol. 2004;7(1):1–8.
- Marsman A, van den Heuvel MP, Klomp DW, et al. Glutamate in schizophrenia: a focused review and meta-analysis of 1H-MRS studies. Schizophr Bull. 2011;39(1):120–129.
- Chiappelli J, Postolache TT, Kochunov P, et al. Tryptophan metabolism and white matter integrity in schizophrenia. Neuropsychopharmacology. 2016;41(10):2587.
- Erickson MA, Dohi K, Banks WA. Neuroinflammation: a common pathway in CNS diseases as mediated at the blood-brain barrier. Neuroimmunomodulation. 2012;19(2):121–130.
- Weksler B, Subileau E, Perriere N, et al. Blood-brain barrier-specific properties of a human adult brain endothelial cell line. Faseb J. 2005;19(13):1872–1874.
- Streit WJ, Mrak RE, Griffin WST. Microglia and neuroinflammation: a pathological perspective. J Neuroinflammation. 2004;1(1):14.
- Khandaker GM, Cousins L, Deakin J, et al. Inflammation and immunity in schizophrenia: implications for pathophysiology and treatment. Lancet Psychiatry. 2015;2(3):258–270.
- Monji A, Kato TA, Mizoguchi Y, et al. Neuroinflammation in schizophrenia especially focused on the role of microglia. Prog Neuro Psychopharmacol Biol Psychiatry. 2013;42:115–121.
- Choudary PV, Molnar M, Evans SJ, et al. Altered cortical glutamatergic and GABAergic signal transmission with glial involvement in depression. Proc Natl Acad Sci U S A. 2005;102(43):15653–15658.
- Cahoy JD, Emery B, Kaushal A, et al. A transcriptome database for astrocytes, neurons, and oligodendrocytes: a new resource for understanding brain development and function. J Neurosci. 2008;28(1):264–278.
- Blum BP, Mann JJ. The GABAergic system in schizophrenia. Int J Neuropsychopharmacol. 2002;5(2):159–179.
- Ruzicka WB, Subburaju S, Benes FM. Circuit- and diagnosis-specific DNA methylation changes at gamma-aminobutyric acid-related genes in postmortem human hippocampus in schizophrenia and bipolar disorder. JAMA Psychiatry. 2015;72(6):541–551.
- Aghajanian GK, Marek GJ. Serotonin model of schizophrenia: emerging role of glutamate mechanisms. Brain Res Brain Res Rev. 2000;31(2–3):302–312.
- Rajkowska G, Stockmeier CA. Astrocyte pathology in major depressive disorder: insights from human postmortem brain tissue. Curr Drug Targets. 2013;14(11):1225–1236.
- Nagy C, Suderman M, Yang J, et al. Astrocytic abnormalities and global DNA methylation patterns in depression and suicide. Mol Psychiatry. 2015;20(3):320–328.
- Hannon E, Dempster E, Viana J, et al. An integrated genetic-epigenetic analysis of schizophrenia: evidence for co-localization of genetic associations and differential DNA methylation. Genome Biol. 2016;17(1):176.
- Montano C, Taub MA, Jaffe A, et al. Association of DNA methylation differences with schizophrenia in an epigenome-wide association study. JAMA Psychiatry. 2016;73(5):506–514.
- Maekawa M, Watanabe A, Iwayama Y, et al. Polyunsaturated fatty acid deficiency during neurodevelopment in mice models the prodromal state of schizophrenia through epigenetic changes in nuclear receptor genes. Transl Psychiatry. 2017;7(9):e1229.
- Gamazon E, Badner J, Cheng L, et al. Enrichment of cis-regulatory gene expression SNPs and methylation quantitative trait loci among bipolar disorder susceptibility variants. Mol Psychiatry. 2013;18(3):340–346.
- Numata S, Ye T, Herman M, et al. DNA methylation changes in the postmortem dorsolateral prefrontal cortex of patients with schizophrenia. Front Genet. 2014;5:280.
- Banovich NE, Lan X, McVicker G, et al. Methylation QTLs are associated with coordinated changes in transcription factor binding, histone modifications, and gene expression levels. PLoS Genet. 2014;10(9):e1004663.
- Gibson EM, Purger D, Mount CW, et al. Neuronal activity promotes oligodendrogenesis and adaptive myelination in the mammalian brain. Science. 2014;344(6183):1252304.
- Fields RD. Oligodendrocytes changing the rules: action potentials in glia and oligodendrocytes controlling action potentials. Neuroscientist. 2008;14(6):540–543.
- Hagmann P, Sporns O, Madan N, et al. White matter maturation reshapes structural connectivity in the late developing human brain. Proc Natl Acad Sci U S A. 2010;107(44):19067–19072.
- Simons M, Nave K-A. Oligodendrocytes: myelination and axonal support. Cold Spring Harb Perspect Biol. 2016;8(1):a020479.
- Sim FJ, Zhao C, Penderis J, et al. The age-related decrease in CNS remyelination efficiency is attributable to an impairment of both oligodendrocyte progenitor recruitment and differentiation. J Neurosci. 2002;22(7):2451–2459.
- Hakak Y, Walker JR, Li C, et al. Genome-wide expression analysis reveals dysregulation of myelination-related genes in chronic schizophrenia. Proc Natl Acad Sci U S A. 2001;98(8):4746–4751.
- Shen S, Sandoval J, Swiss VA, et al. Age-dependent epigenetic control of differentiation inhibitors is critical for remyelination efficiency. Nat Neurosci. 2008;11(9):1024.
- Emery B, Agalliu D, Cahoy JD, et al. Myelin gene regulatory factor is a critical transcriptional regulator required for CNS myelination. Cell. 2009;138(1):172–185.
- Liu J, Moyon S, Hernandez M, et al. Epigenetic control of oligodendrocyte development: adding new players to old keepers. Curr Opin Neurobiol. 2016;39:133–138.
- Copray S, Huynh JL, Sher F, et al. Epigenetic mechanisms facilitating oligodendrocyte development, maturation, and aging. Glia. 2009;57(15):1579–1587.
- Cole JH, Marioni RE, Harris SE, et al. Brain age and other bodily ‘ages’: implications for neuropsychiatry. Mol Psychiatry. 2019;24(2):266–281.
- Higgins-Chen AT, Boks MP, Vinkers CH, et al. Schizophrenia and epigenetic aging biomarkers: increased mortality, reduced cancer risk, and unique clozapine effects. Biological Psychiatry. 2020;88(3):224–235.
- Schnack HG, Van Haren NE, Nieuwenhuis M, et al. Accelerated brain aging in schizophrenia: a longitudinal pattern recognition study. Am J Psychiatry. 2016;173(6):607–616.
- Lin CW, Chang LC, Ma T, et al. Older molecular brain age in severe mental illness. Mol Psychiatry. 2020. DOI:10.1038/s41380-020-0834-1
- Kaufmann T, van der Meer D, Doan NT, et al. Common brain disorders are associated with heritable patterns of apparent aging of the brain. Nat Neurosci. 2019;22(10):1617–1623.