
 ?Mathematical formulae have been encoded as MathML and are displayed in this HTML version using MathJax in order to improve their display. Uncheck the box to turn MathJax off. This feature requires Javascript. Click on a formula to zoom.
ABSTRACT
Accurate diagnosis of the origin of brain metastases (BMs) is crucial for tailoring an effective therapy to improve patients’ prognosis. BMs of unknown origin account for approximately 2–14% of patients with BMs. Hence, the aim of this study was to identify the original cancer type of BMs based on their DNA methylation profiles. The DNA methylation profiles of glioma (GM), BM, and seven other types of primary cancers were collected. In comparison with GM, the reversal CpG site pairs were identified for each of the seven other types of primary cancers based on the within-sample relative methylation orderings (RMOs) of the CpG sites. Then, using the reversal CpG site pairs, GMs were distinguished from BMs and the seven other types of primary cancers. All 61 of the GM samples were correctly identified as GM. The cancer type was also identified for the non-GM samples. For the seven other types of primary cancers, greater than 93% of samples of each cancer type were correctly identified as their corresponding cancer type, except for breast cancer, which had an 88% accuracy. For 133 BM samples, 132 BM samples were identified as non-GM, and 95% of the 133 BM samples were correctly classified into their corresponding original cancer types. The RMO-based method can accurately identify the origin of BMs, which is important for precision treatment.
Introduction
A brain metastasis (BM) caused by a systemic malignant tumour is a frequent neoplasm encountered in the central nervous system. Approximately 10% of patients with cancer have BMs, and 67–80% of BMs primarily originate from lung cancer, breast cancer, and melanoma [Citation1,Citation2]. The survival outcomes of BMs that originate from different types of cancer vary greatly, and BMs that originate from breast cancer have the longest median overall survival times (8–15 months) [Citation3,Citation4]. This is followed by BMs that originate from lung cancer (7 months) [Citation4,Citation5] and melanoma (5–7 months) [Citation4,Citation6].
Currently, the common approaches for treating BMs are surgery, stereotactic radiosurgery, whole brain radiation therapy, chemotherapy, targeted therapy, and immunotherapy [Citation7]. The optimal therapy for a patient closely relates to its original cancer type [Citation8,Citation9]. Generally, it is important to first distinguish a primary brain lesion from a metastatic brain lesion. Then, the morphological features and an immunohistochemical analysis are used to identify the origin of BMs [Citation10,Citation11]. Since a morphological analysis of BMs with undifferentiation or a lesser degree of differentiation always triggers an error diagnosis of the BM origins [Citation10], an immunohistochemistry test is required to improve the correct diagnosis rate of BMs. Given the limited sensitivity and specificity of the available immunohistochemistry, as well as the subjectivity of the interpretation of staining results, metastatic specimens whose original cancer types have been correctly diagnosed only account for approximately 66% of metastatic specimens in immunohistochemistry tests [Citation12]. Moreover, despite the full clinical diagnoses, approximately 2–14% of BMs with unknown origin still remain [Citation2]. Therefore, a robust method is necessary to aid in the accurate identification of the origin of BMs.
DNA methylation can characterize different types of cancers [Citation13,Citation14], and methylation-based classifiers have been developed for brain tumour precision diagnoses. These include central nervous system tumour classification [Citation15,Citation16] and the identification of the origin of metastatic samples [Citation17,Citation18,Citation19,Citation20]. The current methylation-based classifier was developed using a supervised method [Citation15,Citation17,Citation18,Citation20] or an unsupervised method [Citation21,Citation22]. In the supervised method, random forest has been commonly used for the identification of the origin of BMs. For example, the diagnostic tool EPICUP was developed using random forest, and it was able to predict the origin of 87% of 216 samples [Citation17]. Euskirchen et al. also combined Nanopore whole genome sequencing with random forest to diagnose brain tumours [Citation20]. However, samples with low DNA quality and low tumour purity were not classifiable using Nanopore sequencing, and the performance of EPICUP for the type of samples was not evaluated. At the transcriptome level, the within-sample relative expression orderings (REOs) of gene pairs have been reported to be robust, even with tumour tissues that had relatively low proportions of tumour epithelial cells [Citation23,Citation24] and partial RNA degradation during specimen preparation and storage [Citation25]. Thus, the REO-based method has been widely used to identify diagnosis and prognosis markers for different types of cancers [Citation26,Citation27,Citation28]. For DNA methylation, the within-sample relative methylation orderings (RMOs) of CpG site pairs have also been used to identify markers for tumour diagnosis [Citation29]. Hence, in this study, an investigation was conducted to explore whether the RMOs of CpG sites could be used to identify the origin of metastasis tumours, even in samples with low tumour purity.
Due to a similar epigenetic status between metastatic samples and their original cancer types [Citation30,Citation31], it can be hypothesized that the methylation states of metastatic specimens should be more similar to their corresponding origins. Here, based on the RMOs of CpG sites generated from eight types of primary tumours, GMs are distinguished from the other types of primary cancers and BMs, and the original cancer type of the BMs are identified.
Results
Distinguishing GMs from BMs and the other seven cancer types
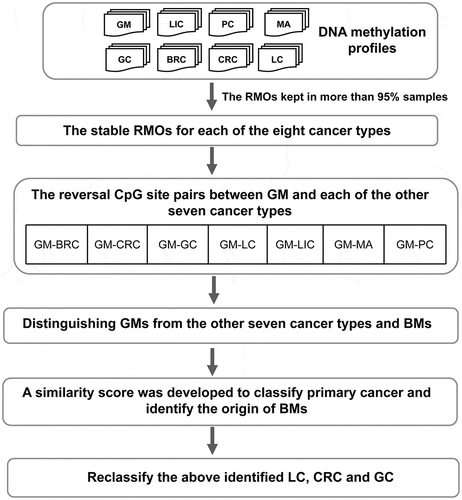
The workflow of this study is shown in . The DNA methylation profiles of eight types of primary cancers were collected, including glioma (GM), liver cancer (LIC), gastric cancer (GC), colorectal cancer (CRC), breast cancer (BRC), lung cancer (LC), prostate cancer (PC), and melanoma (MA). Using samples from the training data, the reversal CpG site pairs between GM and each of the other seven cancer types were identified. The results showed that 77,138 GM-LIC, 24,750 GM-GC, 212,002 GM-CRC, 25,040 GM-BRC, 14,033 GM-LC, 160,392 GM-PC, and 5,142 GM-MA reversal CpG site pairs were identified (Supplementary Tables 1–2). Based on each of the seven lists of reversal CpG site pairs, GMs were distinguished from BMs and the other cancer types using the simple majority rule (see Methods). Using the GM-LIC reversal CpG site pairs, all 61 of the primary GM samples were correctly classified into GM, and all 127 of the primary LIC samples were correctly classified into LIC. Similarly, based on the reversal CpG site pairs between GM and each of the other six cancer types, all 51 of the GC samples, 54 CRC samples, 138 BRC samples, 99 LC samples, 52 PC samples, and 49 MA samples were correctly classified into their corresponding cancer types (). Here, a sample was identified as GM when this sample was classified as GM in all seven of the reversal CpG site pairs. Otherwise, it was classified as non-GM (Supplementary Figure 1). In summary, 100% of the 61 primary GM samples were correctly classified into GM in each of the seven lists of reversal CpG site pairs, and the samples from the non-GM cancer types were correctly classified into non-GM. These results suggested that the reversal CpG site pairs showed good performance for distinguishing primary brain cancer samples from the other cancer types.
Table 1. The performance of the reversal CpG site pairs in each of the independent datasets
Figure 1. The workflow for identifying the origin of BMs. First, the stable RMOs of the CpG site pairs were identified for each of the eight cancer types. Compared with GM, reversal CpG site pairs were further selected for each of the seven other cancer types. Then, based on the reversal CpG site pairs of the other seven cancer types, GMs could be distinguished from BMs and the other seven cancer types. For non-GM samples, similarity scores were used to classify each type of the primary cancer samples and to identify the tissue origins of the BMs. Due to the relatively low specificity of LC using only the above similarity scores, the above identified LCs were reclassified. Because GC and CRC tend to be confused, the above identified GC and CRC were further reclassified based on the reversal CpG site pairs between GC and CRC using a simple majority vote rule
The BM samples were also analysed in a similar manner. These included 53 melanoma brain metastases (MBMs), 18 lung cancer brain metastases (LCBMs), and 62 breast cancer brain metastases (BRCBMs). Based on the GM-MA reversal CpG site pairs, all 53 of the MBM samples were correctly classified into MA. Based on the GM-LC reversal CpG site pairs, all 18 of the LCBM samples were correctly classified into LC. Based on the GM-BRC reversal CpG site pairs, 61 of the 62 BRCBM samples (i.e., 98.39%) were correctly classified into BRC, and only one BRCBM sample was classified into GM. These results demonstrated that the reversal CpG site pairs could precisely distinguish BM samples from GM samples.
The performance of the RMO-based algorithm in identifying primary cancer types and the origin of BMs
After identifying a tumour sample as non-GM, the tissue origin of the tumour sample was determined. Based on the seven lists of reversal CpG site pairs, the similarity scores were calculated for each of the non-GM samples in the training data. The results showed that a majority of the seven cancer types could be correctly classified into their corresponding cancer types, but the specificity of LC was relatively low, and CRC was easily misclassified into GC (Supplementary Figure 2a). To solve this problem, the above identified LC samples were reclassified by identifying the reversal CpG site pairs between LC and the other six cancer types (BRC, LIC, GC, CRC, PC, and MA). In addition, the similarity scores were calculated using the six lists of reversal CpG site pairs. If a sample was classified into LC in all six of the reversal CpG site pairs, the sample was identified as LC. Otherwise, it was classified as non-LC (Supplementary Figure 1). For a non-LC sample, the cancer type with the highest similarity score was its corresponding cancer type. Next, the reversal CpG site pairs between CRC and GC were further identified to distinguish CRC from GC. After this optimization, the accuracy of each cancer type was improved, especially for CRC (Supplementary Figure 2a).
Then, the RMO-based algorithm was used to classify the samples of primary cancer types in validation data. The results showed that the accuracies of the other six cancer types was greater than 93%, except for BRC with 88% ()). In comparison with random forest, this algorithm had a higher accuracy for most types of primary cancer. Using t-distributed stochastic neighbour embedding (t-SNE) [Citation32] and uniform manifold approximation and projection (UMAP) [Citation33], most of the samples within a cancer type were also preferentially clustered together () and Supplementary Figure 2b).
Figure 2. The performance of the RMO-based algorithm in classifying primary cancer and identifying the origin of BMs. (a) The accuracies of the RMO-based algorithm and random forest for each of the eight primary cancer types and BMs. The figures in brackets represent the total number of samples for each type of cancer. (b) Overview of the t-SNE plot for all of the samples used in this study. The samples annotated in this plot were those with inconsistent cancer types classified using the RMO-based method and the cancer type provided by the data source. (c) The classification result of the inconsistent samples using the RMO-based method, random forest and t-SNE. (d) The Kaplan-Meier curves of the OS among the BRCBM, LCBM, and MABM samples
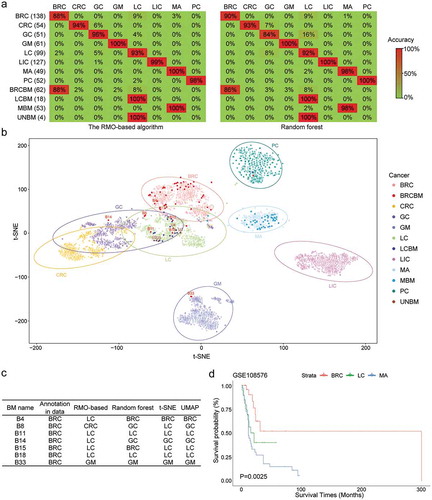
The RMO-based algorithm was also used to identify the tissue origin of the BM samples. For the 53 MBM samples, 100% of the 53 MBM samples were identified as MBM using the RMO-based algorithm and the accuracy was 98% for random forest () and Supplementary Table 3), and similar results were also obtained using t-SNE and UMAP () and Supplementary Figure 2b). For the 18 LCBM samples, the tissue origin of all of the samples was identified as LC using both the RMO-based algorithm and random forest ()). For the 62 BRCBM samples, 88.71% and 85.50% of the 62 BRCBM samples were identified as BRCBM using the RMO-based algorithm and random forest, respectively ()). For the seven samples identified as non-BRCBM using the RMO-based algorithm, two samples were classified as LCBM using the RMO-based algorithm, random forest, t-SNE, and UMAP ()), and one sample was classified as GM using the RMO-based algorithm, random forest, t-SNE, and UMAP () and Supplementary Figure 2b). Moreover, the four BM samples with unknown origin (UNBM) in GSE108576 were identified as LCBM using the RMO-based algorithm, random forest, t-SNE, and UMAP ( and Supplementary Figure 2b). In addition, using samples from GSE108576 with survival information, it was found that the overall survival time was significantly different among the identified 37 MBM, 21 LCBM, and 27 BRCBM samples (P < 0.05, )). In addition, the samples that originated from BRC had better survival outcomes, which agreed with previous reports [Citation3,Citation4,Citation5,Citation6].
Discussion
In this study, the RMO-based method exactly distinguished GMs from the other seven cancer types and BMs. Moreover, using this RMO-based algorithm, each of the seven cancer types were correctly classified, and the origin of the BM samples was precisely identified.
The reversal CpG site pairs between GM and each of the other seven cancer types precisely distinguished GM from non-GM. Specially, some reversal CpG site pairs more specifically occurred in some specific cancer types. For example, CpG site cg06022562 related reversal CpG site pairs specifically occurred in reversal CpG site pairs between GM and BRC (Supplementary Table 4), which was located in the promoter of ZNF750. It has been reported that ZNF750 regulates cell migration and invasion of BRC by influencing histone markers of pro-metastatic genes [Citation34]. The results of this study suggested that DNA methylation of the ZNF750 promoter may also be a factor involved in its function in BRC. Here, using only reversal CpG site pairs between GM and BRC, some primary BRC and BRCBM samples were misidentified as LC and LCBM, respectively. This result agreed with previous reports [Citation35,Citation36]. A principal component analysis conducted on breast cancer and lung cancer found that the two types of cancer were located in close proximity to one another, or even partially overlapped [Citation35]. Julian et al. also noted that lung cancers resistant to targeted therapies could benefit from a class of agents used to treat certain breast cancers [Citation36]. Therefore, further studies are required to explore the mechanism involved in the molecular similarities between breast cancer and lung cancer, as well as potential agents that can be used in both lung and breast cancer treatments.
By using DNA methylation profiles, most of the samples in this study were classified into their corresponding cancer types annotated in the data source by using the RMO-based algorithm, supervised random forest, unsupervised t-SNE, or UMAP. In contrast, the copy number variations showed worse performances than DNA methylation regarding the use of random forest, t-SNE, or UMAP (Supplementary Figure 3). The copy number profiles were extracted from the methylation profiles measured by the Illumina Infinium HumanMethylation450 BeadChip (450 K) or the Illumina Infinium HumanMethylation850 BeadChip (850 K) platforms using the R package conumee [Citation37] (Supplementary Table 5). In addition, the samples with low tumour cell contents (< 50%) were further analysed (Supplementary Table 6). It was found that five of the six LIC samples (i.e., 83%) were correctly identified as LIC, and for the other seven cancer types, greater than 96% of the samples of each cancer type could be correctly classified into their corresponding cancer type (Supplementary Figure 4). By using random forest, the accuracy of each cancer type was greater than 96%, except for GC. This result showed that this RMO-based algorithm and random forest could be robust even for samples with a low tumour cell content. However, combining Nanopore whole-genome sequencing with random forest resulted in a quick and convenient method to diagnose brain tumours, but it could not classify samples with low tumour purities [Citation20]. EPICUP is also a diagnostic tool that was developed using random forest, but it was offline [Citation17]. Therefore, this developed method provides an external complement for the current diagnostic methods.
In summary, this study demonstrated that the RMO-based method could accurately classify primary cancer and identify the origin of BMs, which is important for clinicians to tailor more accurate and effective therapies for BM patients.
Materials and methods
Data and preprocessing
As shown in , except for the 32 BMs that originated from breast cancer (Breast-BM) downloaded from Figshare.com [Citation38], the DNA methylation profiles of nine types of cancer, namely, BM, LIC, GC, CRC, GM, BRC, LC, PC, and MA, were collected from the Gene Expression Omnibus repository (GEO, https://www.ncbi.nlm.nih.gov/geo/) and The Cancer Genome Atlas (TCGA, https://portal.gdc.cancer.gov/). A total of 543 LIC, 468 GC, 384 CRC, 517 GM, 614 BRC, 562 LC, 487 PC, 263 MA, 53 MBM, 18 LCBM, 62 BRCBM, and 4 BM samples with unknown origin were employed in this study.
Table 2. The datasets used in this study
All of the collected methylation profiles were measured using the Illumina Infinium HumanMethylation27 BeadChip (27 K), 450 K, or 850 K. For each probe, its beta value was calculated using M/(U + M + 100), where M and U represent its methylated signal intensity and unmethylated signal intensity, respectively. The beta value of each probe was used as the measure of its methylation level. To ensure the quality of the data, the methylation level of a probe would be set as a missing value in a sample if the probe had a detection p value≥ 0.05 in this sample. For each dataset, the probes with missing values in the above 20% of all of the samples were excluded from the following analysis. The remaining missing values were estimated using the R-package ‘impute’ [Citation39]. Here, the 24,677 CpG sites simultaneously measured by 27 K, 450 K, and 850 K platforms were focused on. Among them, the 881 probes located in sex chromosomes were discarded.
Identification of reversal CpG site pairs between GM and each of the other seven cancers
For any two CpG sites (Ci and Cj) in a sample, if the methylation level of the CpG site Ci was higher (lower) than the CpG site Cj, the RMO of the two CpG sites was defined as Ci>Cj (Ci<Cj) in this sample. Herein, if the RMO of two CpG sites, Ci>Cj (or Ci<Cj), was observed in greater than 95% of the GM samples, and its reverse, Ci<Cj (or Ci>Cj), was observed in greater than 95% of another particular type of cancer samples, it was defined as a reversal CpG site pair between the two types of cancer samples. Then, using samples in the training datasets, the reversal CpG site pairs between GM and LIC, GC, CRC, BRC, LC, PC, and MA were identified and separately denoted as GM-LIC, GM-GC, GM-CRC, GM-BRC, GM-LC, GM-PC, and GM-MA CpG site pairs. Similarly, the reversal CpG site pairs between LC and LIC, GC, CRC, BRC, PC, and MA were also identified and were denoted as LC-LIC, LC-GC, LC-CRC, LC-BRC, LC-PC, and LC-MA CpG site pairs. Because only one reversal CpG site pair was identified between LC and BRC with the threshold 95%, we lowered the threshold to 90% to select the reversal CpG site pairs between LC and each of the six cancer types.
Distinguished GMs from non-GMs
Based on the above reversal CpG site pairs between GM and each of the other seven cancer types, a simple majority rule was used to classify the eight types of primary tumour samples and the BMs. For example, the CpG site pairs of GM-MA were used to classify a given sample into GM or MA. In the given sample, if more than half of the GM-MA CpG site pairs had the same RMOs with that in GM, the sample was classified into GM. Otherwise, it was classified as MA. For a GM sample, it was classified as GM when this sample was classified as GM in all seven of the reversal CpG site pairs. Otherwise, it was classified as non-GM.
The similarity scores
In this study, a similarity score was defined to quantify the consistency between a non-GM sample with unknown origin and each of the seven non-GM cancer types. For example, the similarity of a BM sample and MA were estimated in the study by calculating the similarity score as follows:
where V is the number of GM-MA CpG site pairs; and U is the number of CpG site pairs that had the same RMOs between this BM sample and MA among the GM-MA CpG site pairs. Similarly, the similarity scores of this BM sample and each of the other six cancer types were calculated in this manner. The cancer type with the highest similarity score was considered as the origin of the BM sample.
Random forest, t-SNE, and UMAP
The top 2000 most variable CpG sites of the training group were selected according to the variance of each CpG site, and these were used to build the random forest classifier that was implemented in the R package randomForest [Citation40]. For the random forest classifier, the parameter ntree was set as 2000. Similarly, the top 2000 most variable CpG sites of all of the samples in both training and validation groups were also selected for the plot of t-SNE and UMAP. The t-SNE and UMAP were implemented in the R packages Rtsne [Citation32] and umap [Citation33], respectively. For the t-SNE, the perplexity and theta were set as 25 and 0, respectively, and the max iter was reset to 10000. The default parameters were used for UMAP. For copy number profiles, the top 2000 most variable bins were selected using samples in the training group to implement random forest. For the plots of t-SNE and UMAP, the top 2000 most variable bins were selected by using samples in the training and validation groups.
Statistical analysis
The overall survival was defined as the time from the first diagnosis of the BMs to the patient death or the last follow-up (censored). The Kaplan-Meier survival curve analysis and log-rank test were used to assess the difference in survival among the different groups of cancer samples. All of the analysis programs in this study were written using R language (R 4.0.2), and the program codes are available on the web at https://github.com/LiuH2020/RMO-based-algorithm.
Supplemental Material
Download MS Excel (1.1 MB)Supplemental Material
Download MS Word (1.8 MB)Acknowledgments
We thank the researchers that deposited their data in open repositories. We also thank LetPub (http://www.letpub.com) for its linguistic assistance during the preparation of this manuscript.
Disclosure statement
No potential conflict of interest was reported by the authors.
Supplementary material
Supplemental data for this article can be accessed here
Additional information
Funding
References
- Barnholtz-Sloan JS, Sloan AE, Davis FG, et al. Incidence proportions of brain metastases in patients diagnosed (1973 to 2001) in the metropolitan detroit cancer surveillance system. J Clin Oncol. 2004;22(14):2865–2872. .
- Nayak L, Lee EQ, Wen PY. Epidemiology of brain metastases. Curr Oncol Rep. 2012;14(1):48–54.
- Rostami R, Mittal S, Rostami P, et al. Brain metastasis in breast cancer: a comprehensive literature review. J Neurooncol. 2016;127(3):407–414. .
- Berghoff AS, Schur S, Fureder LM, et al. Descriptive statistical analysis of a real life cohort of 2419 patients with brain metastases of solid cancers. ESMO Open. 2016;1(2):e000024. .
- Ali A, Goffin JR, Arnold A, et al. Survival of patients with non-small-cell lung cancer after a diagnosis of brain metastases. Curr Oncol. 2013;20(4):e300–306. .
- Spagnolo F, Picasso V, Lambertini M, et al. Survival of patients with metastatic melanoma and brain metastases in the era of MAP-kinase inhibitors and immunologic checkpoint blockade antibodies: A systematic review. Cancer Treat Rev. 2016;45:38–45.
- Lin X, DeAngelis LM. Treatment of Brain Metastases. J Clin Oncol. 2015;33(30):3475–3484.
- Hardesty DA, Nakaji P. The Current and Future Treatment of Brain Metastases. Front Surg. 2016;3:30.
- Ahluwalia MS, Vogelbaum MV, Chao ST, et al. Brain metastasis and treatment. F1000Prime Rep. 2014;6:114.
- Pekmezci M, Perry A. Neuropathology of brain metastases. Surg Neurol Int. 2013;4(5):S245–255.
- Bekaert L, Emery E, Levallet G, et al. Histopathologic diagnosis of brain metastases: current trends in management and future considerations. Brain Tumor Pathol. 2017;34:8–19.
- Anderson GG, Weiss LM. Determining tissue of origin for metastatic cancers: meta-analysis and literature review of immunohistochemistry performance. Appl Immunohistochem Mol Morphol. 2010;18(1):3–8.
- Hao X, Luo H, Krawczyk M, et al. DNA methylation markers for diagnosis and prognosis of common cancers. Proc Natl Acad Sci U S A. 2017;114(28):7414–7419.
- Ding W, Chen G, Shi T. Integrative analysis identifies potential DNA methylation biomarkers for pan-cancer diagnosis and prognosis. Epigenetics. 2019;14(1):67–80.
- Capper D, Jones DTW, Sill M, et al. DNA methylation-based classification of central nervous system tumours. Nature. 2018;555:469–474.
- Karimi S, Zuccato JA, Mamatjan Y, et al. The central nervous system tumor methylation classifier changes neuro-oncology practice for challenging brain tumor diagnoses and directly impacts patient care. Clin Epigenetics. 2019;11:185.
- Moran S, Martinez-Cardus A, Sayols S, et al. Epigenetic profiling to classify cancer of unknown primary: a multicentre, retrospective analysis. Lancet Oncol. 2016;17(10):1386–1395. .
- Jurmeister P, Bockmayr M, Seegerer P, et al. Machine learning analysis of DNA methylation profiles distinguishes primary lung squamous cell carcinomas from head and neck metastases. Sci Transl Med. 2019;11(509):eaaw8513.
- Barciszewska AM. Global DNA demethylation as an epigenetic marker of human brain metastases. Biosci Rep. 2018;38(5):BSR20180731.
- Euskirchen P, Bielle F, Labreche K, et al. Same-day genomic and epigenomic diagnosis of brain tumors using real-time nanopore sequencing. Acta Neuropathol. 2017;134(5):691–703. .
- Baettig F, Vlajnic T, Vetter M, et al. Nivolumab in chemotherapy-resistant cervical cancer: report of a vulvitis as a novel immune-related adverse event and molecular analysis of a persistent complete response. J Immunother Cancer 2019; 7:281.
- Haefliger S, Tzankov A, Frank S, et al. NUT midline carcinomas and their differentials by a single molecular profiling method: a new promising diagnostic strategy illustrated by a case report. Virchows Arch. 2020.
- Cheng J, Guo Y, Gao Q, et al. Circumvent the uncertainty in the applications of transcriptional signatures to tumor tissues sampled from different tumor sites. Oncotarget. 2017;8(18):30265–30275. .
- Guan Q, Zeng Q, Yan H, et al. A qualitative transcriptional signature for the early diagnosis of colorectal cancer. Cancer Sci. 2019;110:3225–3234.
- Chen R, Guan Q, Cheng J, et al. Robust transcriptional tumor signatures applicable to both formalin-fixed paraffin-embedded and fresh-frozen samples. Oncotarget. 2017;8(4):6652–6662. .
- Xu L, Tan AC, Winslow RL, et al. Merging microarray data from separate breast cancer studies provides a robust prognostic test. BMC Bioinformatics. 2008;9(1):125. .
- Guan Q, Yan H, Chen Y, et al. Quantitative or qualitative transcriptional diagnostic signatures? A case study for colorectal cancer. BMC Genomics. 2018;19(1):99. .
- Ao L, Song X, Li X, et al. An individualized prognostic signature and multiomics distinction for early stage hepatocellular carcinoma patients with surgical resection. Oncotarget. 2016;7:24097–24110.
- Li H, Hong G, Xu H, et al. Application of the rank-based method to DNA methylation for cancer diagnosis. Gene. 2015;555(2):203–207. .
- Udali S, De Santis D, Ruzzenente A, et al. DNA methylation and hydroxymethylation in primary colon cancer and synchronous hepatic metastasis. Front Genet. 2017;8:229.
- Ju HX, An B, Okamoto Y, et al. Distinct profiles of epigenetic evolution between colorectal cancers with and without metastasis. Am J Pathol. 2011;178:1835–1846.
- Maaten LVD, Hinton G. Visualizing data using t-SNE. J Mach Learn Res. 2008;9:2579–2605.
- McInnes L, Healy J, Melville J. Umap: uniform manifold approximation and projection for dimension reduction. arXiv Preprint. 2018;arXiv:180203426.
- Cassandri M, Butera A, Amelio I, et al. ZNF750 represses breast cancer invasion via epigenetic control of prometastatic genes. Oncogene. 2020;39:4331–4343.
- Orozco JIJ, Knijnenburg TA, Manughian-Peter AO, et al. Epigenetic profiling for the molecular classification of metastatic brain tumors. Nat Commun. 2018;9:4627.
- Murillo MM, Rana S, Spencer-Dene B, et al. Disruption of the interaction of RAS with PI 3-kinase induces regression of EGFR-mutant-driven lung cancer. Cell Rep. 2018;25(13):3545–3553 e3542. .
- Feber A, Guilhamon P, Lechner M, et al. Using high-density DNA methylation arrays to profile copy number alterations. Genome Biol. 2014;15(2):R30. .
- Salhia B, Kiefer J, Ross JT, et al. Integrated genomic and epigenomic analysis of breast cancer brain metastasis. PLoS One. 2014;9:e85448.
- Troyanskaya O, Cantor M, Sherlock G, et al. Missing value estimation methods for DNA microarrays. Bioinformatics. 2001;17(6):520–525. .
- Liaw A, Wiener M. Classification and regression by randomForest. R News. 2002;2:18–22.