
ABSTRACT
Currently, the most commonly used biomarker of alcohol consumption patterns is carbohydrate-deficient transferrin (CDT). However, the CDT has limited sensitivity and requires the use of blood. Recently, we have shown that digital DNA methylation techniques can both sensitively and specifically detect heavy alcohol consumption (HAC) using DNA from blood or saliva. In order to better understand the relative performance characteristics of these two tests, we compared an Alcohol T-Score (ATS) derived from our prior study and serum CDT levels in 313 (182 controls and 131 HAC cases) subjects discordant for HAC. Overall, the Receiver Operating Characteristic (ROC) area under the curve (AUC) analyses showed that DNA methylation predicted HAC status better than CDT with AUCs of 0.96 and 0.87, respectively (p < 0.0001). The performance of the CDT was affected by gender while the ATS was not, while both were affected by age. We conclude that DNA methylation is a promising method for quantifying HAC and that further studies to better refine its strengths and limitations are in order.
Introduction
The excessive consumption of alcohol is a substantial problem. Across the globe, the average adult ingests approximately 6.4 litres of pure alcohol annually. The per capita consumption varies regionally with the highest consumption being observed in Europe, where the average adult ingests nearly 10 litres of pure alcohol annually and the lowest being in the Middle East and Northern Africa, where whereas the average is less than a litre annually [Citation1].
In the United States, the average per capita consumption is 8 litres per person annually [Citation1]. If taken at a steady rate by all Americans, this consumption would roughly fall within the 1–2 drinks per day limit associated with healthy living [Citation2,Citation3]. Unfortunately, the pattern of alcohol distribution is markedly skewed. In 2018, only 70% of Americans reported that they have drank in the past year with 26% of Americans reported that they binge drank (defined as ingesting to the point of intoxication) in the past month with 7% of Americans reporting binging 5 or more times in a single month in the past year [Citation4].
This latter repeated pattern of binge drinking five or more times per month is referred to as heavy alcohol consumption (HAC), by the National Institutes on Alcohol Abuse and Alcoholism and is one of the most prominent forms of alcoholism [Citation4]. Alcoholism, and particularly HAC, is a major socioeconomic problem throughout the world contributes to the onset and severity of over 200 medical illnesses [Citation1]. In the U.S., nearly 1/3 of all automobile deaths in 2014 were attributable to alcoholism with the total impact of treatment, lost productivity and other costs reaching 250 USD billion in 2014. Therefore, not surprisingly, detecting HAC is of great interest to a broad spectrum of professionals including clinicians, researchers, policymakers, and actuaries.
Over the past three decades, a number of different methods for assessing HAC have been used including algorithms that incorporate levels of liver enzymes (i.e. alanine aminotransferase (ALT), γ-glutamyl transferase (GGT) and aspartate aminotransferase (AST)), carbohydrate-deficient transferrin (CDT), Phosphatidylethanolamine (PEth), or metabolites such as ethyl glucuronide (EtG) [Citation5,Citation6]. Although each of these methods has its advantages, the CDT has emerged as the insurance industry’s choice for detecting HAC, mainly because of its high specificity [Citation7].
However, the CDT also has clear limitations. Although the CDT has excellent specificity, its sensitivity is not particularly high with various sources citing levels of sensitivity ranging from 40% to 84% [Citation8–11]. Second, its performance is affected by genetic variation. In the largest analysis of this phenomenon, Caslavska and colleagues examine 7290 serum samples from a European repository and found that 2.3% of the subjects had genetic variation in CDT that affected results [Citation12]. The prevalence of CDT variants in non-European populations appears to be much higher. In a population of 797 Han Chinese subjects, 4.1% had variants that interfered with interpretation [Citation13]. Although the exact percentage of total variants is not well defined, Piazza and colleagues report that 10% of African Americans carry the most common CDT variant, the D allele [Citation14]. A third limitation is that the most reliable methods of CDT determination require sophisticated chromatography and mass spectroscopy equipment. As a result, in the United States, only a handful of large reference labs run the test.
A fourth barrier is that the CDT requires obtaining blood-either from a finger stick or venipuncture. In contrast, methylation-based tests can also use DNA prepared from much more easily obtained saliva samples which eliminate the potential for discomfort and the need for specially trained personnel for collecting the samples.
Conceivably, DNA methylation approaches could address some, if not all, of the shortcomings of the CDT. Building on genome-wide DNA methylation analyses on the effects of alcohol consumption by ourselves and others [Citation15–17], we have constructed a panel of four reference-free methylation sensitive digital PCR (MSdPCR) assays, referred to as Alcohol Signature™, for predicting alcohol consumption. A significant challenge to the clinical implementation of methylation-based technologies is the relatively high cost of methylation arrays, the length of laboratory time (3 to 5 days) needed to perform the array hybridizations, and the extensive bioanalytic pipeline needed to process the data. Perhaps more odiously, because the way, the data are normalized, the results for any locus are reference dependent [Citation18]. In layman’s terms, this means that the outcome for one locus is dependent not only on the results at other loci for the same subject but on the results for samples run simultaneously. In contrast, in contrast to both arrays and quantitative PCR, which compares the rate of reaction in one PCR reaction to that of a reference standard, dPCR is completely reference free [Citation19]. Barring poor assay design, the only thing that affects the outcome is the ratio of methylated to unmethylated cytosines in the sample being examined.
In a recent study, we test the ability of the Alcohol Signature dPCR panel to predict HAC status in a cohort of 212 self-reported abstinent controls and 143 subjects admitted for alcohol treatment [Citation20]. Overall, the Alcohol Signature dPCR panel predicted HAC status with an AUC of 0.95 with no effects of gender or ethnicity detected. However, we did not compare the results methylation-based approach to that of a more generally accepted laboratory method for assessing HAC.
In this report, we address this shortcoming and extend our prior analyses by comparing the predictive power of that panel to that of the CDT in a subset of those subjects.
Methods
The biomaterial (e.g. sera) and clinical data included in these analyses were taken from a previously described case and control analysis of HAC whose conduct was approved by the Western Institutional Review Board (www.wirb.com) [Citation20].
In the original study, the HAC subjects were ascertained from one of three local inpatient chemical dependency treatment providers. Each of these facilities offers detoxification services followed by an optional four-week inpatient alcohol treatment programme. Adults who were admitted to one of these facilities in the context of acute intoxication and capable of giving consent after detoxifying were eligible for the study. After written informed consent for the study was obtained, each participant was interviewed with an abbreviated Semi Structured Assessment for Genetic Studies (Version II) and the Substance Use Questionnaire [Citation15,Citation21]. Afterwards, the subjects underwent venous phlebotomy to provide biomaterial for the study.
Control participants for this case and control analysis were recruited from the University of Iowa community. For these subjects, any adult who denied any use of alcohol or illegal substances, including cannabis, in the past year and denied a history of past substance abuse, except for tobacco use disorder, qualified for potential enrolment. After consent was obtained, these subjects were interviewed with the same instruments as the controls and then phlebotomized to provide biomaterials for the study. A total of 210 participants enrolled in the control arm of the study successfully provided clinical and biomaterial for the study. The data from nine subjects (six males and three females) were excluded for having serum cotinine values inconsistent with stated use status. One other subject was excluded for reporting cannabis use during the interview. The data for 18 other subjects were excluded for having one or more missing methylation values at one of the four loci examined in this study.
After phlebotomy, blood was processed into serum and then frozen at −80°C until use in the current study as described previously [Citation17]. For this study, vials of serum were removed from the −80°C freezer and allow to thaw under close supervision. After a short vortexing to mix the sample, 250 µl aliquots of serum from each participant were placed in a coded tube and CDT blindly determined with respect to subject status by using capillary electrophoresis [Citation22]. The results were quantified as the percentage of total transferrin levels.
The methylation values for each of the four loci (cg02583484, cg04987734, cg09935388, and cg04583842) predictive of alcohol were determined previously using proprietary primer-probe sets from Behavioral Diagnostics (www.bdmethylation.com, Coralville, IA) and both digital PCR reagents and a QX-200 Droplet Digital PCR system (Bio-Rad, Hercules, CA)[Citation20]. Their values were transformed to a single ‘Alcohol Methylation T-Score’ (ATS) by calculating a T-score (TS) for each locus, then averaging the result using the data from all 343 subjects who participated in that study. To do this, we first subtracted the mean of the 200 control subjects from the observed methylation value for each subject at each locus, then dividing the result by the standard deviation of the controls at that locus. Please note that methylation at cg04987734 and cg04583842 increases in response to alcohol consumption while methylation at cg02583484 and cg09935388 decreases as a function of alcohol consumption. We then combined the four T-scores using the following formula ((TScg04987734 + TScg04583842 − TScg02583484 − TS cg09935388)/4) to create the ATS.
Nicotine and cannabis consumption use status were determined using enzyme-linked immunoassay procedures as previously described using cotinine and cannabinoid kits from AbNova (Taiwan) and serum sample prepared from each subject [Citation17].
The primary analyses were conducted using logistic regression where the outcome was HAC status (i.e., case/control) and each model was adjusted for age and gender. The relationship between CDT and methylation (ATS) with HAC status was investigated, first individually and then together in a combined model. The relative strength of the model was assessed using the area under the curve (AUC) and Akaike’s Information Criterion (AIC) [Citation23–25]. Comparison of the strengths of models was conducted as per the method of DeLong and associates as implemented in the R package by Xavier and colleagues [Citation26,Citation27]. Internal validation of the logistic regression models was accomplished through a bootstrap aggregation method using 200 samples [Citation28]. The model was refit in each training sample and applied to separate test samples to obtain aggregated estimates of the AUC values. All analyses were conducted using R Version 3.5.14.0.2.
Results
The clinical and demographic characteristics of the 313 subjects with methylation data from the 2019 study for whom we were able to determine CDT levels. Overall, since we were able to determine CDT levels for 313 of the 343 subjects in the original study, the characteristics of this subset largely mimics that of the 2019 study. In brief, the HAC subjects are most often male (71%) and white with an average age of 41.9. They reported drinking heavily in the months prior to admission with the typical subject reporting consuming 15 to 16 drinks per day. In contrast, the control subjects are most often female (57%), but generally white with an average age of 43.9. In keeping with the criteria for enrolment, they all denied alcohol consumption in the prior 6 months. Six of the controls reported smoking and had serum cotinine values consistent with their self-report (≥2 ng/ml). In contrast, 114 (87%) and 40 (31%) of the HAC subjects were positive for cotinine and cannabinoids, respectively.
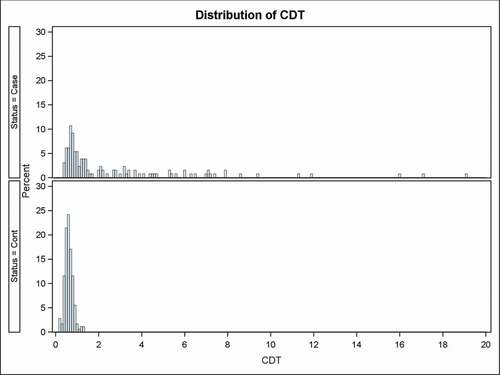
illustrates the distribution of the CDT as a function of HAC status. The distribution of the control subject values is unimodal with slight skewing with a mean value very close to the 0.62% average methylation level. Consistent with prior reports of the excellent specificity of the CDT, the highest level observed for controls was 1.3% with none of the subjects being beyond the 1.4% cut off for predicting alcohol. In contrast, the CDT for the case subjects averages 2.66% with 53 of the 131 (40.5%) HAC subjects having a CDT beyond the 1.4% cut off and 5 subjects (3.8%) having CDT levels greater than 10%.
Figure 1. The distribution of carbohydrate-deficient transferrin (CDT, expressed as %) levels for HAC cases and controls
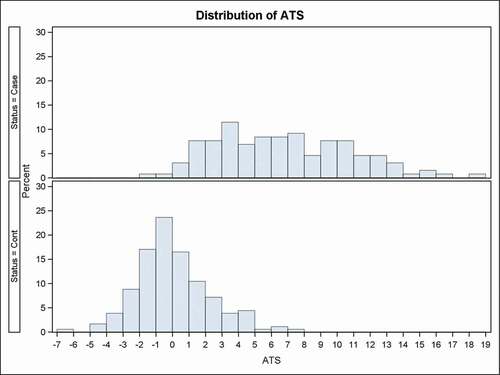
The distribution of the Alcohol Methylation T-Score (ATS) is shown in . As expected for a metric for a population normalized on itself, the distribution of the 182 control subjects displayed a roughly normal unimodal distribution whose mean and median are approximately zero. The 90th percentile of the distribution is 3.1 and the 95th percentile is 4.1. In contrast, the distribution of ATS in the case subjects is much broader and skewed to the right. The mean and modal ATS values are 6.7 and 6.5, respectively. Overall, 29 and 41 ATS scores from the HAC subjects fall below the 90th and 95th percentile of the control distribution.
Figure 2. The distribution of ATS levels for HAC cases and controls
We next examined the relationship between CDT and ATS. ATS is positively correlated with CDT in the entire sample (r = 0.52, p < 0.0001) and in the subset of participants with HAC (r = 0.40, p < 0.0001). The relationship is not evident in the control sample (r = 0.08, p = 0.28). shows the t-test results examining possible sex differences for CDT and ATS. Males appear to have slightly higher CDT scores than females in the HAC group (p = 0.02). Otherwise, no differences are apparent.
Table 1. Characteristics of study participants
Table 2. CDT and ATS comparison by sex for HAC cases and controls
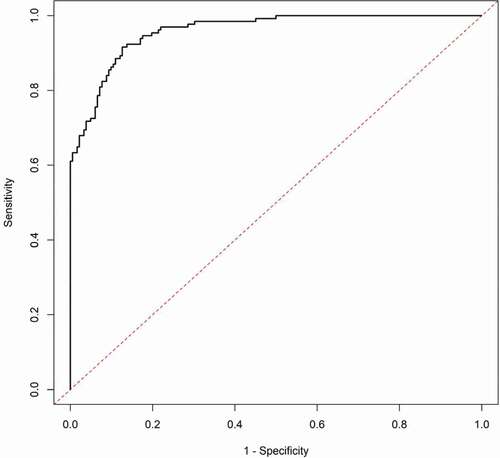
As a final step, we compared the predictive power of the CDT to the ATS for predicting HAC using standard logistic regression modelling (). The base model of gender and age produced an AUC of 0.649 and an AIC of 405. Addition of CDT to the base model improved the AUC and AIC to 0.865 and 267, while the addition of ATS information to the base model improved the AUC and AIC to 0.959 and 167, respectively. Finally, a model that incorporated the base model and both CDT and ATS information improved the AUC to nearly 0.98 with an AIC of 126. A comparison of the AUC values shows that the model with CDT and the model with ATS better predict HAC than the base model (p < 0.0001 for both), the model with ATS is a better predictor of HAC than the model with CDT (p < 0.0001), and the model with both CDT and ATS better predicts HAC than the models with CDT and ATS individually (p < 0.0001 and p = 0.007, respectively). The plots of the ROC curves for CDT and ATS are given in supplemental , respectively.
Table 3. AUC and AIC for Logistic Regression of CDT and ATS Values for Predicting HAC
Figure 3. Receiver Operator Characteristic Curve (ROC) for CDT
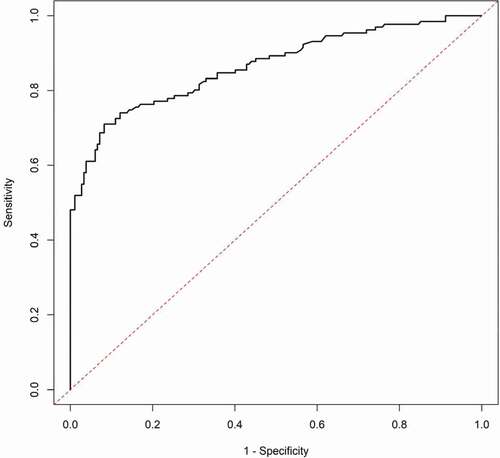
Figure 4. Receiver Operator Characteristic Curve (ROC) for ATS
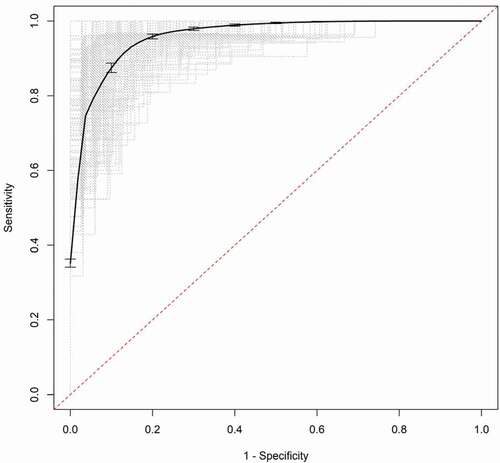
Validation of the models was accomplished through a bootstrap aggregation method using 200 samples. The model was refit in each training sample and applied to separate test samples to obtain an estimate of the predictive accuracy. The estimates of the aggregated AUC values are similar to the original values (e.g., 0.840 vs. 0.865 for CDT and 0.944 vs. 0.959 for ATS) and the aggregated ROC curves for CDT and ATS are shown in , respectively.
Figure 5. Aggregated receiver operator characteristic curve (ROC) for CDT. The dotted grey lines are the ROC curves for the bootstrap samples and the solid black line is the aggregated ROC curve
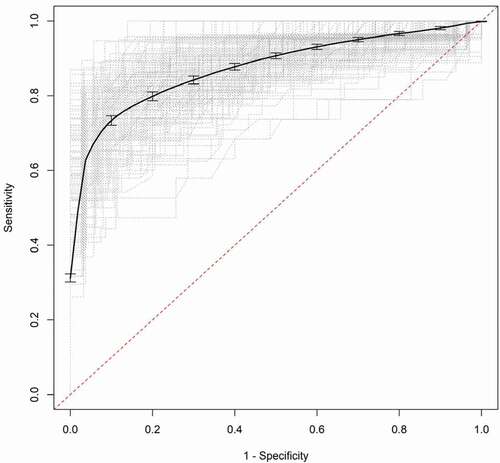
Figure 6. Aggregated receiver operator characteristic curve (ROC) for ATS. The dotted grey lines are the ROC curves for the bootstrap samples and the solid black line is the aggregated ROC curve
Discussion
In summary, we show that the ATS significantly outperforms the CDT in predicting HAC. We believe that the results demonstrate the strong promise of DNA methylation technologies for detecting HAC and provide a direct comparison of this new test’s performance to the current standard, the CDT, in a well-characterized population.
However, before discussing these results, a few cautions regarding the limitations of the ATS should be noted. First, these subjects were all self-reported heavy drinkers. The performance characteristics of the ATS in moderate drinkers are completely unknown. Second, the subjects in this study were mostly white with an average age around 40 years. Third, the performance of the test in adolescents and older adults is not known. Fourth, although every effort was made to get the serum in these studies processed quickly with every sample having been processed and placed in the freezer within 8 hours of phlebotomy, it is possible that degradation of serum sample occurred in the time between the draw and the performance of the CDT testing. Fifth, the response characteristics of neither the ATS nor the CDT with respect to co-morbid medical conditions such as diabetes or acute infection have been described. As the population continues to grey, it will be important to understand ageing related factors on test performance.
Although there are many lenses through which performance of diagnostic tests may be viewed, perhaps one of the most useful is the plot of the AUC [Citation29]. This plot not only allows easy visualization of the sensitivity of a test at all levels of sensitivity but also provides a method for visualizing the optimal point of test performance and metric ‘cut-offs’ for this population in which 4 out of 10 subjects were heavy drinkers. For the ATS, according to the method of Brown and Davis, [Citation29] this occurs at the point where the sensitivity of the test is 92% and the specificity is 82% (). This corresponds to an ATS value of 1.78 as the threshold between HAC and control subjects in this population. In contrast, at peak performance, the sensitivity of the CDT was 60% with a specificity of 96% (). This corresponds to a CDT level of 1.0% as being the best dividing line for the CDT test in this population. However, in the end, the designation of the optimal cut-off point depends on the question being asked and who is asking that question. For a thorough discussion of that matter, we refer the reader to Lopez-Raton et al., 2014 [Citation30].
Still, it should be pointed out that HAC is thankfully not that common in most populations and that selection of the optimal cut-off points for both the CDT and the new ATS should include consideration of the pre-test probability of a subject being an alcoholic. Using the commonly accepted value of 1.7 as the limit of the upper range of normal [Citation31], the CDT would have had 100% specificity and but only 37% sensitivity for HAC in our population. Still, the normal range suggested by Helander and associates reflects the expertise of 20 years of experience with the test performance and data from tens of thousands of subjects of various ages and ethnicities [Citation31]. In contrast, we have only a poor understanding of the distribution of the ATS metric as of yet. To remedy that deficit, and better understand the performance of the ATS metric for all levels of prior probability, we are continuing to collect new HAC and new control subjects. Once we have obtained sufficient numbers, we plan on using those data and machine learning approaches to generate ideal cut-offs for all levels of prior probability.
A distinct advantage of the ATS metric is its general applicability. As opposed to the CDT whose interpretation is affected by genetic variability, as long as there is sufficient bisulphite converted DNA to amplify, the ATS testing procedures should produce a result in all subjects. In part, this is because this is a DNA-based test and the four loci comprising the ATS metric were selected from over 20,000 other loci on the basis of lower genetic effects on their prediction capacity. This does not mean that genetic variability does not affect the test. Rather, the effects of genetic variation manifest as prediction error rather than the type of results (abnormal migration pattern) seen when genetic variation affects the CDT. The frequency of cryptic genetic variation affecting methylation can vary between ethnic groups [Citation32]. Therefore, it is essential for future studies to expand on the number of African American and Asian ancestries examined with this tool to determine whether genetic variation in these population differentially affects test performance.
At least one prior study has noted a modest effect of gender on the CDT [Citation33]. Whereas these findings could reflect a difference in the relative amount of alcohol consumed between the two genders, it also could reflect a more systemic issue related to the use of proteins produced in the liver for alcohol testing. We note that serum cut-off values for used for another liver protein, gamma-glutamylaminotransferase (GGT), used for prediction of alcoholism are also gender specific [Citation34]. Since hepatic protein synthesis is regulated by sex hormones [Citation35–37], it is plausible to hypothesize that either androgen or oestrogen is altering the dynamic response of the CDT in response to HAC. Given the paucity of large high-quality datasets that contain critical information, such as reliable consumption histories, body mass, medications, and medical co-morbidities, needed to study this issue, we suggest that determining the exact effects of gender on CDT performance may be difficult.
Perhaps the most useful aspect of the ATS is its ability to be conducted using saliva DNA. Almost all current approaches for assessing chronic alcohol consumption necessitate drawing blood. By using digital PCR correction techniques, it is relatively simple to correct for the buccal/white blood cell admixture challenges of saliva DNA [Citation38,Citation39]. Conceivably, in addition to HAC and smoking, it may be possible to assess and monitor a wide variety of conditions whose presence can be readily assessed using DNA methylation including coronary heart disease and diabetes [Citation40–42].
In summary, we report that in a cohort of 313 subjects from Iowa, a metric composed of the digital methylation assessments of four previously reported CpG loci significantly outperforms the CDT in predicting HAC. Further studies to test and extend these findings are indicated.
Disclosure statement
Dr Philibert is the Chief Executive Officer of Behavioral Diagnostics and the inventor of pending patent applications covering the use of DNA methylation to assess alcohol consumption. The remaining authors do not report any significant conflicts.
Additional information
Funding
References
- World Health Organization. Global status report on alcohol and health 2018. Geneva, Switzerland:World Health Organization; 2019.
- Sun Q, Townsend MK, Okereke OI, et al. Alcohol consumption at midlife and successful ageing in women: a prospective cohort analysis in the nurses’ health study. PLoS Med. 2011;8(9):e1001090.
- Ronksley PE, Brien SE, Turner BJ, et al. Association of alcohol consumption with selected cardiovascular disease outcomes: a systematic review and meta-analysis. BMJ. 2011;342:d671.
- National Institute of Alcoholism and Alcohol Abuse. “Alcohol facts and statistics”. Rockville, MD: Department of Health and Human Services,2020. https://www.niaaa.nih.gov/publications/brochures-and-fact-sheets/alcohol-facts-and-statistics
- Tavakoli HR, Hull M, Okasinski LM. Review of current clinical biomarkers for the detection of alcohol dependence. Innov Clin Neurosci. 2011;8(3):26.
- Kharbouche H, Faouzi M, Sanchez N, et al. Diagnostic performance of ethyl glucuronide in hair for the investigation of alcohol drinking behavior: a comparison with traditional biomarkers. Int J Legal Med. 2012;126(2):243–250.
- Bortolotti F, Sorio D, Bertaso A, et al. Analytical and diagnostic aspects of carbohydrate deficient transferrin (CDT): a critical review over years 2007–2017. J Pharm Biomed Anal. 2018;147:2–12.
- Madhubala V, Subhashree A, Shanthi B. Serum carbohydrate deficient transferrin as a sensitive marker in diagnosing alcohol abuse: a case–control study. J Clin Diagn Res. 2013;7(2):197.
- Whitfield JB, Dy V, Madden PA, et al. Measuring carbohydrate-deficient transferrin by direct immunoassay: factors affecting diagnostic sensitivity for excessive alcohol intake. Clin Chem. 2008;54(7):1158–1165.
- Bertholet N, Winter MR, Cheng DM, et al. How accurate are blood (or breath) tests for identifying self-reported heavy drinking among people with alcohol dependence? Alcohol Alcohol. 2014;49(4):423–429.
- Fagan KJ, Irvine KM, McWhinney BC, et al. Diagnostic sensitivity of carbohydrate deficient transferrin in heavy drinkers. BMC Gastroenterol. 2014;14(1):97.
- Caslavska J, Lanz C, Burda P, et al. Analysis of genetic variants of transferrin in human serum after desialylation by capillary zone electrophoresis and capillary isoelectric focusing. J Sep Sci. 2017;40(11):2488–2497.
- Song B, Zhu J, Wu J, et al. Determination of carbohydrate-deficient transferrin in a Han Chinese population. BMC Biochem. 2014;15(1):5.
- Cavalli-Sforza LL, Cavalli-Sforza L, Menozzi P, et al. The history and geography of human genes. Princeton, NJ:Princeton university press; 1994.
- Philibert RA, Penaluna B, White T, et al. A pilot examination of the genome-wide DNA methylation signatures of subjects entering and exiting short-term alcohol dependence treatment programs. Epigenetics. 2014;9(9):1212–1219.
- Liu C, Marioni RE, ÅK H, et al. A DNA methylation biomarker of alcohol consumption. Mol Psychiatry. 2016;23:422.
- Philibert R, Dogan M, Noel A, et al. Genome-wide and digital polymerase chain reaction epigenetic assessments of alcohol consumption. Am J Med Genet B Neuropsychiatr Genet. 2018;177(5):479–488.
- Dedeurwaerder S, Defrance M, Bizet M, et al. A comprehensive overview of infinium humanmethylation450 data processing. Brief Bioinform. 2013;15(6):929–941.
- Bizouarn F, Karlin-Neumann G. Digital PCR: methods and protocols. New York, NY:Springer; 2018.
- Philibert R, Miller S, Noel A, et al. A four marker digital PCR toolkit for detecting heavy alcohol consumption and the effectiveness of its treatment. J Insur Med. 201948:1-13.
- Bucholz KK, Cadoret R, Cloninger CR, et al. A new, semi-structured psychiatric interview for use in genetic linkage studies: a report on the reliability of the SSAGA. J Stud Alcohol. 1994;55(2):149–158.
- Schellenberg F, Wielders JP. Evaluation of capillary electrophoresis assay for CDT on SEBIA’s Capillarys system: intra and inter laboratory precision, reference interval and cut-off. Clin Chim Acta. 2010;411(23–24):1888–1893.
- Akaike H. Akaike’s information criterion. International encyclopedia of statistical science. New York, NY:Springer; 2011. p. 25.
- Hanley JA, McNeil BJ. A method of comparing the areas under receiver operating characteristic curves derived from the same cases. Radiology. 1983;148(3):839–843.
- Fleiss JL. Statistical methods for rates and proportions. 2nd ed. New York, NY: John Wiley & Sons Inc; 1981.
- DeLong ER, DeLong DM, Clarke-Pearson DL. Comparing the areas under two or more correlated receiver operating characteristic curves: a nonparametric approach. Biometrics. 1988;44:837–845.
- Robin X, Turck N, Hainard A, et al. pROC: an open-source package for R and S+ to analyze and compare ROC curves. BMC Bioinformatics. 2011;12(1):77.
- Breiman L. Bagging predictors. Mach Learn. 1996;24(2):123–140.
- Brown CD, Davis HT. Receiver operating characteristics curves and related decision measures: A tutorial. Chemometr Intell Lab Syst. 2006;80(1):24–38.
- López-Ratón M, Rodríguez-Álvarez MX, Cadarso-Suárez C, et al. OptimalCutpoints: an R package for selecting optimal cutpoints in diagnostic tests. J Stat Softw. 2014;61(8):1–36.
- Schellenberg F, Wielders J, Anton R, et al. IFCC approved HPLC reference measurement procedure for the alcohol consumption biomarker carbohydrate-deficient transferrin (CDT): its validation and use. Clin Chim Acta. 2017;465:91–100.
- Dogan MV, Xiang J, Beach SRH, et al. Ethnicity and smoking-associated DNA methylation changes at HIV co-receptor GPR15. Front Psychiatry. 2015;6:132.
- Bergström JP, Helander A. Influence of alcohol use, ethnicity, age, gender, BMI and smoking on the serum transferrin glycoform pattern: implications for use of carbohydrate-deficient transferrin (CDT) as alcohol biomarker. Clin Chim Acta. 2008;388(1):59–67.
- Bianchi V, Ivaldi A, Raspagni A, et al. Use of carbohydrate-deficient transferrin (CDT) and a combination of GGT and CDT (GGT–CDT) to assess heavy alcohol consumption in traffic medicine. Alcohol Alcohol. 2010;45(3):247–251.
- Tikkanen MJ, Nikkilä EA. Regulation of hepatic lipase and serum lipoproteins by sex steroids. Am Heart J. 1987;113(2,Part 2):562–567.
- Shen M, Shi H. Sex hormones and their receptors regulate liver energy homeostasis. Int J Endocrinol. 2015;73.
- Langer M, Chiandussi L Hormones and liver: some aspects of the problem. In: : Okolicsányi L., Csomós G., Crepaldi G, editors. Assessment and management of hepatobiliary disease. Berlin, Heidelberg:Springer; 1987. p. 217–225.
- Dawes K, Andersen A, Vercande K et al. Saliva DNA methylation detects nascent smoking in adolescents. J Child Adol Psychopharm. 201929:535–544.
- Philibert R, Dogan M, Beach SRH, et al. AHRR methylation predicts smoking status and smoking intensity in both saliva and blood DNA. Am J Genet. 2019;183(1):51–60.
- Soriano-Tárraga C, Jiménez-Conde J, Giralt-Steinhauer E, et al. Epigenome-wide association study identifies TXNIP gene associated with type 2 diabetes mellitus and sustained hyperglycemia. Hum Mol Genet. 2015;25(3):609–619.
- Dogan MV, Grumbach IM, Michaelson JJ, et al. Integrated genetic and epigenetic prediction of coronary heart disease in the Framingham heart study. Plos One. 2018;13(1):e0190549.
- Wang X, Liu A-H, Jia Z-W, et al. Genome-wide DNA methylation patterns in coronary heart disease. Herz. 2018;43(7):656–662.