
ABSTRACT
microRNAs (miRNAs) are small non-coding RNAs that play critical roles in gene regulation. The presence of miRNAs in extracellular biofluids is increasingly recognized. However, most previous characterization of extracellular miRNAs focused on their overall expression levels. Alternative sequence isoforms and modifications of miRNAs were rarely considered in the extracellular space. Here, we developed a highly accurate bioinformatic method, called miNTA, to identify 3’ non-templated additions (NTAs) of miRNAs using small RNA-sequencing data. Using miNTA, we conducted an in-depth analysis of miRNA 3’ NTA profiles in 1047 extracellular RNA-sequencing data sets of 4 types of biofluids. This analysis identified hundreds of miRNAs with 3’ uridylation or adenylation, with the former being more prevalent. Among these miRNAs, up to 53% (22%) had an average 3’ uridylation (adenylation) level of at least 10% in a specific biofluid. Strikingly, we found that 3’ uridylation levels enabled segregation of different types of biofluids, more effectively than overall miRNA expression levels. This observation suggests that 3’ NTA levels possess fluid-specific information relatively robust to batch effects. In addition, we observed that extracellular miRNAs with 3’ uridylations are enriched in processes related to angiogenesis, apoptosis, and inflammatory response, and this type of modification may stabilize base-pairing between miRNAs and their target genes. Together, our study provides a comprehensive landscape of miRNA NTAs in human biofluids, which paves way for further biomarker discoveries. The insights generated in our work built a foundation for future functional, mechanistic, and translational discoveries.
Introduction
Recent studies revealed the existence of extracellular RNAs (exRNAs) in many types of biofluids [Citation1,Citation2]. exRNAs are mostly packaged in small extracellular vesicles, microvesicles or in complex with lipoproteins or ribonucleoproteins [Citation3], which protect them from degradation by ribonucleases. exRNA expression could be highly cell type- or disease-specific [Citation4,Citation5], thus affording potential values as disease biomarkers [Citation6]. Importantly, the functional roles of exRNAs are also starting to unfold [Citation7–9]. For example, several studies reported the involvement of exRNAs in cell-to-cell communication in the local tumour microenvironment and during angiogenesis [Citation7,Citation10,Citation11].
The most-often studied exRNAs are microRNAs (miRNAs), small 18–22nt noncoding RNAs that are potent regulators of mRNA and protein expression levels [Citation12]. Most previous studies on extracellular miRNAs focused on interrogating their overall expression levels. Nonetheless, many miRNAs assume multiple sequence forms resulted from alternative miRNA processing or post-transcriptional modification [Citation13]. Specifically, a well-known class of post-transcriptional modification of miRNAs is non-templated addition (NTA) [Citation14]. Two types of 3’ miRNA NTAs have been reported [Citation15,Citation16], 3’ adenylation catalysed by GLD2 and 3’ uridylation by the terminal uridyltransferase-4 and 7 (TUT4/TUT7). Both types of 3’ NTAs may affect miRNA targeting, stability, or turnover [Citation12,Citation17,Citation18].
Thus far, only a small number of studies examined miRNA NTAs in the extracellular space. For example, a study using cultured human B cells examined 3’ NTAs of intracellular and extracellular exosomal miRNAs [Citation19]. The authors observed that 3’ NTAs of miRNAs showed distinct patterns in the two compartments, with 3’ adenylation more enriched intracellularly and 3’ uridylation overrepresented in exosomes. Another study examined global miRNA expression in blood cells, serum, and exosomes [Citation20]. They showed that 3’ NTA patterns clustered in a blood-lineage specific manner and extracellular 3’ NTAs were distinct from the intracellular profiles. These findings suggest that 3’ NTA patterns of miRNAs may carry specific information that segregates extra- and intracellular miRNA profiles. The mechanisms underlying this specificity remain unclear.
In this study, we developed a new analysis pipeline, called miNTA, to identify NTAs of miRNAs in any small RNA-sequencing (RNA-seq) data set and applied it to 1047 extracellular samples derived from 4 types of biofluids. To our best knowledge, this is the largest study of extracellular miRNA NTA profiles in biofluids. Although many studies have examined NTAs of intracellular miRNAs, the bioinformatic pipelines employed in most studies could be improved to enhance accuracy. Incorporating a number of stringency measures, our method achieves a low false discovery rate <5%. Applied to the large number of biofluid samples, we observed 3’ uridylation and adenylation as the two most prominent types of 3’ NTAs in extracellular miRNAs, with the former being more prevalent than the latter. Our analysis showed that 5’ NTAs are unlikely present in miRNAs, or extremely rare if exist at all. The levels of 3’ NTAs varied widely across miRNAs. Importantly, 3’ NTA levels can be used to segregate different types of biofluids, more effectively than miRNA expression levels. We also observed that extracellular miRNAs with 3’ uridylations are enriched in processes related to angiogenesis, apoptosis, and inflammatory response, and this type of modification may stabilize base-pairing between miRNAs and their target genes. Overall, our study provides global insights regarding 3’ end modifications of miRNAs in extracellular fluids.
Materials and methods
Cell culture
Human embryonic kidney cell line (HEK293T) was obtained from the ATCC. Cells were maintained in Dulbecco’s modified Eagle’s medium containing 10% fetal bovine serum (FBS) with antibiotics at 37 C in 5% CO2.
shTUT4 and shTUT7 knockdown
We used lentivirus-packaged short hairpin RNA (shRNA) to knock down TUT4 and TUT7. The shRNA sequences (purchased from IDT) were obtained from a previous study [Citation16] and non-target shRNA control plasmids (SHC016) from a previous publication [Citation21]. Co-transfection of pCMV-d8.91, pVSV-G, and pLKO1 into HEK293T cells was performed using Lipofectamine 3000 (Thermo Fisher Scientific, Cat# L3000-008). Lentiviruses were collected from conditioned media 48 h after transfection. Lentivirus-containing media was filtered using 0.45 µM PES syringe filter (VWR) and mixed with polybrene (8 μg/ml). Following 24 h of infection, cells were incubated with puromycin (1 μg/ml) for 3–4 days. To make double knock down cell lines, second round of infected cells were incubated with hygromycin (200 μg/ml) for 3–4 days. Knockdown efficiency was evaluated by Western blot using TUT4 (Proteintech Inc, Cat# 18,980-1-AP), TUT7 (Bethyl Laboratories cat# A305-089A) and beta-actin antibodies (Santa Cruz Biotech, Cat# sc-47,778 HRP).
Extracellular and intracellular RNA isolation
Lentivirus-infected HEK293 cells were washed three times with PBS and the medium was switched to serum-free medium containing antibiotic-antimycotic (Thermo Fisher Scientific, Cat# 15,240,112). Following 24 incubation, the cell culture medium was collected and centrifuged at 2,000 g for 15 min at room temperature. To thoroughly remove cellular debris, the supernatant was centrifuged again at 12,000 g for 35 min at room temperature. Then, the conditioned medium was used for RNA extraction with Trizol (Thermo Fisher Scientific, Cat# 10,296,028). Intracellular RNA was isolated using Direct-zol RNA mini prep kit (Zymo Research) from the same culture dish for extracellular RNA.
Small RNA library preparation
Small RNA sequencing libraries were generated using the NEBNext Small RNA library Prep kit and NEBNext multiplex oligos for Illumina according to the manufacturer’s instructions (New England Biolabs, E7300). The final small RNA libraries were purified from 6% PAGE gel, and their concentrations were measured by Qubit fluorometric assay (Life Technologies). Libraries were sequenced on an Illumina HiSeq-3000 (50-bp single-end).
Small RNA-sequencing data processing
For each small RNA-seq data set, adapters and low-quality nucleotides were removed from raw fastq sequences using cutadapt (v.1.11) [Citation22]. Following read mapping, we removed samples with <50,000 total reads mapped to miRNAs to ensure at least a modest sequencing coverage.
miNTA: read mapping
To enable comprehensive read mapping, miNTA includes a multi-step mapping strategy. miNTA rescues unmapped reads by performing 2 sequential rounds of trimming on the 3’ or 5’ end of unmapped reads and remapping them. First, all reads were aligned to the human genome (hg19) using Bowtie (version 1.1.2) [Citation23], allowing up to one mismatch and retaining uniquely mapped reads only. This stringency aims to minimize ambiguous mapping results. Next, the unmapped reads were trimmed by 1 nucleotide at their 3’ ends and realigned to the human genome according to the same requirements as described above. Unaligned reads from this step were trimmed again and aligned for another round. The above procedures were repeated using all original reads to carry out 5’ trimming and identify 5’ end NTAs. All remaining unmapped reads were restored to their original sequences and realigned after trimming 1 nucleotide each from the 3’ and 5’ end, respectively. Finally, the mapped reads (trimmed or untrimmed) were examined relative to the human genome reference to identify 3’ and 5’ NTAs.
miNTA: quality control (QC) procedures
QC of mapped reads
Incorrect mapping can lead to false positive predictions of NTAs. To ensure accurate read mapping, we realigned reads that mapped to miRNAs using BLAT [Citation24] against the human genome. Those reads that did not yield consistent alignment results by BLAT and Bowtie were removed from further analysis.
Canonical end positions of miRNAs
For each miRNA in each sample, the canonical 3’ end was defined as the position of the last nucleotide in the miRNA read sequence that matches the reference genome and supported by at least 50% of reads aligned to this miRNA. For 5’NTA analysis, the canonical 5’ end of each miRNA was defined similarly for each sample. Subsequently, NTAs were identified relative to the canonical end positions for each miRNA.
QC of modifications
The predicted NTAs were further examined to eliminate those that may reflect genetic variants or technical artefacts. First, predicted NTAs that overlapped known SNPs or genetic mutations were removed [Citation25–29]. Second, NTAs with a 100% modification level were removed as they may be due to mapping errors (similarly as in other studies of single-nucleotide variants [Citation30,Citation31]). Third, to minimize false positives due to likely sequencing errors, we removed reads with a PHRED score <30 at the position corresponding to the NTA. Lastly, for NTAs of each miRNA, we required at least 2 reads with the modification and the NTAs observed in at least five samples within the same fluid and data set group.
Comparison of detected 3’NTAs against Chimira and sRNAbench
As a proxy for error, we compared the proportion of identified 3’NTA that were Gs and Cs found in miNTA against sRNAbench (https://arn.ugr.es/srnatoolbox) and Chimira (version 1.5), two other methods known to identify 3’NTAs [Citation32,Citation33]. The comparison was performed on our six intracellular HEK293 samples (shControl and shTUT4 and shTUT7 double knockout, three biological replicates each). For each sample and each method, the number of 3’NTA Gs and Cs are counted and divided by the total number of all mono-3’NTA (A, U, C, G). All input fastq files had adapters previously trimmed.
Novel miRNA prediction
Novel miRNAs were predicted using miRDeep2 [Citation34] by combining reads from all samples of the same fluid (or cell type) in the same study. To obtain high confidence predictions, we imposed the following criteria, similar to previous studies [Citation35] [Citation1]: a miRDeep2 score >0 [Citation2]; ≥5 reads mapped to the passenger strand and ≥10 reads to the primary strand. For overlapping predictions, the one with the highest miRDeep2 score was chosen. The final set of putative novel miRNAs were combined with known miRNA annotations (miRBase V22) [Citation36] for subsequent analyses.
Gene ontology enrichment analysis
Gene ontology (GO) terms for miRNAs were downloaded from http://geneontology.org/gene-associations/goa_human_rna.gaf.gz [Citation37]. For each data set, miRNAs expressed in ≥50% of samples and with an average 3’ uridylation level of ≥5% were included for the GO analysis. For each query miRNA, a control miRNA without 3’ modifications was chosen randomly that matches the expression level of the query (± 20% relative to the query). GO terms present in the sets of query miRNAs and matched controls were collected, respectively. The process was repeated 10,000 times to construct 10,000 sets of control miRNAs, where each set has the same number of miRNAs as the query set. Query miRNAs that had less than three candidate controls were not included in this analysis. For each GO term associated with at least two query miRNAs, a Gaussian distribution was fit to the number of control miRNAs also associated with this term to calculate a p value. Significant GO terms were defined as those with FDR < 0.05.
miRNA read count normalization across data sets
To obtain miRNA expression levels, DESeq2 (version 1.14.1) [Citation38] was used to normalize miRNA read counts across data sets. miRNAs associated with at least 10 reads in at least 50% of all samples were used to generate the DESeq2 scale factor for normalization.
tSNE and PCA clustering
miRNAs expressed with a minimum read count of 10 were included for clustering analysis. tSNE and PCA clustering were performed using the package Rtsne and prcomp, respectively. The expression was set to 0 in samples where a miRNA has no reads. Levels of NTAs or Log2 of the DEseq2 normalized expression were used in these analyses.
Differentially modified miRNA between fluids
Differential modification of miRNAs between two fluids was performed using the REDITs method [Citation39]. miRNAs with an effect size ≥5% between fluids in expressed samples were included. Significant miRNAs were required to be expressed (read count ≥ 10) in at least 20 samples in both tested fluids with an FDR < 0.05.
miRNA target analysis
RNAhybrid (version 2.1.2) [Citation40] with default settings was used to estimate the minimum free energy between miRNAs and putative target 3’ UTR sequences. RNAhybrid p value was required to be <0.05 to call a significant minimum free energy binding site. Putative sites that base-paired with different types of 3’ NTAs (A, U, C, G) were then examined. GO enrichment of target genes pairing with the 3’ U NTAs was performed similarly as described above. For each miRNA, control genes were chosen from those putative target genes without 3’ U-pairing and with matched gene length as the query genes (±10%). Each query gene was required to have at least 10 controls to be included in the analysis.
Results
miNTA: a bioinformatic pipeline to identify miRNA NTAs
To explore the diversity of NTAs in the extracellular space, we first developed a rigorous pipeline, called miNTA, to accurately identify NTAs of miRNAs in small RNA-seq data (). While other methods to identify miRNA sequence variations exist [Citation32,Citation41–43], our method aims to improve the mapping strategies and reduce false positive modifications (Methods).
Figure 1. Identification of non-templated additions (NTAs) of miRNAs
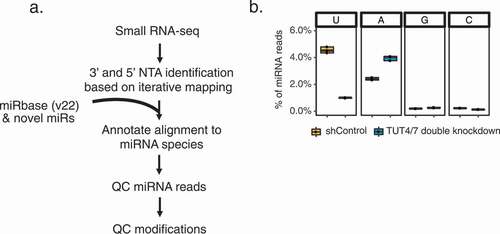
miRNA 3’ adenylation and uridylation are known to be mediated by specific enzymes such as, but not limited to, GLD-2 and TUT4/TUT7, respectively [Citation12]. To evaluate if our pipeline detects biologically relevant NTAs, we performed double knockdown (KD) of the TUT4 and TUT7 enzymes in HEK293 cells, followed by small RNA-seq (Methods and Supplementary Fig. S1A). As expected, we observed reduced global 3’ uridylation levels of miRNAs upon TUT4/7 KD relative to the controls (). In addition, a concomitant increase of 3’ adenylation levels was observed, consistent with previous literature [Citation16,Citation17]. Compared to two other popular methods, sRNAbench, and Chimira [Citation32,Citation33], miNTA identified the highest fraction of 3’ A and U, and correspondingly, lowest 3’ G and C NTAs (Supplementary Fig. S1B, C). Since there are no known enzymes for 3’ G and C NTAs on miRNAs in mammals, these NTAs are considered false positives. Similarly, we applied our method to two GLD2 KD data sets and observed an expected reduction of 3’ adenylation compare to control cells (Supplementary Fig. S2) [Citation15,Citation44]. Thus, the results here demonstrate the superior performance of miNTA, which is further evaluated below.
Comprehensive catalogue of miRNAs in the extracellular space
To investigate the landscape of extracellular miRNA 3’ NTAs, we obtained small RNA-seq data sets (50 nt, strand-specific) of four bodily fluids of healthy subjects obtained from previous studies [Citation45–49] (). In total, we analysed 1047 data sets, including 399 plasma samples, 163 samples of small extracellular vesicles isolated from plasma, 167 serum, 69 cerebral spinal fluid (CSF), and 249 urine samples. As a comparison, we also analysed 297 intracellular data sets of seven types of human peripheral blood cells (NK cells, B lymphocytes, cytotoxic T lymphocytes, T-helper cells, monocytes, neutrophils, and erythrocytes) sorted from whole blood [Citation20].
Figure 2. Generation of a comprehensive catalogue of extracellular miRNAs
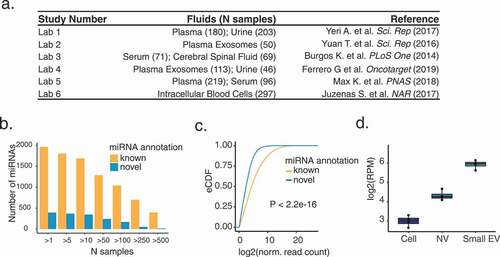
Although intracellular miRNAs have been studied extensively, the repertoire of extracellular miRNAs is still being explored. To create a comprehensive list of human miRNAs, as the first step of the pipeline, we ran miRDeep2 [Citation34] on all extracellular and intracellular data sets to identify novel miRNAs. This procedure identified a total of 404 novel miRNAs, present in more than one sample (). Interestingly, 85.3% of these novel miRNAs were detected in more than 10 samples, a slightly higher percentage than that (81.7%) of known miRNAs. Nonetheless, novel miRNAs had relatively lower expression levels than known miRNAs (), likely explaining their absence in the miRBase annotation. Notably, certain novel miRNAs may have higher expression levels in the extracellular space, such as the example shown in (derived from paired intra- and extracellular data sets [Citation50], also see Supplementary Fig. S3). Henceforth, we include both annotated and novel miRNAs in the analysis.
miRNA NTAs in the extracellular fluids and evaluation of the NTA pipeline
Next, we examined NTA profiles identified in individual miRNA reads, without grouping reads per miRNA. On average across fluids, 5.2% or 0.3% of all miRNA reads had 3’ or 5’ end NTAs, respectively (). For intracellular samples, 11.2% or 0.2% of total miRNA reads had 3’ or 5’ end NTAs, respectively (Supplementary Fig. S4A).
Figure 3. NTA profiles of extracellular miRNAs across biofluids
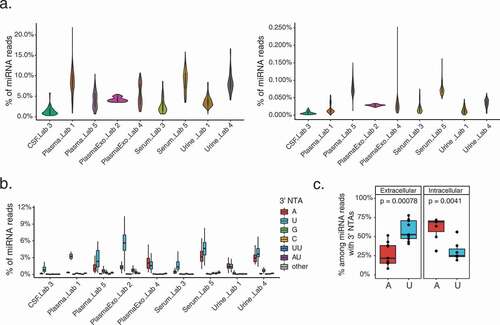
We next examined the nucleotide composition of the 3’ NTAs across miRNA reads for each fluid. This analysis also allows us to evaluate the quality of our pipeline as miRNAs are expected to have predominantly two types of 3’ NTAs (adenylation and uridylation), based on previous reports [Citation15,Citation19]. On average, >94% of all mono 3’ end modifications in reads of extracellular samples were identified as either adenylation or uridylation, whereas 3’ end cytosine or guanosine additions were each less than 3.4% (). Similar results were also observed for intracellular groups (Supplementary Fig. S4B). If the observed 3’ G or 3’ C modifications were assumed to be false positives, then the false discovery rate (FDR) of our predicted mono 3’ NTA-containing reads would be estimated to be <5% for exRNAs, and <2% for intracellular miRNAs. Note that these FDRs may be over-estimated since 3’ G or C NTAs may exist, although no known enzymes have been reported for these modifications in mammals.
Our bioinformatic pipeline also allowed an investigation of 5’ NTAs of miRNAs. In general, the prevalence of 5’ NTAs were much lower than that of 3’ NTAs (). Despite this low level, a strong enrichment of cytosine among the 5’ NTAs was observed (Supplementary Fig. S5A). A very low range of 5’ Cs (average <0.028%) was observed for 78 miRNAs in Plasma from Lab 5 (Supplementary Fig. S5B). Since no known mechanisms exist to account for 5’ C modification of miRNAs in mammals, the observed 5’ C NTA may reflect technical rather than biological mechanisms. For example, the 5’ adaptor used in small RNA library generation ended with a C nucleotide, which may have been read as the first base of the read as a type of sequencing error. Another report also observed a high proportion of 5’ addition of C [Citation43]. Although the 5’ C may be an experimental artifact, the fact that this strong nucleotide bias was observed despite the overall low prevalence of 5’ NTAs strongly supports the effectiveness of our pipeline.
miRNA 3’ uridylation is relatively more prevalent than 3’ adenylation in biofluids
Next, we examined the landscape of 3’ NTAs of miRNAs by grouping reads for each miRNA. In this analysis (and all others henceforth), we required ≥2 reads in each sample carrying the NTA nucleotide, with ≥5 samples satisfying this requirement in the same data set. When summarizing results for each fluid data set, we further required that ≥10 total reads mapped to the corresponding miRNA in each sample.
We observed that 32% (496/1541) or 26% (405/1541) of all detected miRNA species had 3’ uridylation or 3’ adenylation, respectively, considering all the biofluid data sets. Although the total numbers of modified miRNA species were similar, 3’ uridylation in reads mapped to miRNAs was significantly more frequent than 3’ adenylation, 58% and 27% among all types of 3’ NTAs, respectively (). In contrast, the opposite trend was observed in intracellular samples, where a larger fraction of miRNAs had 3’ adenylations than uridylations (61% and 31%, respectively) (). Overall, miRNA 3’ uridylation was more frequent in extracellular data sets (58%) compared to intracellular data sets (31%) (Wilcoxon rank sums test, p value = 0.003).
miRNAs exhibit a wide range of NTA levels in biofluids
The 3’ uridylation levels varied greatly across miRNAs in each type of fluid (). While many miRNAs had relatively low 3’ U levels, a number of them had modest to high levels. For example, 39% (122/312) of 3’ U-harbouring miRNAs in plasma (Lab 1 data set) had ≥20% 3’ U levels. A substantial fraction (23%–53%) of 3’ uridylated miRNAs had an average 3’ U level of at least 10% in each specific type of biofluid (). In particular, the hsa-let-7 f-2-3p demonstrated a high level of 3’ U (ranging 14%–93%) across all extracellular data sets. miRNAs with ≥5% average 3’ uridylation level across samples with the modification are listed in Supplementary Table S1A. Note that the 3’ U levels of the same miRNA between different data sets may not be comparable due to the distinct experimental protocols used to generate each data set. Among the three studies where at least 10 novel miRNAs were detected with 3’ uridylation, two showed higher 3’ U levels in novel miRNAs than known ones (Wilcoxon rank-based test, Supplementary Fig. S6).
Figure 4. Characteristics of miRNAs with 3’ NTAs
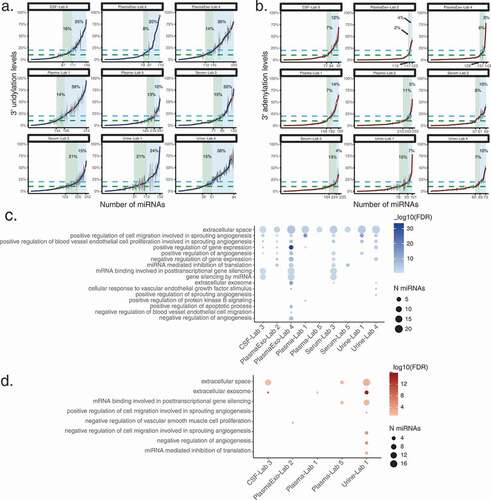
Similarly, the 3’ adenylation levels also varied across miRNAs (). Consistent with the previous observation of lower 3’ A levels compared to those of 3’ U, only 14.7% (27/189) of 3’ A-harbouring miRNAs had a 3’ A level ≥20% in the plasma (Lab 1) data set. About 6–22% of 3’ adenylated miRNAs had an average 3’ A level of at least 10% in each type of biofluid. Nonetheless, a small number of miRNAs had considerable levels of 3’ adenylation (Supplementary Table S1B). An example is hsa-miR-6513-3p that demonstrated a high level of 3’ A (ranging 8%–48%) across 3 extracellular data sets. No studies were detected with at least 10 novel 3’ adenylated miRNAs.
NTAs often occur in miRNAs relevant to angiogenesis or signalling
To gain insights on the functional relevance of 3’ uridylation of miRNAs, for each fluid in each data set, we performed Gene Ontology (GO) enrichment analysis on miRNAs that have an average 3’ uridylation level ≥5% in at least 50% of samples. As background controls, miRNAs without 3’ modifications in our data were chosen randomly by matching their expression levels with those that harboured 3’ Us (Methods). Interestingly, the GO term ‘extracellular space’ was significantly enriched (FDR < 0.05) for all data sets (). Since this analysis controlled for expression, this observation supports the enrichment of 3’ uridylation of miRNAs in the extracellular space. In addition, we observed terms related to angiogenesis, apoptosis, gene regulation, and inflammatory response, indicating the involvement of 3’ U-containing miRNAs in these processes. Since miRNAs in the let-7 miRNA family are known to be enriched with 3’ uridylation [Citation51], we repeated this analysis by excluding let-7 miRNAs. Similar enriched GO terms were observed, supporting the generality of the results for diverse miRNA species (Supplementary Fig. S7). For 3’ adenylated miRNAs, an enrichment for angiogenesis-related terms was observed, but mostly from the urine data set (Lab 1) ().
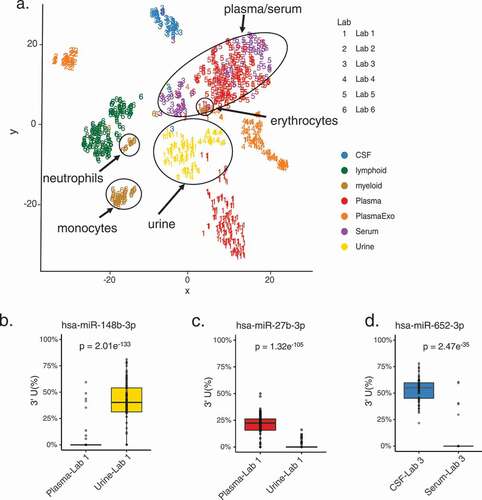
3’ uridylation levels of miRNAs segregate biofluids robust to batch effects
Given the wide range of 3’ uridylation levels in miRNAs, we asked whether this modification can help to segregate different types of fluids. tSNE clustering on 3’ uridylation levels of all expressed miRNAs showed that samples derived from similar fluid types tend to cluster together (). Specifically, serum, urine, and plasma samples each contained data sets generated by two different labs. For these fluids (especially serum and urine), we observed that samples of the same fluid type generated by different labs largely clustered together. This observation strongly suggests that 3’ uridylation levels are informative in segregating fluid types. In addition, we observed that intracellular blood cell types descending from the lymphoid lineage, such as T lymphocytes (CD4+, CD8+), B lymphocytes (CD19+), and natural killer cells (CD56+), clustered separately from cell types of the myeloid lineage. Myeloid cell types such as erythrocytes (CD235a), neutrophils (CD15+), and monocytes (CD14+) also clustered separately from each other. Cell types clustering by blood lineage based on their 3’-end composition was previously reported [Citation20]. Exosomal plasma samples did not cluster with plasma/serum samples, likely due to batch effects or the biological difference between exosomal and total extracellular miRNA contents. Segregation of samples based on 3’ adenylation levels was not as effective as using 3’ uridylation levels (Supplementary Fig. S8A), although serum and plasma samples from different labs did cluster together.
Figure 5. Distinct miRNA 3’ uridylation profiles across fluids
As a comparison, we also performed tSNE on normalized miRNA expression values (Methods). This analysis showed exacerbated batch effects where data generated from the same lab largely clustered together, instead of clustering by fluid types (Supplementary Fig. S8B). PCA analysis of these samples showed improved fluid segregation but still confounded by batch effects to some degree (Supplementary Fig. S8C). These results are consistent with observations made in previous studies where batch effects confounded the clustering of miRNA expression across samples [Citation3].
Comparison of 3’ uridylation of miRNAs between biofluids
These results suggest that different types of biofluids have distinct levels of 3’ uridylation. Thus, 3’ NTAs add another layer of information to distinguish fluid types. Nonetheless, since batch effects may not be completely absent, we avoided carrying out direct comparisons of the quantitative levels of NTAs across different studies. Instead, we performed differential modification analysis between fluids of the same study [Citation39] (Methods).
For this analysis, we included miRNAs expressed in at least 20 samples in both fluids of a study. Overall, we identified 62 miRNAs with differential 3’ uridylation levels (≥5% difference in modification levels, FDR <0.05) (Supplementary Table S2). Specifically, 25 miRNAs had differential 3’ uridylation between urine and plasma (Lab 1), 11 between CSF and serum (Lab 3), 12 between urine and exosomes from plasma (Lab 4), and 29 between plasma and serum (Lab 5). show three example miRNAs whose 3’ uridylation levels were high in one fluid, but almost zero in another.
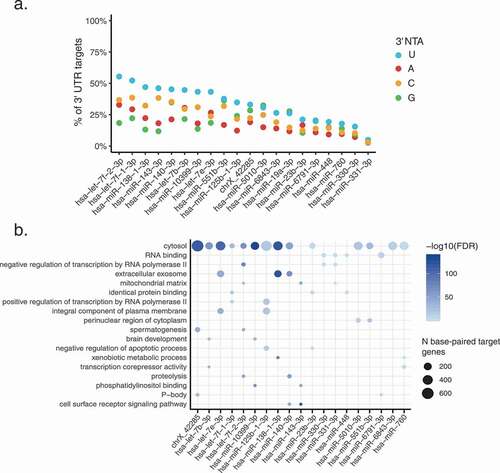
3’ uridylation may increase miRNA base-pairing to its targets
Given the relatively high levels of 3’ uridylation in extracellular miRNAs, we hypothesized that this modification may affect the base-pairing between miRNAs and their targets. We focused on the top 20 unique miRNAs with highest average 3’ uridylation levels (per fluid) across all samples (Methods). Using RNAhybrid [Citation40], we observed that 3’ uridylation tends to stabilize the interaction between miRNAs and their targets, to an extent much greater than 3’ NTAs of G, C or A nucleotides (, Chi-squared test p < 0.05). All miRNAs were significant against at least one of the background nucleotides. Target genes that paired with the 3’ U of these miRNAs were enriched in a variety of processes including extracellular exosome, integral protein of plasma membrane and negative regulation of apoptosis (). Thus, it is possible that 3’ uridylation of extracellular miRNAs may affect miRNA targeting once taken up by recipient cells.
Figure 6. 3’ U base-pairs with predicted miRNA targets more often than other 3’ NTAs
Discussion
We developed miNTA, a new bioinformatic pipeline, to identify 3’ NTAs of miRNAs. With different types of data sets, we demonstrated that the pipeline yields accurate and sensitive predictions. Using miNTA, we analysed the global landscape of 3’ NTAs of extracellular miRNAs in >1000 biofluid samples, the largest study so far for extracellular miRNA modifications (to the best of our knowledge). We made a number of notable observations [Citation1]: 3’ uridylation levels of miRNAs are higher in the extracellular space than 3’ adenylation levels, whereas the opposite was observed for intracellular miRNAs [Citation2]. The level of 3’ NTAs varied widely across miRNAs, with some miRNAs demonstrating nearly 100% 3’ uridylation in certain biofluids [Citation3]. 3’ uridylation levels of miRNAs can inform segregation of different types of biofluids. In addition, such segregation was more effective than that achieved by miRNA expression levels and largely robust to batch effects [Citation4]. Extracellular miRNAs with 3’ uridylations are enriched in functional categories related to angiogenesis, apoptosis, and inflammatory response, and 3’ uridylation may stabilize base-pairing between miRNAs and their target genes.
The effective segregation of biofluids by 3’ uridylation levels of miRNAs indicates that this type of miRNA modification possesses fluid-specific signatures. Thus, miRNA modification levels could serve as biomarkers that are less susceptible to batch effects. This property is likely due to the fact that modification levels are normalized metrics relative to the total miRNA expression. Differences in uridylation levels across fluids may be due to different cell types contributing distinct miRNA species into the extracellular space. Together, these results show that 3’ modification levels of miRNAs add an important layer of information to characterize extracellular RNA content.
The enrichment of 3’ uridylated extracellular miRNAs in angiogenesis, apoptosis, and inflammatory responses suggests that this modification may have important functional relevance. For example, angiogenesis is a tightly regulated process that requires endothelial cells to be in close communication with their environment [Citation52]. Extracellular vesicles were previously shown to play a role in regulating angiogenesis [Citation7,Citation52]. Thus, 3’ uridylation of miRNAs may be an important aspect contributing to this process. It should be noted that the functional enrichment analysis controlled for extracellular expression levels of 3’ uridylated miRNAs. Thus, the enriched categories reflect functions that are particularly relevant to 3’ uridylated miRNAs instead of extracellular miRNAs in general. We showed that 3’ uridylation may strengthen miRNA targeting. Interestingly, a previous study reported that 3’ uridylation of miR-27a induced target repression of ‘non-canonical’ sites with only partial seed-match and extensive 3’ end pairing [Citation17]. Future studies are needed to understand the functional relevance of 3’ uridylation in extracellular miRNAs.
Extracellular miRNAs were frequently examined as candidate biomarkers for cancer [Citation53]. While most studies focused on the expression of canonical miRNAs, miRNA modifications and sequence variants also have potential as diagnostic or prognostic biomarkers. For example, consideration of sequence variants of extracellular miRNAs in urine enabled improved segregation of controls and prostate cancer patients than using canonical miRNA expression alone [Citation54]. Similarly, the 3’ NTA version (C addition) of miR-21-5p was significantly higher expressed in serum of breast cancer patients compared to that of controls [Citation55]. In the same study, a multiple regression model including expression of the 3’ NTA version of miR-21-5p, canonical miR-21-5p, and tRF-Lys (TTT) was able to discriminate stage 0 breast cancer from the control group. Thus, considering both canonical and noncanonical miRNAs have valuable applications in translational research.
In summary, we presented an accurate pipeline to identify 3’ NTA patterns in extracellular miRNAs. Our large-scale analysis of data from different human biofluids supports that fluid-specific signatures exist in 3’ modifications of miRNAs. Our work extends the basis for future studies on the functional relevance of extracellular miRNA modifications and their values in biomarker discoveries.
Supplemental Material
Download MS Excel (23.5 KB)Supplemental Material
Download MS Excel (190.6 KB)Supplemental Material
Download PDF (665.8 KB)Acknowledgments
We thank members of the Xiao laboratory for helpful discussions and comments on this work. We acknowledge the data production efforts and the subject donors for making available the data sets used in this study. The Extracellular Small RNA Profiles in Plasma, Urine and Saliva from College Athletes Study (dbGAP phs001258) was made possible by the NIH Common Fund Program on Extracellular RNA Communication Grant UH3 TR000891, Riddell and BRG Sports, the Flinn Foundation grant awards #1994 and #2307, the staff and athletes at Arizona State University, and TGen faculty and interns. Thanks to The Michael J Fox Foundation for supporting the collection of dbGAP phs00727, the subject donors to the program at Sun Health Research Institute. This work was supported in part by grants from the National Institute of Health (U01HG009417, R01AG056476 to X.X) and the Jonsson Comprehensive Cancer Center at UCLA. K.K. was supported by a Eureka Scholarship from the Department of Integrative Biology and Physiology at UCLA.
Disclosure statement
No potential conflicts of interest were disclosed.
Supplementary material
Supplemental data for this article can be accessed here.
Additional information
Funding
Related Research Data
References
- Godoy PM, Bhakta NR, Barczak AJ, et al. Large differences in small RNA composition between human biofluids. Cell Rep. [Internet]. Elsevier. 2018; cited 2019 Apr 8];25:1346–1358. Available from: http://www.ncbi.nlm.nih.gov/pubmed/30380423
- Srinivasan S, Yeri A, Cheah PS, et al. Small RNA sequencing across diverse biofluids identifies optimal methods for exRNA isolation. Cell. [Internet]. Elsevier. 2019; cited 2019 Apr 8];177:446–462.e16. Available from: http://www.ncbi.nlm.nih.gov/pubmed/30951671
- Murillo OD, Thistlethwaite W, Rozowsky J, et al. exRNA atlas analysis reveals distinct extracellular RNA cargo types and their carriers present across human biofluids. Cell. [Internet]. Elsevier 2019; cited 2019 Apr 8];177:463–477.e15. Available from: http://www.ncbi.nlm.nih.gov/pubmed/30951672
- Mitchell PS, Parkin RK, Kroh EM, et al. Circulating microRNAs as stable blood-based markers for cancer detection. Proc Natl Acad Sci U S A. [Internet]. 2008; cited 2016 Nov 14];105:10513–10518. Available from: http://www.pnas.org/cgi/content/short/105/30/10513
- Danielson KM, Shah R, Yeri A, et al. Plasma circulating extracellular RNAs in left ventricular remodeling post-myocardial infarction. EBioMedicine. [Internet]. Elsevier. 2018; cited 2019 Apr 8];32:172–181. Available from: http://www.ncbi.nlm.nih.gov/pubmed/29779700
- Schwarzenbach H, Nishida N, Calin GA, et al. Clinical relevance of circulating cell-free microRNAs in cancer. Nat Rev Clin Oncol. [Internet]. Nature Publishing Group. 2014;11:145–156. Available from:. DOI:http://dx.doi.https://doi.org/10.1038/nrclinonc.2014.5
- Lucero R, Zappulli V, Sammarco A, et al. Glioma-derived miRNA-containing extracellular vesicles induce angiogenesis by reprogramming brain endothelial cells. Cell Rep. [Internet]. Cell Press 2020; cited 2020 Feb 23];30:2065–2074.e4. Available from: https://linkinghub.elsevier.com/retrieve/pii/S221112472030098X
- Melo SA, Sugimoto H, O’Connell JT, et al. Cancer exosomes perform cell-independent microRNA biogenesis and promote tumorigenesis. Cancer Cell. 2014;26:707–721. Cell Press
- Thomou T, Mori MA, Dreyfuss JM, et al. Adipose-derived circulating miRNAs regulate gene expression in other tissues. Nature. [Internet]. Nature Publishing Group. 2017;542:450–455. Available from:: http://www.nature.com/doifinder/https://doi.org/10.1038/nature21365
- Valadi H, Ekström K, Bossios A, et al. Exosome-mediated transfer of mRNAs and microRNAs is a novel mechanism of genetic exchange between cells. Nat Cell Biol. [Internet]. 2007;9;654–659. Available from: http://www.ncbi.nlm.nih.gov/pubmed/20617119
- Gao X, Zhang Z, Mashimo T, et al. Gliomas interact with non-glioma brain cells via extracellular vesicles. Cell Rep. [Internet]. 2020; cited 2020 Feb 28];30:2489–2500.e5. Available from: https://linkinghub.elsevier.com/retrieve/pii/S2211124720301236
- Gebert LFR, MacRae IJ. Regulation of microRNA function in animals. Nat Rev Mol Cell Biol. [Internet]. 2019; cited 2018 Nov 16];20:21–37. Available from www.nature.com/nrm
- Ameres SL, Zamore PD. Diversifying microRNA sequence and function. Nat Rev Mol Cell Biol. [Internet]. Nature Publishing Group. 2013;14:475–488. Available from: DOI:http://dx.doi.https://doi.org/10.1038/nrm3611
- Wyman SK, Knouf EC, Parkin RK, et al. Post-transcriptional generation of miRNA variants by multiple nucleotidyl transferases contributes to miRNA transcriptome complexity. Genome Res. [Internet]. 2011; cited 2019 Aug 1];21:1450–1461. Available from: http://www.ncbi.nlm.nih.gov/pubmed/21813625
- Burroughs AM, Ando Y, de Hoon MJL, et al. A comprehensive survey of 3’ animal miRNA modification events and a possible role for 3’ adenylation in modulating miRNA targeting effectiveness. Genome Res. [Internet]. 2010;20:1398–1410. Available from: http://www.ncbi.nlm.nih.gov/pubmed/20719920
- Thornton JE, Du P, Jing L, et al. Selective microRNA uridylation by Zcchc6 (TUT7) and Zcchc11 (TUT4). Nucleic Acids Res. [Internet]. Oxford University Press. 2014; cited 2019 Jan 16];42:11777–11791. Available from: http://academic.oup.com/nar/article/42/18/11777/2435142/Selective-microRNA-uridylation-by-Zcchc6-TUT7-and
- Yang A, Bofill-de Ros X, Shao T-J, et al. 3′ Uridylation confers miRNAs with non-canonical target repertoires. Mol Cell. [Internet]. Cell Press. 2019; cited 2019 Jun 11]; Available from: https://www.sciencedirect.com/science/article/pii/S1097276519303867?via%3Dihub
- Kingston E, Bartel D. Global analyses of the dynamics of mammalian microRNA metabolism. Genome Res [ [Internet]]. 2019;1–40. Available from: http://www.ncbi.nlm.nih.gov/pubmed/31519739.
- Koppers-Lalic D, Hackenberg M, Bijnsdorp IV, et al. Nontemplated nucleotide additions distinguish the small RNA composition in cells from exosomes. Cell Rep. 2014;8:1649–1658.
- Juzenas S, Venkatesh G, Hübenthal M, et al. A comprehensive, cell specific microRNA catalogue of human peripheral blood. Nucleic Acids Res. [Internet]. 2017; cited 2018 Nov 20];45:9290–9301. Available from: http://134.245.63.235/ikmb-tools/bloodmiRs
- Van NEL, Freese P, Pratt GA, et al. A large-scale binding and functional map of human RNA binding proteins. bioRxiv [Internet]. Cold Spring Harbor Laboratory; 2018 [ cited 2020 Jul 23];1–74. Available from: https://www.biorxiv.org/content/https://doi.org/10.1101/179648v2
- Compeau PEC, Pevzner PA, Tesler G, et al. Cutadapt removes adapter sequences from high-throughput sequencing reads. EMBnet. journal [Internet]. 2011;17:10–12. Available from:: http://journal.embnet.org/index.php/embnetjournal/article/view/200/479%0A
- Langmead B, Trapnell C, Pop M, et al. Ultrafast and memory-efficient alignment of short DNA sequences to the human genome. Genome Biol. [Internet]. BioMed Central. 2009; cited 2019 Jul 11];10:R25. Available from: http://genomebiology.biomedcentral.com/articles/https://doi.org/10.1186/gb-2009-10-3–r25
- Kent WJ. BLAT–the BLAST-like alignment tool. Genome Res. [Internet] Cold Spring Harbor Laboratory Press. 2002; cited 2019 Jul 11];12:656–664. Available from: http://www.ncbi.nlm.nih.gov/pubmed/11932250
- Sherry ST, Ward MH, Kholodov M, et al. dbSNP: the NCBI database of genetic variation. Nucleic Acids Res. [Internet]. 2001;29:308–311. Available from:: http://www.ncbi.nlm.nih.gov/pubmed/11125122
- Weinstein JN, Collisson EA, Mills GB, et al. The cancer genome atlas pan-cancer analysis project. Nat Genet Nature Publishing Group. 2013;45:1113–1120.
- Wang M, Beckmann ND, Roussos P, et al. The Mount Sinai cohort of large-scale genomic, transcriptomic and proteomic data in Alzheimer’s disease. Sci Data. [Internet]. Nature Publishing Groups. 2018; cited 2020 Feb 20];5:180185. Available from: http://www.ncbi.nlm.nih.gov/pubmed/30204156
- Karczewski KJ, Weisburd B, Thomas B, et al. The ExAC browser: displaying reference data information from over 60 000 exomes. Nucleic Acids Res. [Internet] 2017; cited 2020 Feb 20];45:D840–5. Available from: https://www.ncbi.nlm.nih.gov/pmc/articles/PMC5210650/
- Karczewski KJ, Francioli LC, Tiao G, et al. Variation across 141,456 human exomes and genomes reveals the spectrum of loss-of-function intolerance across human protein-coding genes. bioRxiv [Internet]. Cold Spring Harbor Laboratory. 2019;[ cited 2020 Feb 20];531210. Available from: https://www.biorxiv.org/content/https://doi.org/10.1101/531210v3
- Lee J, Ang JK, Xiao X. Analysis and design of RNA sequencing experiments for identifying RNA editing and other single-nucleotide variants. RNA. [Internet]. 2013;19:725–732. Available from: http://www.ncbi.nlm.nih.gov/pubmed/23598527
- Bahn JH, Lee J-H, Li G, et al. Accurate identification of A-to-I RNA editing in human by transcriptome sequencing. Genome Res. [Internet]. 2012;22;142–150. Available from: http://www.ncbi.nlm.nih.gov/pubmed/21960545%5Cnhttp://www.pubmedcentral.nih.gov/articlerender.fcgi?artid=PMC3246201
- Aparicio-Puerta E, Lebrón R, Rueda A, et al. sRNAbench and sRNAtoolbox 2019: intuitive fast small RNA profiling and differential expression. Nucleic Acids Res. [Internet] 2019; cited 2020 Feb 25];47:W530–5. Available from: https://www.biorxiv.org/content/10.1101/
- Vitsios DM, Enright AJ. Chimira: analysis of small RNA sequencing data and microRNA modifications. Bioinformatics. [Internet]. 2015; cited 2020 Feb 26];31:3365–3367. Available from: http://www.ebi.ac.uk/research/enright/software/chimira
- Friedländer MR, Mackowiak SD, Li N, et al. miRDeep2 accurately identifies known and hundreds of novel microRNA genes in seven animal clades. Nucleic Acids Res. [Internet]. Oxford University Press. 2012; cited 2018 Sep 21];40:37–52. Available from: http://www.ncbi.nlm.nih.gov/pubmed/21911355
- de Rie D, Abugessaisa I, Alam T, et al. An integrated expression atlas of miRNAs and their promoters in human and mouse. Nat Biotechnol. [Internet]. 2017;35:872–878. Available from:: http://www.ncbi.nlm.nih.gov/pubmed/28829439
- Kozomara A, Birgaoanu M, Griffiths-Jones S. miRBase: from microRNA sequences to function. Nucleic Acids Res. [Internet]. 2018; cited 2018 Nov 15];1–8. Available from: https://academic.oup.com/nar/advance-article-abstract/doi/https://doi.org/10.1093/nar/gky1141/5179337
- Huntley RP, Kramarz B, Sawford T, et al. Expanding the horizons of microRNA bioinformatics. RNA [Internet]. 2018;44(In press). Available from:: http://www.ncbi.nlm.nih.gov/pubmed/29871895
- Love MI, Huber W, Anders S. Moderated estimation of fold change and dispersion for RNA-seq data with DESeq2. 2014;15:1–21.
- Tran SS, Zhou Q, Xiao X. Statistical inference of differential RNA editing sites from RNA-sequencing data by hierarchical modeling. Gorodkin J editor., Bioinformatics. [Internet]. 2020;cited 2020 Feb 10]; Available from: https://academic.oup.com/bioinformatics/advance-article/doi/https://doi.org/10.1093/bioinformatics/btaa066/5719018
- Krüger J, Rehmsmeier M. RNAhybrid: microRNA target prediction easy, fast and flexible. Nucleic Acids Res. 2006;34:W451-W454.
- Wu X, Kim T, Baxter D, et al. sRNAnalyzer-a flexible and customizable small RNA sequencing data analysis pipeline. Nucleic Acids Res. [Internet]. Oxford University Press. 2017;45:12140–12151. Available from:: http://www.ncbi.nlm.nih.gov/pubmed/29069500
- Felipe Valter de Oliveira L, Paula Christoff A, Margis R. Sequence analysis isomiRID: a framework to identify microRNA isoforms. Bioinf Discov Note. [Internet]. 2013;[ cited 2020 Feb 26];29:2521–2523. Available from: http://www.ufrgs.br/RNAi/isomiRID/.
- Kaushik A, Saraf S, Mukherjee SK, et al. miRMOD: a tool for identification and analysis of 5’ and 3’ miRNA modifications in next generation sequencing small RNA data. Peer J. [Internet]. 2015;3;e1332. Available from: http://www.ncbi.nlm.nih.gov/pubmed/26623179%5Cnhttp://www.pubmedcentral.nih.gov/articlerender.fcgi?artid=PMC4662591
- D’Ambrogio A, Gu W, Udagawa T, et al. Specific miRNA stabilization by Gld2-catalyzed monoadenylation. Cell Rep. 2012;2:1537–1545.
- Burgos K, Malenica I, Metpally R, et al. Profiles of extracellular miRNA in cerebrospinal fluid and serum from patients with Alzheimer’s and Parkinson’s diseases correlate with disease status and features of pathology. PLoS One. [Internet]. 2014;9:e94839. Available from:: http://www.ncbi.nlm.nih.gov/pubmed/24797360
- Yuan T, Huang X, Woodcock M, et al. Plasma extracellular RNA profiles in healthy and cancer patients. Sci Rep. [Internet]. Nature Publishing Group. 2016;6:19413. Available from: http://www.ncbi.nlm.nih.gov/pubmed/26786760%5Cnhttp://www.pubmedcentral.nih.gov/articlerender.fcgi?artid=PMC4726401
- Ferrero G, Cordero F, Tarallo S, et al. Small non-coding RNA profiling in human biofluids and surrogate tissues from healthy individuals: description of the diverse and most represented species. Oncotarget. [Internet]. Impact Journals, LLC. 2018; cited 2019 May 6];9:3097–3111. Available from: http://www.ncbi.nlm.nih.gov/pubmed/29423032
- Max KEA, Bertram K, Akat KM, et al. Human plasma and serum extracellular small RNA reference profiles and their clinical utility. Proc Natl Acad Sci U S A [Internet]. 2018;1–10. Available from:: http://feedproxy.google.com/~r/Pnas-RssFeedOfEarlyEditionArticles/~3/IDAQF4UzrTw/1714397115.short
- Yeri A, Courtright A, Reiman R, et al. Total extracellular small RNA profiles from plasma, saliva, and urine of healthy subjects. Sci Rep. [Internet]. 2017;7:44061. Available from: http://www.ncbi.nlm.nih.gov/pubmed/28303895
- Jeppesen DK, Fenix AM, Franklin JL, et al. Reassessment of exosome composition. Cell. [Internet]. Elsevier. 2019; cited 2019 Apr 8];177:428–445.e18. Available from: http://www.ncbi.nlm.nih.gov/pubmed/30951670
- Heo I, Ha M, Lim J, et al. Mono-uridylation of pre-microRNA as a key step in the biogenesis of group II let-7 microRNAs. Cell. [Internet]. Cell Press 2012; cited 2019 Jan 25];151:521–532. Available from: https://www.sciencedirect.com/science/article/pii/S0092867412011294
- Todorova D, Simoncini S, Lacroix R, et al. Extracellular vesicles in angiogenesis. Circ Res. [Internet]. 2017; cited 2019 Aug 7];120:1658–1673. Available from: https://www.ncbi.nlm.nih.gov/pmc/articles/PMC5426696/
- Esquela-Kerscher A, Slack FJ. Oncomirs - microRNAs with a role in cancer. Nat Rev Cancer. [Internet]. Nature Publishing Group. 2006; cited 2020 Jul 23];6:259–269. Available from: www.nature.com/reviews/cancer
- Koppers-Lalic D, Hackenberg M, de Menezes R, et al. Non‑invasive prostate cancer detection by measuring miRNA variants (isomiRs) in urine extracellular vesicles. Oncotarget. [Internet]. 2016;7:22566–22578. Available from: http://www.ncbi.nlm.nih.gov/pubmed/26992225
- Koi Y, Tsutani Y, Nishiyama Y, et al. Predicting the presence of breast cancer using circulating small RNAs, including those in the extracellular vesicles. Cancer Sci. [Internet]. Blackwell Publishing Ltd. 2020; cited 2020 Jul 29];111:2104–2115. Available from: /pmc/articles/PMC7293081/?report=abstract