
ABSTRACT
Testicular germ cell tumours (TGCTs) respond well to cisplatin-based therapy. However, cisplatin resistance and poor outcomes do occur. It has been suggested that a shift towards DNA hypermethylation mediates cisplatin resistance in TGCT cells, although there is little direct evidence to support this claim. Here we utilized a series of isogenic cisplatin-resistant cell models and observed a strong association between cisplatin resistance in TGCT cells and a net increase in global CpG and non-CpG DNA methylation spanning regulatory, intergenic, genic and repeat elements. Hypermethylated loci were significantly enriched for repressive DNA segments, CTCF and RAD21 sites and lamina associated domains, suggesting that global nuclear reorganization of chromatin structure occurred in resistant cells. Hypomethylated CpG loci were significantly enriched for EZH2 and SUZ12 binding and H3K27me3 sites. Integrative transcriptome and methylome analyses showed a strong negative correlation between gene promoter and CpG island methylation and gene expression in resistant cells and a weaker positive correlation between gene body methylation and gene expression. A bidirectional shift between gene promoter and gene body DNA methylation occurred within multiple genes that was associated with upregulation of polycomb targets and downregulation of tumour suppressor genes. These data support the hypothesis that global remodelling of DNA methylation is a key factor in mediating cisplatin hypersensitivity and chemoresistance of TGCTs and furthers the rationale for hypomethylation therapy for refractory TGCT patients.
Introduction
Testicular germ cell tumours (TGCTs) are the most common solid cancers of young men [Citation1]. Metastatic TGCTs can be cured with cisplatin-based therapy [Citation2,Citation3]. However, some patients are refractory to this treatment and only half the patients who fail high-dose platinum treatment are cured [Citation4–6]. Targeted therapies have not been developed for TGCTs. Further, TGCT patients suffer from cisplatin related acute and chronic toxicities [Citation7]. Hence, there is a need for new treatments for cisplatin refractory TGCTs and a reason to develop targeted, cisplatin-sparing options. Further, understanding the curability of TGCTs may inform therapies for other solid tumours.
TGCTs are of two main types, seminomas and nonseminomas. Nonseminomas include embryonal carcinoma (EC), teratoma, yolk sac tumour and choriocarcinoma [Citation8]. Pluripotent EC are the stem cells of TGCTs and have an intrinsic hypersensitivity to drug-induced apoptosis [Citation9,Citation10]. The mechanism for this hypersensitivity and mechanisms for chemotherapy resistance are not known [Citation11,Citation12]. TGCTs originate from altered primordial germ cells. There is indirect evidence that epigenetics may play a dominant role in TGCT biology. TGCTs have few somatic mutations compared to other cancers [Citation13,Citation14]. Further, TGCTs have distinct pluripotent-like DNA methylation patterns compared to somatic cancers which include hypomethylation of some TGCT histotypes [Citation14–16]. DNA methylation in TGCTs roughly correlates with cisplatin sensitivity status [Citation14–16]. The RASSF1A, HIC1, MGMT and CALCA genes have been shown to be methylated in TGCT cells resistant to cisplatin [Citation17–19].
We showed that testicular cancer-derived ECs are hypersensitive to DNA methyltransferase inhibitors decitabine and guadecitabine and this extended to cisplatin refractory EC [Citation20–22]. Further, DNA methyltransferase inhibitors could resensitize cisplatin refractory TGCT cells to cisplatin [Citation20–22]. These findings have been confirmed [Citation23,Citation24]. These data provided the rationale for combining cisplatin and guadecitabine in a phase I clinical trial [NCT02429466]. The trial demonstrated tolerable toxicity and an overall response rate of 23% and clinical benefit rate of 46% in a cohort of heavily pretreated and cisplatin refractory patients including 2 complete responses and will be published separately.
Based on the above evidence, a popular recent hypothesis in the TGCT field is that cisplatin hypersensitivity in TGCTs may be mediated in part by unique epigenetics including DNA hypomethylation and conversely that DNA hypermethylation may be a mediator of cisplatin resistance [Citation11,Citation12,Citation25]. However, there is little direct experimental evidence to support this claim beyond the above mentioned small-scale candidate methylation studies of suppressor genes [Citation17–19]. Here, we utilize a series of isogenic cisplatin-resistant cell models to provide strong evidence that cisplatin resistance in TGCTs is associated with dramatic global DNA remodelling, DNA hypermethylation, and a strong negative correlation between gene promoter CpG island methylation and gene expression. A bidirectional shift between gene promoter and gene body DNA methylation also occurred within multiple genes that were closely associated with gene expression. These data support the hypothesis that DNA methylation status is a key factor in mediating cisplatin hypersensitivity and chemoresistance of TGCTs and furthers the rationale for hypomethylation therapy for refractory TGCT patients.
Results
Acquired cisplatin resistance in testicular cancer cells is associated with net DNA hypermethylation
We previously reported on a panel of 10 independently derived, acquired cisplatin-resistant cell lines from three distinct parental cisplatin sensitive cell lines, NT2/D1, 2102EP and 833K [Citation26]. RNA-seq transcriptome analysis revealed a highly significant enrichment of genes normally repressed by H3K27 methylation and polycomb repressive complex 2 (PRC2) in resistant cells [Citation26]. In order to assess whether DNA methylation changes are associated with cisplatin resistance, we assessed genome-scale DNA methylation in a subset of isogenic matched parental and resistant EC cells, namely NT2/D1 vs NT2/D1-C2, 2102EP vs 2102EP-B3 and 2102EP-C1 and 833K vs 833K-B4 in biological triplicate. A total of 789,553 individual CpG sites passed filtering and quality control criteria (see Methods) from the original 863,904 measured CpG loci on the Illumina EPIC array [Citation27]. Illumina EPIC array assigns beta values from 0 (unmethylated) to 1 (methylated) representative of the proportion of methylated cytosines in a DNA sample at each CpG [Citation27]. Array-wide principal component analysis (PCA) and density and bean plot analysis revealed a major grouping of cells based on cell lineage regardless of cisplatin sensitivity status () and S1 and S2). However, there were also indications of consistent groupings associated with cisplatin sensitivity status within each lineage, especially for 2102EP cells () and S1 and S2). When assessing differentially methylated probes between each resistant cell line and respective parent utilizing a cut-off of FDR < 0.05 and absolute delta beta value of ≥0.2, there was a substantially higher number of hypermethylated CpG probes compared to hypomethylated CpG probes in cisplatin-resistant cells compared to parent, 3.9 fold higher in 2102EP-B3 (33428 vs 8487), 5.6 fold higher in 2102EP-C1 (37763 vs 6738), 13.9 fold higher in NT2/D1-C2 (10617 vs 736) and 2.1 fold higher in 833K-B4 (3720 vs 1766) ()).
Figure 1. Cisplatin resistance in testicular germ cell tumour (TGCT) cells is associated with global DNA CpG hypermethylation. (a) Principal component analysis using beta values of all CpG sites from Illumina EPIC array of parental 2102EP, NT2/D1, 833 K cells and isogenic-derived resistant cells 2102EP-B3, 2102EP-C1, NT2/D1-C2 and 833 K-B4 in biological triplicate. (b) Total number of differentially methylated CpG sites in indicated resistant cells compared to matching parental cells, FDR < 0.05, absolute delta beta ≥ 0.2. (c) Volcano plots of all CpG sites for each resistant cell line compared to parent. Blue and yellow indicate hypermethylated and hypomethylated CpGs, respectively, with FDR < 0.05 and absolute delta beta ≥ 0.2. Number of differentially methylated CpGs is indicated. (d) Unsupervised cluster analysis of beta values of 20,000 most highly variable CpGs across all resistant and parental cell lines in biological triplicate
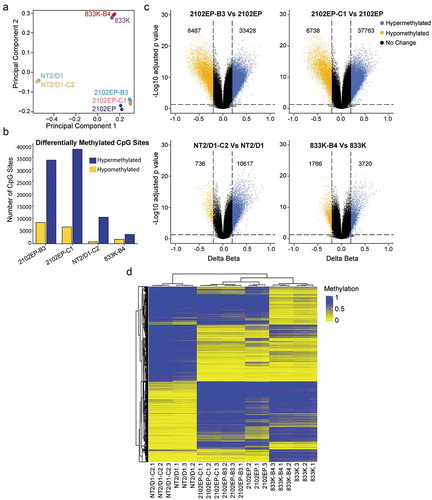
Unsupervised clustering using the top 20,000 most variable CpG sites across all the cell lines also clustered the lines based on parentage, again indicating that the most variable CpG sites distinguish one cell lineage from another ()). Within lines, we observed consistent differences in methylation between resistant and parental cells.
DNA hypermethylation is associated with distinct regulatory elements within DNA
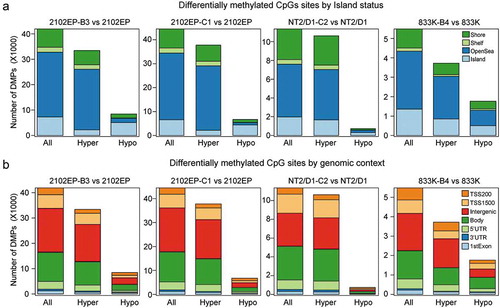
There was a consistent increase in the number of hypermethylated sites compared to hypomethylated sites in CpG shore, shelf and open sea regions in resistant cells compared to parental lines ()). However, differentially methylated CpG island sites were mixed with more hypermethylated island loci in NT2/D1-C2 and 833K-B4 and more hypomethylated island loci in 2102EP-B3 and 2102EP-C1 cells ()). The general increased hypermethylated CpGs in resistant cells was also seen across multiple genomic features including TSS200, TSS1500, gene body and intergenic regions ()). We also assessed the methylation status of Alu, LINE1 and LTR repeats identified by the REPM package [Citation28]. In resistant cells, there was a consistent hypermethylation of CpGs that mapped to repeat regions (Figure S3). The lone exception to this trend was decreased Alu element methylation in 833K-B4 cells.
Figure 2. DNA CpG hypermethylation in resistant TGCT cells is consistent across most genomic features. (a) Number of significantly changed CpG beta values between cisplatin-resistant and parental cells grouped by hypermethylation and hypomethylation and CpG location related to CpG islands; FDR < 0.05, absolute delta beta ≥ 0.2. (b) Number of significantly changed CpG beta values between cisplatin-resistant and parental cells grouped by hypermethylation and hypomethylation and CpG location related to genomic feature; FDR < 0.05, absolute delta beta ≥ 0.2
Non-CpG methylation occurs distinctively in the gene bodies of adult neuronal and pluripotent cells including embryonal stem, induced pluripotent stem, and EC cells [Citation29]. From a total of 2586 non-CpG sites that passed filtering, 1149 and 1423 non-CpG sites were differentially methylated in 2102EP-B3 and 2102EP-C1 cells with FDR < 0.05 and absolute delta beta ≥0.2, compared to parental 2102EP cells. Interestingly, all differentially methylated sites were hypermethylated in resistant cells and the vast majority of sites were in open sea regions in gene bodies typical of non-CpG methylation. In contrast, NT2/D1-C2 and 833K-B4 cells only had three non-CpG sites each that were significantly differentially methylated compared to parent, and all were hypomethylated.
Enrichment analysis of differentially methylated regions suggests hypomethylation of polycomb regulated regions and evidence for global nuclear reorganization of heterochromatin in cisplatin-resistant cells
Automated Locus Overlap Analysis (LOLA) enrichment analyses for genomic regions using core regulatory elements and pan-cistrome data sets from the cistrome Encode database were performed for CpGs hypomethylated or hypermethylated in cisplatin-resistant cells compared to sensitive parental cells [Citation30]. All enrichments with a q value < 0.05 were compiled (Tables S1 and S2). Hypomethylated CpGs in 2102EP-B3, 2102EP-C1 and NT2/D1-C2 cells were highly enriched for binding regions of polycomb complex members EZH2 and SUZ12 ()). Further analysis with a custom features database of EC and embryonic stem cells revealed that hypomethylated CpGs in these resistant cells were also enriched for H3K27me3 regions ()). These findings are consistent with our prior analysis of these cells that revealed a decrease in global H3K27me3 and enrichment in polycomb target gene expression [Citation26]. 833K-B4 cells showed only a modest enrichment for EZH2 and H3K27me3 regions and strong enrichment for H3K27ac regions (Figure S4(a)). Hypomethylated CpGs in all four lines were enriched for CpG island regions and enhancer segments (Figures S4(a) and S5).
Figure 3. Hypomethylated CpGs in resistant TGCT cells are associated with polycomb regulated regions and hypermethylated CpG are associated with nuclear organization of repressive chromatin. (a) Locus overlap analysis (LOLA) for significantly hypomethylated CpGs genomic regions in resistant cells using pan-cistrome databases from Encode reveals enrichment of hypomethylated CpGs in EZH2 and SUZ12 binding sites. (b) LOLA for significantly hypomethylated CpGs genomic regions in resistant cells using a custom embryonal stem cell and embryonal carcinoma cell database reveals enrichment of hypomethylated CpGs in H3K27me3 sites. (c) LOLA for significantly hypermethylated CpGs genomic regions in resistant cells using pan-cistrome databases from Encode reveals enrichment of hypermethylated CpGs in CTCF and RAD21 binding sites
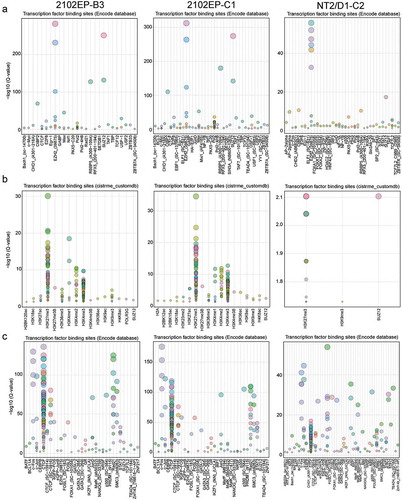
LOLA analysis for hypermethylated CpGs in 2102EP-B3, 2102EP-C1 and NT2/D1-C2 cells were highly enriched for CTCF, Lamin B1-lamina associated domains (LADs), RAD21 sites and repressed segments defined by the segmentation encode database () and S6). LADs are involved in nuclear organization of repressive chromatin and are flanked and influenced by CTCF binding, CpG island methylation and H3K27me3 [Citation31]. These findings suggest that cisplatin-resistant cells have undergone a nuclear reorganization of repressive chromatin. Hypermethylated sites in 833K-B4 cells demonstrated a hybrid enrichment pattern with enrichment for LADs and repressive segments but also an enrichment for EZH2 binding which was enriched with hypomethylation in the other 3 lines (Figure S4(b)). This suggests a qualitatively different interaction between DNA methylation, nuclear reorganization and H3K27me3 remodelling in 833K-B4 cells compared to the other resistant lines. Notably, RAD21 is associated with the CTCF interactor cohesin, and also regulates the cell cycle and DNA repair and is thus predicted to influence response to cisplatin [Citation32].
Cisplatin -resistant cells demonstrate a strong negative correlation between gene promoter CpG island methylation and gene expression and a more positive correlation between gene body methylation and gene expression
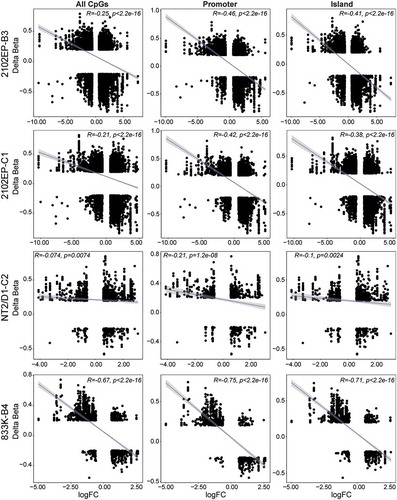
We next analysed whether changes in DNA CpG methylation correlated with changes in gene expression by integrative DNA methylome and transcriptome analysis. We created a data set of the intersection of all CpG probes with FDR < 0.05, absolute delta beta ≥0.2 that mapped to genes with expression changes FDR < 0.05 and absolute fold change ≥1.5 for each resistant cell line/parent comparison. In total there were 8209, 7612, 1227 and 1226 CpG/gene pairs that fit this criterion for 2102EP-B3, 2102EP-C1, NT2/D1-C2 and 833K-B4 cells, respectively (Table S3). There was an overall negative correlation between differential CpG methylation and gene expression for each of the resistant cell lines that was more pronounced when island/shore/shelf CpGs, and promoter-related CpGs (TSS1500, TSS200, ‘5UTR, 1st exon) were analysed separately (). In contrast CpGs in open sea regions or gene body regions showed either a positive or a non-significant correlation with gene expression (Figure S7). The one outlier again being 833K-B4 cells that had a negative correlation between CpG open sea and gene body methylation and gene expression (Figure S7).
Figure 4. Cisplatin-resistant TGCT cells have a global negative correlation between gene promoter and CpG island methylation and gene expression. Scatter plot of delta beta and fold-change values of all significantly methylated CpGs (FDR < 0.05, absolute delta beta ≥ 0.2) that also mapped to all significantly regulated genes in resistant cells vs respective parent cells. All CpGs, CpGs located in promoter regions (TSS1500, TSS200, ‘5UTR and 1st exon), and CpGs located in island, shore or shelf regions are depicted
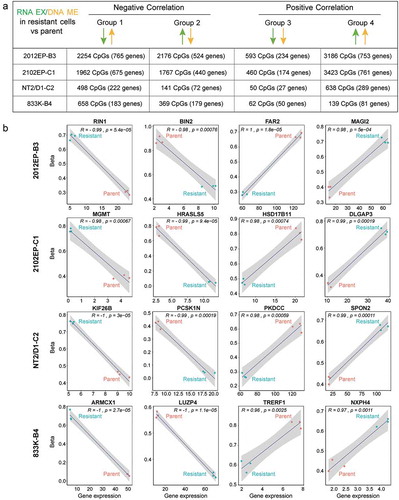
For each cisplatin-resistant/parent cell line pair we next divided the DNA methylation/gene expression correlation matrix into four groups based on the direction of the association. In Group 1 and Group 2 gene expression change in resistant cells negatively correlated with DNA methylation change in the context of DNA hypermethylation and hypomethylation change, respectively, while in Group 3 and Group 4 gene expression change in resistant cells positively correlated with DNA hypomethylation and hypermethylation, respectively () and Table S4). Correlation plots for representative CpG/gene pairs are provided for each group ()). In each case over 92% of the correlations had an R value of > ± 0.8. Many genes were in Group 1 and Group 2 which is in line with the hypothesis that DNA methylation mediates gene silencing. Interestingly, many genes fell within Group 4 representing incidences where increased gene expression in resistant cells correlated with increased methylation.
Figure 5. Distinct groupings of differentially methylated CpG sites correlate with distinct patterns of gene expression in cisplatin-resistant TGCT cells. (a) Schematic of groupings of all significantly methylated CpG sites that mapped to all significantly regulated genes in cisplatin-resistant cells compared to parent cells. Also provided are total number of CpGs and genes for each grouping in each cell line. (b) Scatter plot of biological triplicate beta and gene expression values for an example CpG/gene pair for each grouping in each resistant cell line
For non-CpG methylation, in 2102EP-B3 and 2102EP-C1 cells there were 78 and 77 genes, respectively, that were both differentially expressed with RNA-seq and also had differentially methylated non-CpG sites (all hypermethylated in resistant cells) compared to parental cells, with over 83% of the sites located in open sea regions of gene bodies (Table S5). For 2102EP-B3 cells 40 of these genes had upregulated gene expression compared to parent and 38 had downregulated gene expression and a similar pattern was seen in 2102EP-C1 cells, 41 upregulated genes and 36 downregulated. Hence, an increase in non-CpG gene body methylation was associated with cisplatin resistance in 2102EP-B3 and 2102EP-C1 cells. As mentioned above there was very little differential non-CpG methylation in NT2/D1-C2 and 833K-B4 cells.
For several genes, cisplatin resistance in testicular cancer cells is associated with a bidirectional shift in promoter and gene body CpG methylation
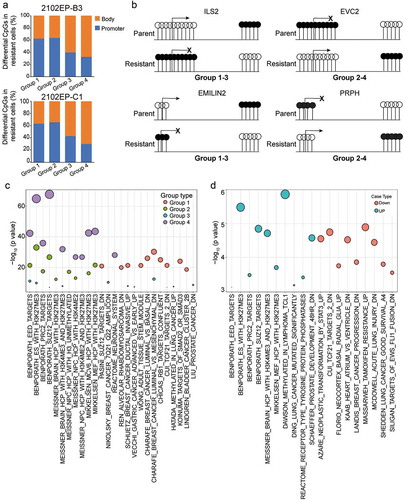
When each CpG/gene pair was further subdivided by location to either a promoter region (TSS1500, TSS200, ‘5UTR, 1st exon) or gene body region it was noted that DNA methylation of resistant cells in the negative correlation groups (Group 1 and 2) was enriched in promoter regions while the positive-correlated groups (Group 3 and 4) had enriched methylation in gene bodies ( and Figure S8). These reciprocal relationships between gene expression and CpG DNA methylation in cisplatin-resistant cells often occurred simultaneously in the same gene especially in 2102EP-B3 and 2102EP-C1 cells ()). This suggests that some genes in the resistant cells underwent a shift from gene body CpG methylation to promoter CpG methylation for repressed genes and a shift from promoter to gene body CpG methylation for induced genes.
Figure 6. Evidence for a location-specific relationship between altered CpG methylation and altered gene expression and a bidirectional shift in promoter and gene body methylation in cisplatin-resistant TGCT cells. (a) Number of CpG sites with significantly altered methylation in cisplatin-resistant cells for each grouping from Figure 5A reveals enrichment of differentially methylated CpGs in promoter regions (TSS1500, TSS200, ‘5UTR and 1st exon) for groups with negative correlation in CpG methylation and gene expression (Group 1 and 2) and enrichment of differentially methylated CpGs in gene body regions for groups with positive correlation in CpG methylation and gene expression (Group 3 and 4). (b). Specific examples of genes demonstrating bi-directional alterations in significantly altered CpG methylation between promoter and gene body regions in cisplatin-resistant cells compared to parent. A shift from gene body to promoter methylation is associated with decreased gene expression in resistant cells (combination of Group 1 and 3) and a shift from gene promoter to gene body CpG methylation is associated with increased gene expression in resistant cells (combination of Group 2 and 4). (c) Overlap analysis between genes of each grouping in 2102EP-B3 cells and the MSigDB C2 collection of curated gene sets reveals enrichment of polycomb targets in groups 4 and 2 and cancer-related tumour suppressor genes in groups 1 and 3. (d) Overlap analysis between hypermethylated non-CpGs in 2102EP-B3 cells and the MSigDB C2 collection of curated gene sets reveals enrichment of polycomb targets in upregulated genes and enrichment of cancer-related tumour suppressor genes in downregulated genes
Gene expression in resistant cells associated with distinct patterns of DNA methylation show distinct functional enrichment
To gain insight as to whether Group 1–4 genes have distinct functions, we performed Fisher exact tests between genes of each grouping in 2102EP-B3 and 2102EP-C1 cells against the Broad MSigDB C2 collection of 5529 curated gene sets [Citation33]. The majority of upregulated Group 4 and Group 2 genes were enriched in polycomb targets while the majority of downregulated Group 1 and Group 3 genes were related to cancer and tumour suppressor pathways including Rb1, PML and TCF21 () and S9(a) and Table S6). These findings imply that both polycomb target gene upregulation and tumour suppressor gene repression in cisplatin-resistant cells may be controlled by location-specific CpG hypermethylation (Group 4 and Group 1, respectively) and to a lesser extent location-specific CpG hypomethylation events (Group 2 and Group 3, respectively). Interestingly, the non-CpG hypermethylation of gene bodies in 2102EP-B3 and 2102EPC1 cells also segregated into similar groupings where the non-CpG hypermethylation associated with upregulated genes was associated with polycomb targets while the non-CpG hypermethylation associated with gene repression were enriched for tumour suppressor genes () and Figure 9(b) and Table S7).
Discussion
Knowledge pertaining to the curability of TGCTs has the potential to inform chemotherapy strategies for other solid cancers. TGCTs are aggressive and arise from transformed primordial germ cells (PGCs) [Citation8,Citation9]. Metastatic TGCTs can be cured with cisplatin at a high rate yet a significant number of patients suffer from cisplatin resistance and effective therapies for these patients do not exist. Common mechanisms of drug resistance in other cancers have not been accepted as mechanisms for the inherent sensitivity of TGCTs [Citation10–13,Citation34]. TGCTs have distinct epigenetics, including distinct patterns of DNA methylation, and also have few somatic mutations suggesting that epigenetics may be a key driver of TGCT biology [Citation35–37]. This has led to a popular recent proposal that DNA hypomethylation is a mechanism for TGCT cisplatin hypersensitivity and reciprocally DNA hypermethylation is a mechanism for cisplatin resistance [Citation11,Citation12,Citation26]. However, experimental evidence to support this premise has been sparse.
Here, we conducted unbiased genome-wide methylome analysis of four independently derived isogenic cisplatin-resistant TGCT models and found a strong association between cisplatin resistance in TGCTs cells and widespread DNA methylation spanning regulatory, intergenic, genic and repeat elements. We also report distinct global remodelling of CpG methylation is associated with cisplatin resistance. Hypermethylation in resistant cells is associated with repression of cancer suppressor genes and nuclear organization of repressive chromatin while hypomethylation is associated with the polycomb pathway. We also provide evidence for a bidirectional shift between gene promoter and gene body DNA methylation that associated with upregulation of polycomb targets and downregulation of tumour suppressor genes.
Hypermethylation in cisplatin-resistant cells was observed genome-wide across CpG and non-CpG loci spanning regulatory, intergenic, genic and repeat elements. Hypomethylation of Alu, LINE1 and LTR repeats has been associated with carcinogenesis and as a mechanism for antitumor activity of hypomethylation therapy, but repeat element methylation in chemotherapy resistance has not been well studied [Citation38]. Interestingly, hypermethylation also occurred in repressive DNA segments and CTCF sites and lamina associated domains (LADs). These elements are known to form functional domains that have a role in organizing the nuclear localization of repressed chromatin [Citation31,Citation39]. Such domains are known to be regulated by promoter CpG methylation and also H3K27 methylation [Citation31,Citation39]. We previously showed that H3K27me3 was downregulated in these resistant cells [Citation26]. In contrast DNA hypomethylation in resistant cells was associated with loci involved in H3K27me3 and the polycomb pathway suggesting that this DNA hypomethylation may in part be responsible for increased polycomb target gene expression seen in these cells [Citation26]. Our data thus hints at a complex relationship between CpG methylation and H3K27me3, the remodelling of which may have been selected for during acquired cisplatin resistance. It would be interesting to directly test this relationship in future work with H3K27me3 and polycomb cistrome studies. Further, important future work will be to confirm whether the epigenetic and gene expression changes found in our cell models extend to clinical cisplatin-resistant TGCTs.
A major finding in our study was a strong general negative correlation between DNA hypermethylation and gene expression, especially CpG methylation in promoters and CpG island regions. This finding is consistent with the hypothesis that promoter methylation represses expression of tumour suppressor genes [Citation40]. However, while this dogma generally holds true for individually studied gene promoters it appears not to hold true for many cancer studies on a global scale and has thus been controversial [Citation41]. It is possible that the many hypermethylated genes with repressed expression identified here could play a role in cisplatin resistance. Increased promoter methylation of MGMT, HIC1, CALCA and RASSF1A has previously been found in TGCT cells resistant to cisplatin [Citation17–19,Citation42,Citation43]. In our system, we only found evidence for MGMT hypermethylation associated with repressed MGMT gene expression in resistant cells (an example of this is in )).
Interestingly for many genes, CpG methylation was positively correlated with gene expression and in contrast to the negatively correlated genes which tended to have methylation in promoter regions, the CpG methylation for positively correlated genes tended to be in gene bodies. The positive correlation between gene body CpG methylation and gene expression is a well-established phenomenon [Citation44]. Negatively correlated genes were found to be associated with tumour suppression while positively correlated genes tended to be identified as the polycomb target genes. Of particular interest, we saw many examples where negatively correlated and positively correlated CpG methylation occurred in the same gene resulting from a bidirectional shift from CpG promoter methylation to gene body methylation. This form of plasticity and remodelling may be an important mechanism to account for selection of cisplatin-resistant TCGT cells.
Pluripotent cells contain high levels of non-CpG methylation called mCpH (H = A, C, T) along gene bodies of highly expressed genes [Citation15,Citation45]. In EC more that 20% of all cytosine methylation is mCpH while mCpH is largely undetected in most somatic cells and derived cancers [Citation45]. In addition, mCpH is rarely seen in mature components of nonseminoma or in seminoma, suggesting mCpH occurs mainly in the pluripotent EC component of TGCTs [Citation15]. While the role of non-CpG methylation in EC is currently unclear, we found uniform hypermethylation of non-CpGs in two of our resistant cell lines. Interestingly, non-CpG hypermethylation associated with increased gene expression also occurred frequently in polycomb target genes while non-CpG hypermethylation associated with repressed gene expression was associated with cancer tumour suppressor genes.
In summary, these data support the hypothesis that global remodelling of DNA methylation is a key factor in mediating cisplatin hypersensitivity and chemoresistance of TGCTs and furthers the rationale for hypomethylation therapy for refractory TGCT patients.
Materials and methods
Cell lines
Cell culture utilized DMEM (Gibco) media supplemented with 10% FBS (Invitrogen). The human TGCT derived EC lines, NT2/D1, 833K and 2102EP were from ATCC and authenticated by ATCC. Generation of cisplatin-resistant cell lines was previously described [Citation26]. Briefly, parental cells were exposed to increasing doses of cisplatin (Sigma) from 0.5 µM to 10 µM for 3 hours daily for 5 days and then allowed to recover. Cells were then cloned and shown to maintain cisplatin resistance in cisplatin-free media for 5 months.
Illumina infinium HumanMethylation 850K data normalization, filtering and analysis
DNA was purified using the Qiagen DNeasy Kit. DNA samples in biological triplicate were sent to the Molecular Genomics/Methylation Core at the University of Southern California. Bisulphite treatment with the EZ DNA methylation kit (Zymo) was performed. The Infinium EPIC beadchip array was used to assess the methylation level of CpG sites and targets 863,904 CpG sites. Analysis of Methylation-EPIC array data was performed in R using minfi package from Bioconductor [Citation46]. All samples passed quality control and all samples had mean detection p-value < 0.01. Data were normalized using FUNNORM (Functional Normalization) [Citation47]. Probes with detection p-value > 0.01 in any sample were removed from the analysis. Furthermore, probes associated with SNPs and cross-reactive probes were removed leaving 792,139 probes (789,553 CpG probes, 2586 non-CpG probes) for analysis [Citation48]. Differential methylation analysis was performed using limma. To correct for multiple hypothesis testing, False Discovery Rate (FDR) was calculated using the Benjamin-Hochberg correction method. Probes with FDR < 0.05 and absolute delta beta ≥0.2 were considered differentially methylated.
All differentially methylated probes (DMPs) were annotated using reference human genome (hg19). Relation to CpG island and genomic features (UCSC_RefGene_Group) was used as annotated on the EPIC array. Unsupervised Hierarchical clustering was performed using Manhattan distance and average linkage implemented in the ComplexHeatmap package available in R Bioconductor. Repetitive element analysis was performed using the Repetitive Element Methylation Prediction (REMP) package [Citation28]. Enrichment analysis of differentially methylated probes using genomic regions was performed using R package LOLA (Locus Overlap Analysis) using LOLA core databases [Citation30]. We also developed a custom database for LOLA analysis that included all studies related to NT2-D1 cells, and embryonic stem and embryonic carcinoma cells from the Cistrome database. Fisher’s exact test from the GeneOverlap package from R Bioconductor was used to find the significant overlap between C2 gene sets from MSigDB database [Citation33]. Correlation coefficient (r) and p-value was calculated using cor.test function in R using Pearson correlation. The ‘ggscater’, ‘ggplot2’, ‘Enhanced Volcano’, and ‘complexheatmap’ R packages were used for visualization of scatter plots, barplots, volcano plots and heatmaps. All methylation data sets have been deposited in the GEO database under accession number GSE156512.
RNA-seq data in this study were from our previous study published on the same cell lines in biological triplicate [Citation26]. Differentially expressed genes were selected at FDR < 0.05 and absolute fold change >=1.5. RNA-seq data is available at NCBI Database of GEO Datasets under the accession number GSE129696.
Supplemental Material
Download Zip (22.3 MB)Acknowledgments
We would like to thank Daniel Weisenberger and Kendra Bergen at the Molecular Genomics/Methylation Core at the University of Southern California for performing Infinium MethylationEPIC beadchip array assays and members of the Roy J. Carver Biotechnology Center and the University of Illinois, including Dr. Alvaro Hernandez and Chris Wright for RNA-sequencing.
Disclosure statement
The authors declare no conflict of interest.
Supplementary material
Supplemental data for this article can be accessed here.
Additional information
Funding
References
- Bray F, Ferlay J, Soerjomataram I, et al. Global cancer statistics 2018: GLOBOCAN estimates of incidence and mortality worldwide for 36 cancers in 185 countries. CA Cancer J Clin. 2018;68:394–424.
- Adra N, Einhorn LH. Testicular cancer update. Clin Adv Hematol Oncol. 2017;15:386–396.
- Lavoie JM, Kollmannsberger CK. current management of disseminated germ cell tumors. Urol Clin North Am. 2019;46:377–388.
- Feldman DR, Patil S, Trinos MJ, et al. Progression-free and overall survival in patients with relapsed/refractory germ cell tumors treated with single-agent chemotherapy: endpoints for clinical trial design. Cancer. 2012;118:981–986.
- Allen JC, Kirschner A, Scarpato KR, et al. Current management of refractory germ cell tumors and future directions. Curr Oncol Rep. 2017;19:8.
- O’Shaughnessy MJ, Feldman DR, Carver BS, et al. Late relapse of testicular germ cell tumors. Urol Clin North Am. 2015;42:359–368.
- Fung C, Dinh PC, Fossa SD, et al. Testicular cancer survivorship. J Natl Compr Canc Netw. 2019;17:1557–1568.
- Batool A, Karimi N, Wu XN, et al. Testicular germ cell tumor: a comprehensive review. Cell Mol Life Sci. 2019;76:1713–1727.
- Rijlaarsdam MA, Looijenga LH. An oncofetal and developmental perspective on testicular germ cell cancer. Semin Cancer Biol. 2014;29:59–74.
- de Vries G, Rosas-Plaza X, van Vugt MATM, et al. Testicular cancer: determinants of cisplatin sensitivity and novel therapeutic opportunities. Cancer Treat Rev. 2020;88:102054.
- Lobo J, Jerónimo C, Henrique R. Cisplatin resistance in testicular germ cell tumors: current challenges from various perspectives. Cancers (Basel). 2020 June 17;12:1601.
- Singh R, Fazal Z, Freemantle SJ, et al. Mechanisms of cisplatin sensitivity and resistance in testicular germ cell tumors. Cancer Drug Resist. 2019;3:580–594.
- Loveday C, Litchfield K, Proszek PZ, et al. Genomic landscape of platinum resistant and sensitive testicular cancers. Nat Commun. 2020;11:2189.
- Shen H, Shih J, Hollern DP, et al. Integrated molecular characterization of testicular germ cell tumors. Cell Rep. 2018;23:3392–3406.
- Killian JK, Dorssers LC, Trabert B, et al. Imprints and DPPA3 are bypassed during pluripotency- and differentiation-coupled methylation reprogramming in testicular germ cell tumors. Genome Res. 2016; 26:1490–1504.
- van der Zwan YG, Rijlaarsdam MA, Rossello FJ, et al. Seminoma and embryonal carcinoma footprints identified by analysis of integrated genome-wide epigenetic and expression profiles of germ cell cancer cell lines. PLoS One. 2014;9:e98330.
- Koul S, McKiernan JM, Narayan G, et al. Role of promoter hypermethylation in cisplatin treatment response of male germ cell tumors. Mol Cancer. 2004;3:16.
- Martinelli CM, Lengert AV, Cárcano FM, et al. MGMT and CALCA promoter methylation are associated with poor prognosis in testicular germ cell tumor patients. Oncotarget. 2016;8:50608–50617.
- Wermann WH, Stoop H, Gillis AJ, et al. Global DNA methylation in fetal human germ cells and germ cell tumours: association with differentiation and cisplatin resistance. J Pathol. 2010;221:433–442.
- Beyrouthy MJ, Garner KM, Hever MP, et al. High DNA methyltransferase 3B expression mediates 5-aza-deoxycytidine hypersensitivity in testicular germ cell tumors. Cancer Res. 2009;69:9360–9366.
- Biswal BK, Beyrouthy MJ, Hever-Jardine MP, et al. Acute hypersensitivity of pluripotent testicular cancer-derived embryonal carcinoma to low-dose 5-aza deoxycytidine is associated with global DNA damage-associated p53 activation, anti-pluripotency and DNA demethylation. PLoS One. 2012;7:e53003.
- Albany C, Hever-Jardine MP, von Herrmann KM, et al. Refractory testicular germ cell tumors are highly sensitive to the second generation DNA methylation inhibitor guadecitabine. Oncotarget. 2017;8:2949–2959.
- Wongtrakoongate P, Li J, Andrews PW. Aza-deoxycytidine induces apoptosis or differentiation via DNMT3B and targets embryonal carcinoma cells but not their differentiated derivatives. Br J Cancer. 2014;110:2131–2138.
- Oing C, Verem I, Mansour WY, et al. 5-azacitidine exerts prolonged pro-apoptotic effects and overcomes cisplatin-resistance in non-seminomatous germ cell tumor cells. Int J Mol Sci. 2018;20:E21.
- Lobo J, Gillis AJM, Jerónimo C, et al. Human germ cell tumors are developmental cancers: impact of epigenetics on pathobiology and clinic. Int J Mol Sci. 2019;20:pE258.
- Singh R, Fazal Z, Corbet AK, et al. Epigenetic remodeling through downregulation of polycomb repressive complex 2 mediates chemotherapy resistance in testicular germ cell tumors. Cancers (Basel). 2019;11:E796.
- Zhou W, Laird PW, Shen H. Comprehensive characterization, annotation and innovative use of Infinium DNA methylation beadchip probes. Nucleic Acids Res. 2017;45:e22.
- Zheng Y, Joyce BT, Liu L, et al. Prediction of genome-wide DNA methylation in repetitive elements. Nucleic Acids Res. 2017;45:8697–8711.
- Lee J-H, Park S-J, Nakai K. Differential landscape of non-CpG methylation in embryonic stem cells and neurons caused by DNMT3s. Sci Rep. 2017;7:11295.
- Sheffield NC, Bock C. LOLA: enrichment analysis for genomic region sets and regulatory elements in R and bioconductor. Bioinformatics. 2016;32:587–589.
- Madakashira BP, Sadler KC. DNA methylation, nuclear organization, and cancer. Front Genet. 2017;8:76.
- Cheng H, Zhang N, Pati D. Cohesin subunit RAD21: from biology to disease. Gene. 2020;758:144966.
- Subramanian A, Tamayo P, Mootha VK, et al. Gene set enrichment analysis: A knowledge-based approach for interpreting genome-wide expression profiles. Proc Natl Acad Sci U S A. 2005;102:15545–15550.
- Schmidtova S, Kalavska K, Kucerova L. Molecular mechanisms of cisplatin chemoresistance and its circumventing in testicular germ cell tumors. Curr Oncol Rep. 2018;20:88.
- Jostes S, Nettersheim D, Schorle H. Epigenetic drugs and their molecular targets in testicular germ cell tumours. Nat Rev Urol. 2019;16:245–259.
- Ilijazi D, Shariat SF, Hassler MR, et al. Epigenetic alterations of testicular germ cell tumours. Curr Opin Urol. 2020;30:264–270.
- Marques-Magalhães Â, Graça I, Henrique R, et al. Targeting DNA methyltransferases in urological tumors. Front Pharmacol. 2018;9:366.
- Ishak CA, Classon M, De Carvalho DD. Deregulation of retroelements as an emerging therapeutic opportunity in cancer. Trends Cancer. 2018;4:583–597.
- Lochs SJA, Kefalopoulou S, Kind J. Lamina associated domains and gene regulation in development and cancer. Cells. 2019;8:271.
- Jones PA, Issa J-PJ, Baylin S. Targeting the cancer epigenome for therapy. Nat Rev Genet. 2016;17:630–641.
- Spainhour JC, Lim HS, Yi SV, et al. Correlation patterns between DNA methylation and gene expression in the cancer genome atlas. Cancer Inform. 2019;11:18.
- Bo H, Cao K, Tang R, et al. A network-based approach to identify DNA methylation and its involved molecular pathways in testicular germ cell tumors. J Cancer. 2019;10:893–902.
- Ahmad F, Surve P, Natarajan S, et al. Aberrant epigenetic inactivation of RASSF1A and MGMT gene and genetic mutations of KRAS, cKIT and BRAF in Indian testicular germ cell tumours. Cancer Genet. 2020;241:42–50.
- Liu H, Liu X, Zhang S, et al. Systematic identification and annotation of human methylation marks based on bisulfite sequencing methylomes reveals distinct roles of cell type-specific hypomethylation in the regulation of cell identity genes. Nucleic Acids Res. 2016;44:75–94.
- Pinney SE. Mammalian non-CpG methylation: stem cells and beyond. Biology (Basel). 2014;3:739–751.
- JP T Jr, Hansen KD. Preprocessing, normalization and integration of the illumina HumanMethylationEPIC array with minfi. Bioinformatics. 2017;33:558–560.
- Fortin JP, Labbe A, Lemire M, et al. Functional normalization of 450k methylation array data improves replication in large cancer studies. Genome Biol. 2014;15:503.
- Chen YA, Lemire M, Choufani S, et al. Discovery of cross-reactive probes and polymorphic CpGs in the illumina infinium HumanMethylation450 microarray. Epigenetics. 2013;8:203–209.