
ABSTRACT
Histone lysine-to-methionine (K-to-M) mutations have been identified as driver mutations in human cancers. Interestingly, these ‘oncohistone’ mutations inhibit the activity of histone methyltransferases. Therefore, they can potentially be used as versatile tools to investigate the roles of histone modifications. In this study, we generated a genetically engineered mouse line in which an H3.3K36M mutation could be induced in the endogenous H3f3b gene. Since H3.3K36M has been identified as a causative mutation of human chondroblastoma, we induced this mutation in the chondrocyte lineage in mouse embryonic limbs. We found that H3.3K36M causes a global reduction in H3K36me2 and defects in chondrocyte differentiation. Importantly, the reduction of H3K36me2 was accompanied by a collapse of normal H3K27me3 distribution. Furthermore, the changes in H3K27me3, especially the loss of H3K27me3 at gene regulatory elements, were associated with the mis-regulated expression of a set of genes important for limb development, including HoxA cluster genes. Thus, through the in vivo induction of the H3.3K36M mutation, we reveal the importance of maintaining the balance between H3K36me2 and H3K27me3 during chondrocyte differentiation and limb development.
Introduction
Most of the mammalian bones, including long bones, are formed through the ossification of cartilage precursors which is known as endochondral ossification. To achieve this, undifferentiated chondrocytes (resting and proliferative chondrocytes) first differentiate into pre-hypertrophic and hypertrophic chondrocytes. Hypertrophic chondrocytes further undergo terminal differentiation, which is followed by apoptosis or chondrocyte-osteoblast transition at the primary ossification centres [Citation1–3]. The apoptosis of hypertrophic chondrocytes facilitates bone formation by allowing osteoblasts to accommodate in these tissues. These stepwise differentiation mechanisms are accompanied by dynamic changes in gene expression. For example, Sox9 and Pthlh are preferentially expressed in undifferentiated chondrocytes, while genes such as Col10a1 and Mmp13 become expressed upon differentiation [Citation4].
Recent studies have identified mutations in histone genes frequently found in cancers. These mutated histones, referred to as ‘oncohistones’, carry amino acid substitutions at the N-terminal tail of histone H3 [Citation5–7]. Among them, the lysine-to-methionine substitution at K36 in histone H3.3 (H3.3K36M) has been identified as a dominant mutation in chondroblastoma [Citation8]. Because chondroblastoma patients possess a somatic mutation in H3F3B encoding histone H3.3 without any other known oncogenic mutations, the H3.3K36M mutation is most likely the primary cause of pathogenesis [Citation8]. Interestingly, the H3.3K36M mutation affects not only the mutated histone H3.3 itself (i.e. H3.3K36M is not methylated at M36), but also stably binds to histone methyltransferases responsible for H3K36 methylation and occupies the catalytic pocket in their SET domain, thereby causing a global reduction in H3K36 methylation [Citation9–11]. Importantly, previous studies have shown that the presence of H3K36me2 and H3K36me3 marks inhibits polycomb repressive complex 2 (PRC2)-dependent H3K27me3 deposition, a major repressive histone mark, suggesting that H3K36 methylation is important for the establishment and/or maintenance of a proper H3K27me3 pattern [Citation12,Citation13].
In this study, we focused on the unique molecular features of H3.3K36M and created a knock-in mouse line in which H3.3K36M is conditionally expressed at the endogenous H3f3b locus. Because this mouse line has the potential to be used as a model for chondroblastoma, we investigated the effect of H3.3K36M in the chondrocyte lineage in embryonic limbs. Interestingly, we found that, although tumours are not formed, differentiation towards hypertrophic chondrocytes, which involves the acquisition of H3K36me2, is severely impaired in the presence of H3.3K36M. Mechanistically, H3.3K36M trapped NSD enzymes, caused the global loss of H3K36me2, and led to the re-distribution of H3K27me3, which resulted in the unexpected de-repression of genes including HoxA cluster genes. Thus, by taking advantage of induction of H3.3K36M in vivo, we revealed the importance of equilibrium between histone modifications for normal limb development.
Results
Generation of conditional knock-in mice that allow the induction of an H3.3K36M mutation
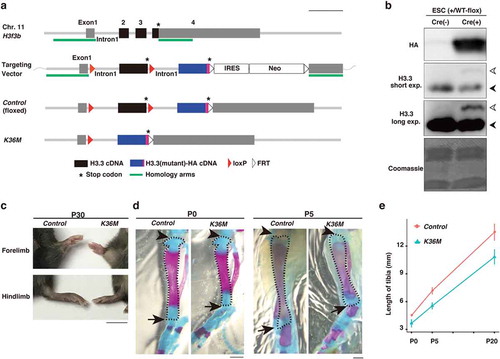
H3.3 is encoded by two genes, H3f3a and H3f3b, in mice. To express H3.3K36M at the physiological level, we created a knock-in mouse line in which the H3f3b locus was genetically modified. In these mice, two copies of cDNA encoding H3.3 were tandemly aligned under the endogenous H3f3b promoter (), S1(a), and S1(b)). Because the first H3.3 cDNA, ending with a stop codon, was flanked by loxP sites, the second H3.3 cDNA was not expressed until Cre-dependent recombination occurred () and S1(c)). Through this gene-switch strategy, we placed wild-type H3.3 cDNA as the first copy and HA-tagged H3.3K36M cDNA as the second copy (hereafter referred to as H3f3bK36M-flox). As a control, we also created another knock-in mouse line in which HA-tagged wild-type H3.3 cDNA was placed as the second copy (referred to as H3f3bWT-flox). We then crossed H3f3b+/WT-flox and CAG-Cre mice, in which Cre is expressed ubiquitously [Citation14], and found that the resulting mice, expressing HA-tagged wild-type H3.3, develop normally and do not show any detectable defects (Figure S1(d)). In contrast, H3f3bK36M-flox/+;CAG-Cre embryos did not develop to term, indicating that ubiquitous H3.3K36M expression at the early developmental stage leads to embryonic lethality (Figure S1(e)).
Figure 1. H3f3bK36M-flox/+; Prx1-Cre mice display a dwarfism-like phenotype
H3.3K36M expression in the chondrocyte lineage causes defects in limb development
Chondroblastoma is characterized by the presence of immature chondrocytes and their occurrence at the ends (epiphysis) of long bones such as the humerus, femur, and tibia in young patients, suggesting that defects in chondrocyte differentiation might be involved in the tumorigenesis [Citation15]. Thus, we crossed H3f3bK36M-flox/K36M-flox and Prx1-Cre mice to induce the expression of H3.3K36M in limb chondrogenic progenitor cells [Citation16]. While no chondroblastoma-like tumours were observed (see Discussion), we noticed that H3f3bK36M-flox/+;Prx1-Cre (hereafter referred to as K36M) mice exhibited short limbs, a dwarfism-like phenotype, which was visibly recognizable soon after birth. Importantly, the phenotype was observed with a complete penetrance (N = 23) ()). Furthermore, this phenotype was most pronounced in the tibias, fibulas, and metatarsals among limb long bones, and we mainly focused on tibias in further analyses. In K36M mice, tibias were approximately 20% shorter than those in control mice throughout postnatal development (). Of note, this defect was never overcome over the course of their lifetime, indicating that this phenotype cannot not be explained as a mere delay in limb development.
H3.3K36M impairs differentiation towards hypertrophic chondrocytes
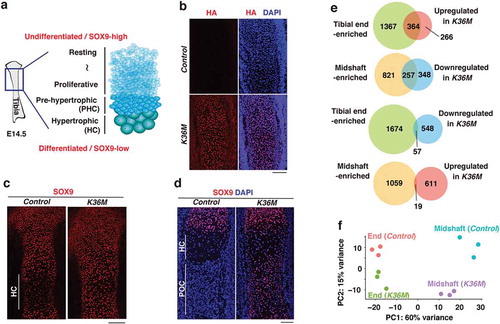
To examine how H3.3K36M affects the development of the limb skeleton, we performed immunofluorescence on E14.5 tibias, when chondrocytes located at the centre undergo progressive maturation ()). As expected, HA-tagged H3.3K36M was uniformly expressed in K36M tibias ()). Interestingly, while SOX9-low cells, which correspond to pre-hypertrophic and hypertrophic chondrocytes, were present at the centre of control tibias, SOX9-high immature chondrocytes were found throughout K36M tibias ()). In addition, this disorganized distribution of SOX9-positive cells was still observed at E16.5 ()). To better understand this phenotype, we next performed RNA-seq using E14.5 tibias. We collected tibias from three control and three K36M littermates and separated them into their ends (the epiphysis and outer part of the metaphysis) and midshafts (the diaphysis and inner part of the metaphysis) so that differentiation defects could be effectively detected. Notably, the transcriptome in K36M tibial midshafts was clearly discriminated from that of control (Figure S2(a)). Subsequently, we focused on several marker genes for undifferentiated and differentiated chondrocytes. In both control and K36M tibias, markers for undifferentiated chondrocytes such as Pthlh and Gas1 and those for pre-hypertrophic chondrocytes, including Ihh and Sp7, were adequately expressed in the corresponding samples (Figure S2(b)). In contrast, we noticed that the expression of well-known hypertrophic or terminal hypertrophic chondrocyte markers such as Col10a1, Mmp13, Ibsp, and Spp1 were commonly downregulated in K36M tibial midshafts (Figures S2(b,c)). To further characterize this phenotype, we first identified genes that were preferentially expressed either in tibial ends or midshafts using the data from control samples. We then addressed how those genes are affected by H3.3K36M. We found that a large fraction of genes upregulated in K36M tibial midshafts (364 out of 630 genes) corresponds to genes that are normally enriched in the tibial ends (odds ratio = 13.5, p < 1 × 10⁻²²). Conversely, a large fraction of downregulated genes in K36M tibial midshafts (257 out of 605 genes) corresponded to the genes normally enriched in the tibial midshafts (odds ratio = 12.6, p < 1 × 10⁻¹⁶) (); Tables S1 & S2). In line with these observations, principal component analysis of the RNA-seq data revealed that the transcriptome of K36M tibial midshafts was slightly shifted towards that of tibial ends ()). Collectively, these results indicate that H3.3K36M in chondrocyte progenitors impairs their differentiation towards hypertrophic chondrocytes, which is the final step of chondrocyte maturation.
Figure 2. H3.3K36M impairs differentiation towards hypertrophic chondrocytes
H3.3K36M disrupts the counterbalance between H3K36me2 and H3K27me3
We hypothesized that changes in gene expression would be due to alterations in H3K36 methylation status caused by H3.3K36M. Therefore, we first examined the distribution of H3K36me2 and H3K36me3 in tibias by immunofluorescence. Interestingly, in control tibias at E14.5, a strong H3K36me2 signal was detected specifically in pre-hypertrophic and hypertrophic chondrocytes, while H3K36me3 was evenly distributed throughout the tibias ()). Importantly, this H3K36me2 signal was almost completely abolished in K36M tibias, whereas H3K36me3 and H3K27me3 appeared to be unaffected ()). Consistent with these findings, a substantial reduction in total H3K36me2 levels was confirmed by western blotting ()). To investigate why H3K36me2 but not H3K36me3 was specifically affected, we performed a co-immunoprecipitation assay. This analysis revealed that H3.3K36M preferentially interacts with NSD1 and NSD2 (H3K36me2 methyltransferases) but not with SETD2 (a H3K36me3 methyltransferase), suggesting that H3.3K36M specifically suppresses the activity of H3K36me2 methyltransferases in this tissue () and see Discussion). To investigate how histone modification landscapes were affected by H3.3K36M, we performed ChIP-seq for H3K36me2, H3K36me3, and H3K27me3 using E14.5 tibial midshafts. After confirming the reproducibility of each replicate data (Figure S3(a)), we merged the data for further analysis. We found that while H3K36me3 was largely unaffected in K36M tibias, H3K36me2 enrichment was severely altered across the genome ()). In particular, H3K36me2, which was identified as megabase-sized domains in control tibias, was abolished at the intergenic regions ()). Because we did not include spike-in control due to technical difficulties with the tibia samples, we performed in silico normalization to examine the total H3K36me2 levels [Citation17]. Consistent with the results described above, application of the calculated scaling factor confirmed the global loss of H3K36me2 (Figures S3(b,c)). To address how H3.3K36M affects H3K36me2 levels, we compared our data to the previously reported H3.3K36M ChIP-seq data obtained from C3H10T1/2 cells which possess chondrogenic potential. Interestingly, we observed that H3K36me2 enrichment is decreased at the genomic regions where H3.3K36M is not enriched (Figure S3(d)), which is consistent with the previous observation that H3.3K36M is incorporated into active chromatin as is wild-type H3.3 [Citation10]. These data suggest that H3.3K36M promotes the reduction of H3K36me2 levels in trans.
Figure 3. H3.3K36M alters the histone modification landscape
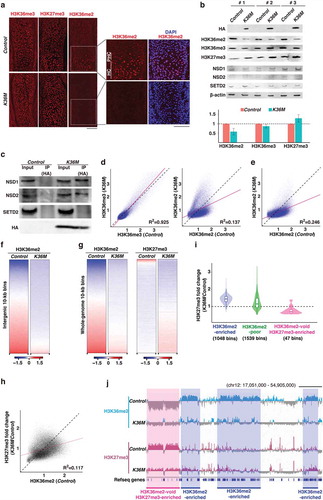
We next compared the H3K36me2 data with H3K27me3 ChIP-seq data. Interestingly, we noticed that the loss of those H3K36me2-enriched domains was coupled with a gain of H3K27me3 () and S3(e)). Notably, the degree of H3K27me3 increase was proportional to H3K36me2 levels in the control; that is, the regions normally enriched in H3K36me2 tended to show increased H3K27me3 when H3K36me2 enrichment was lost ()). Unexpectedly, although such a tendency was observed across the genome, a small fraction of the genome showed a drastic reduction in H3K27me3. Further analysis revealed that these regions normally lack H3K36me2 and are highly enriched for H3K27me3 (). These alterations in H3K27me3 enrichment may have been caused by the mis-recruitment of PRC2 to the regions where H3K36me2 was lost. Altogether, these results indicate that H3.3K36M globally abolishes H3K36me2 and induces changes in H3K27me3 distribution.
H3K27me3 alterations at regulatory elements result in unexpected de-repression of genes important for limb development
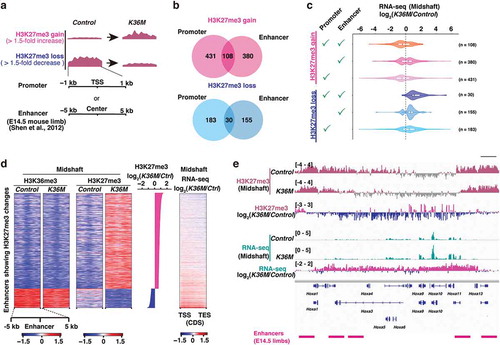
We next addressed how the H3.3K36M-driven alterations in the histone modification landscapes are linked to changes in transcription. Given the well-characterized function of PRC2 in the regulation of promoter and enhancer activities and cell differentiation [Citation18–20], we focused on alterations in H3K27me3 enrichment at promoters and enhancers. Using the dataset for putative enhancers in the E14.5 limb [Citation21], we identified a set of genes that show a gain or loss of H3K27me3 at their promoters or enhancers ()). Notably, some genes were commonly identified in both analyses ()). We found that although the gain or loss of H3K27me3 at enhancers as well as promoters were associated with the down- and upregulation of the corresponding genes, respectively, the anti-correlation between loss of H3K27me3 and the gene upregulation was more consistent and prominent ()). Importantly, in contrast to these findings from H3K27me3-centred analysis, gene expression-centred analysis revealed that H3K27me3 is not consistently lost at the promoters of upregulated genes in K36M, suggesting that only a subset of these genes is directly affected by loss of H3K27me3 (Figure S3(f)). Interestingly, the enhancers whose H3K27me3 level decreased were located at regions enriched for H3K36me3, indicating that these enhancers were located within transcriptionally active genes ()). Among these genes upregulated upon the loss of H3K27me3 at the promoters or enhancers, Bcl11a/b, Dnm3os, and Egfr, which are important for the formation of cartilage and bone in limbs, were included [Citation22–27] (Table S3). Furthermore, of particular note, HoxA cluster genes (Hoxa3, Hoxa10, and Hoxa11), which are well-known targets of PRC2, were consistently upregulated upon the loss of H3K27me3 ()). Because their spatiotemporally regulated expression is essential for the specification of positional identity and proper chondrocyte differentiation [Citation28], it is possible that the unexpected upregulation of HoxA cluster genes might be tightly linked to the observed phenotype. Given that mice lacking the core component of PRC2 also show defective chondrocyte differentiation [Citation29], these results strongly suggest that the counterbalance between H3K36me2 and H3K27me3 is the basis of normal limb development.
Figure 4. Altered H3K27me3 at the regulatory elements is associated with impaired transcriptional control
Discussion
In this study, we took advantage of the conditional induction of K-to-M mutation in vivo and elucidated the importance of H3K36 methylation in chondrocyte differentiation. H3.3K36M led to a global loss of H3K36me2 and alterations in H3K27me3 distribution, which was linked to alterations in gene expression. Although we identified several genes involved in chondrogenesis and limb development as mis-regulated genes, the upregulation of HoxA cluster genes is likely to have a significant impact on chondrocyte differentiation as HoxA genes have strong activity in promoting chondrocyte progenitors to be undifferentiated [Citation30]. However, transcriptome analysis indicated that H3.3K36M-expressing chondrocytes did not simply pause in an undifferentiated state. Therefore, it appears that chondrocytes expressing H3.3K36M are in a somewhat unique status possibly due to their unusual epigenetic state. Furthermore, it is important to note that because Prx1-Cre is already active in limb bud mesenchyme, H3.3K36M can also be expressed in cell types other than chondrocytes, such as osteoblasts, at a later stage of development. Therefore, further investigation is required to dissect the primary cause of the phenotype observed especially at peri- and post-natal development.
Previous studies using human samples showed that H3.3K36M inhibits the activity of SETD2 as well as NSD2 and causes the global reductions in both H3K36me2 and H3K36me3 [Citation9,Citation10]. In contrast, our analysis of the developing mouse limbs showed that H3.3K36M preferentially traps NSD1 and NSD2, but not SETD2. Through these interaction, H3.3K36M appears to induce global decrease of H3K36me2 in trans. As these NSD enzymes preferentially act on nucleosomal histone H3 [Citation31], we speculate that NSD1/2 might be trapped on chromatin containing H3.3K36M. Importantly, the observation that H3.3K36M specifically induces the reduction of H3K36me2 has also been reported by other groups [Citation32]. Therefore, we believe that interspecies differences in the amino acid sequence or protein structure of the histone methyltransferases may give rise to these differences although it is important to keep in mind that the function of H3.3K36M is affected by its molecular number under different cellular contexts. Because a decrease in both H3K36me2 and H3K36me3 was observed in the chondroblastoma, it would be tempting to examine what happens when H3.3K36M expression is combined with Setd2 knockout in a future study.
Materials and methods
Mice
All animal experiments were approved by the Animal Experiments Committee of Kyushu University (A30-081-2), and performed according to the guidelines for animal experiments at Kyushu University. Mice were housed in cages under specific pathogen-free conditions and had free access to water and food. To generate chimeric mice, knock-in embryonic stem (ES) cells were injected into blastocysts. Germline transmission was confirmed by PCR. The established mouse line was maintained on B6;129 mixed background.
Mouse cell lines
Male mouse embryonic stem cells (B6;129 F1 ES cells) were newly established and cultured with the medium consists of Glasgow’s minimum essential medium (Sigma) containing 15% foetal bovine serum, 0.1 mM 2-mercaptoethanol, nonessential amino acid, sodium pyruvate, penicillin/streptomycin, leukaemia inhibitory factor (Nacalai), 0.5 μM PD0325901 (WAKO), and 3 μM CHIR99021 (WAKO) on gelatin-coated plates.
Gene targeting in mouse ES cells
To generate conditional knock-in ES cells, cells were co-transfected with a targeting vector and a pX330 vector using Lipofectamine 2000 (Thermo Fisher Scientific). The targeting vector contained loxP-H3f3b intron1-H3.3 cDNA-loxP-H3f3b intron1-H3.3 (wild-type or K36M) cDNA-HA-FRT-IRES-Neo-FRT cassette flanked by 5ʹ and 3ʹ homology arms whose length are ~500 bp. The guide RNA from the pX330 vector targeted CAACAGGAGGCTAGCGAAGC, which is located at the junction of third intron and forth exon in H3f3b gene. After selection with 400 μg/mL G418, neomycin-resistant colonies were picked up for genotyping PCR, and ES cells with correct recombination were obtained. pX330 plasmid was a gift from Feng Zhang (Addgene plasmid # 42230) [Citation33].
Isolation of tibias for ChIP-seq
E14.5 embryos were collected by crossing H3f3bK36M-flox/K36M-flox andPrx1-Cre mice, and tibias were isolated under a microscope. Isolated tibias were trisected along the longitudinal axis and the tibial samples at the centre (tibial midshaft samples) were used for ChIP-seq. To obtain cell suspension, the samples were digested with collagenase (5 mg/mL collagenase (Wako, 034–10533) in 50% FBS and 50% Dulbecco’s modified Eagle medium (DMEM) at 37 °C for 30 min with gentle pipetting. Cells were then collected by centrifugation and lysed in nuclear isolation buffer (Sigma) for ChIP-seq library preparation. In parallel with the sample preparation for ChIP-seq, genotyping PCR was performed.
Immunostaining on cryosections of the embryonic tibias
Tibias were fixed in 4% paraformaldehyde for 2 h on ice. Subsequently, the samples were soaked in 15%, 20% and 30% sucrose in PBS at 4 °C with rotation, and they were embedded in Tissue-Tek O.C.T. Compound (SAKURA). 10 μm cryosections were made and immunostained with rabbit anti-HA (abcam, ab9110), rabbit anti-SOX9 (abcam ab185966, 1:2000), rabbit anti-H3K36me2 (Cell Signalling Technology #2901, 1:500), rabbit anti-H3K36me3 (Active motif #61,101, 1:500), and rabbit anti-H3K27me3 (Cell Signalling Technology #9733, 1:1000) antibodies.
Whole-mount skeletal staining
Whole-mount alizarin red and alcian blue staining was performed as described previously (Rigueur and Lyons, 2014).
Ultra-low-input native ChIP-seq (ULI-NChIP-seq)
ULI-NChIP-seq was performed as described previously with small modifications [Citation34]. After optimization of Micrococcal Nuclease digestion (New England Biolabs) (3 U/µL at 21 °C for 20 minutes), 8% volume of the tibia lysates were taken for input sample. The remaining lysates were split into thirds for chromatin immunoprecipitation with H3K36me2 (Cell Signalling Technology, #2901), H3K36me3 (Active Motif, #61101), and H3K27me3 (Diagenode, #C15410069) antibodies. Each antibody was diluted at 1:400 in 200 µL IP buffer (20 mM Tris-HCl pH8.0, 2 mM EDTA, 150 mM NaCl, 0.1% Triton X-100, and Protease inhibitor cocktail). Ethanol-precipitated DNA was used for library preparation using NEBnext Ultra II DNA Library Prep Kit (New England Biolabs). The samples for H3K36me2 and H3K36me3 were subjected to 12 cycles, and those for input and H3K27me3 were subjected to 9 cycles of PCR amplification by 2 x KAPA HiFi Hot Start DNA polymerase (Kapa Biosystems, KK2611). Single-end sequencing (68 cycles) was performed on a Hiseq 1500 at Kyushu University.
RNA-seq sample preparation
Isolated E14.5 tibias were trisected along the longitudinal axis and allocated to tibial end or midshaft samples. After washing with PBS, the samples were homogenized in 100 µL of nuclear isolation buffer on ice. mRNA was purified with Dynabeads mRNA DIRECT Micro Kit (Thermo Fisher Scientific). Elution of mRNA was performed with the buffer composed of first strand synthesis reaction buffer and random primer mix from NEBnext Ultra II Directional RNA library Prep Kit for Illumina (New England Biolabs). The eluates were processed for library preparation with NEBnext Ultra II Directional RNA library Prep Kit for Illumina. Adapter was 100-fold diluted, and all the samples were subjected to PCR amplification for 11 cycles by KAPA HiFi Hot Start ReadyMix (Kapa Biosystems, KK2611). Single-end sequencing (68 cycles) was performed on a Hiseq 1500 at Kyushu University.
Co-immunoprecipitation assay
E15.5 hindlimbs were harvested and homogenized in 200 µL of lysis buffer (20 mM Tris-HCl pH 7.5, 2 mM EGTA, 150 mM NaCl, 1 mM MgCl2, 1% Triton X-100, Protease inhibitor cocktail, and 200 units/mL Benzonase) on ice. After centrifugation at 10,000 g for 20 min at 4 °C, the supernatant was recovered and then precleared with Protein A/G-magnetic beads for 60 min at 4 °C. After taking 9% volume of the sample for input sample, the samples were subjected to immunoprecipitation with anti-HA antibody (abcam #9110, 1:200 dilution) at 4 °C for 90 min. Subsequently, prewashed Protein A/G-magnetic beads were added, and the samples were incubated at 4 °C for 60 min. The beads were washed three times with lysis buffer without Benzonase, resuspended in 20 µL of Laemmli sample buffer, and boiled at 98 °C for 10 min.
SDS-PAGE and western blotting
E16.5 bilateral tibias were harvested and homogenized in 50 µL of PBS. The homogenates were boiled at 98 °C for 10 min in Laemmli sample buffer. SDS-PAGE was conducted with 5–20% gradient gels (Nacalai tesque). For western blotting, proteins were transferred to polyvinylidene difluoride (PVDF) membranes with a wet-tank system. For immunoblotting of proteins with large molecular weight, proteins were transferred at 17 V for 16 h at 4 °C. After blocking with 5% skim milk in Tris-buffered saline (TBS), immnoblotting was performed with primary and secondary antibodies diluted in Can Get Signal solution 1 and solution 2 (TOYOBO), respectively. Antibodies used are rat anti-H3.3 (Cosmo Bio #CE-040B, 1:1000), mouse anti-HA (Covance clone 16B12, 1:1000), mouse anti-H3K36me2 (Diagenode #C15200182, 1:1000), rabbit anti-H3K36me3 (Active motif #61101, 1:1000), rabbit anti-H3K27me3 (Diagenode #C15410069, 1:1000), rabbit anti-NSD1 (LifeSpan #LS-C668873-50, 1:1000), mouse anti-NSD2 (Abcam #ab75359, 1:1000), rabbit anti-SETD2 (Bioworld Technology #BS7519, 1:1000), and mouse anti-β-actin (Santa Cruz Biotechnology #sc-69879, 1:4000).
ChIP-seq data processing
Trimming and mapping
ChIP-seq single-end reads were aligned to the mouse genome (mm10) using Bowtie2 (version 2.3.5.1) [Citation35] with a default setting after removing adaptor sequences and low-quality reads by Trim Galore! (version 0.3.3, Babraham Institute). Reads from PCR duplicates were removed by using Samtools ‘markdup’ with an option ‘-r’. After confirming reproducibility between replicates, they were merged by using ‘divide_bam.py’ in RSeQC [Citation36] and Samtools [Citation37] ‘merge’ so that each replicate data contributes equally to the merged file.
Scatter plots and heatmaps
The mouse genome (mm10) was divided into 10-kb bins in a sliding window of 5 kb. The number of ChIP and input reads covering each bin was calculated by using Bedtools (version 2.27.0) [Citation38] intersect with an option ‘-c’. The bins containing at least 100 reads in input samples were used for analyses. To compute fold enrichment, normalized ChIP read counts was divided by normalized input read counts. Heatmaps were depicted using computeMatrix and plotHeatmap in deepTools (version 3.1.3) [Citation39] for autosomal genes whose length are longer than a calculating bin size (100-base). To minimize the sex-specific effects, our analysis focused on autosomes. Public ChIP-seq data by Lu et al. were utilized to investigate the distribution of H3.3K36M [Citation10]. For enhancer analyses, we used the dataset for putative enhancers in E14.5 mouse limb [Citation21].
RNA-seq data analysis
RNA-seq reads were aligned to the mouse genome (mm10) using Hisat2 (version 2.1.0) [Citation40] with options ‘--rna-strandness R’ and ‘--dta’ after removing adaptor sequences and low-quality reads by Trim Galore! with an option ‘-q 30’. Reads aligned to ribosomal DNA were eliminated by using Bedtools intersect with an option ‘-v’. Assembly and quantification of transcripts were performed by StringTie (version1.3.4d) (Pertea et al., 2015) with options ‘-e’ and ‘-B’, followed by extraction of differentially expressed genes with DEseq2 (version 1.22) [Citation41]. DEseq2 was also used for principal component analysis and computation of Euclidean distance between samples.
Quantification and statistical analysis
Data are presented as mean and SD All replicates showed similar results and representative results are shown. Graphic representation of data as well as all statistical tests were done with R software (version 3.5.1). P-value < 0.05 was considered statistically significant.
Author contributions
Conceptualization, T.I.; Investigation, S.A., H.N., and T.I.; Formal Analysis, S.A.; Writing – Original Draft, S.A.; Writing – Review & Editing, T.I.; Supervision, T.I. and H.S.; Funding Acquisition, T.I. and H.S.
Supplemental Material
Download Zip (3.1 MB)Acknowledgments
We thank the members of our laboratory and common research facilities of Medical Institute of Bioregulation, Kyushu University, for technical assistance and Eriko Sumiya for valuable comments on the manuscript.
Disclosure statement
The authors declare no competing or financial interests.
Data availability statement
All high-throughput sequencing data have been deposited in the Gene Expression Omnibus (GEO) under the accession number GSE150352 for RNA-seq data of E14.5 tibial ends and midshafts; and GSE150353 for ChIP-seq data of E14.5 tibial midshafts.
Supplementary material
Supplemental data for this article can be accessed here.
Additional information
Funding
References
- Ono N, Ono W, Nagasawa T, et al. A subset of chondrogenic cells provides early mesenchymal progenitors in growing bones. Nat Cell Biol. 2014;16(12):1157–1167.
- Yang L, Tsang KY, Tang HC, et al. Hypertrophic chondrocytes can become osteoblasts and osteocytes in endochondral bone formation. Proc Natl Acad Sci U S A. 2014;111:12097–12102.
- Zhou X, von der Mark K, Henry S, et al. Chondrocytes transdifferentiate into osteoblasts in endochondral bone during development, postnatal growth and fracture healing in mice. PLoS Genet. 2014;10:e1004820.
- Kozhemyakina E, Lassar AB, Zelzer E. A pathway to bone: signaling molecules and transcription factors involved in chondrocyte development and maturation. Development. 2015;142:817–831.
- Schwartzentruber J, Korshunov A, Liu XY, et al. Driver mutations in histone H3.3 and chromatin remodelling genes in paediatric glioblastoma. Nature. 2012;482:226–231.
- Maze I, Noh KM, Soshnev AA, et al. Every amino acid matters: essential contributions of histone variants to mammalian development and disease. Nat Rev Genet. 2014;15:259–271.
- Nacev BA, Feng L, Bagert JD, et al. The expanding landscape of ‘oncohistone’ mutations in human cancers. Nature. 2019;567:473–478.
- Behjati S, Tarpey PS, Presneau N, et al. Distinct H3F3A and H3F3B driver mutations define chondroblastoma and giant cell tumor of bone. Nat Genet. 2013;45:1479–1482.
- Fang D, Gan H, Lee JH, et al. The histone H3.3K36M mutation reprograms the epigenome of chondroblastomas. Science. 2016;352:1344–1348.
- Lu C, Jain SU, Hoelper D, et al. Histone H3K36 mutations promote sarcomagenesis through altered histone methylation landscape. Science. 2016;352:844–849.
- Yang S, Zheng X, Lu C, et al. Molecular basis for oncohistone H3 recognition by SETD2 methyltransferase. Genes Dev. 2016;30:1611–1616.
- Schmitges FW, Prusty AB, Faty M, et al. Histone methylation by PRC2 is inhibited by active chromatin marks. Mol Cell. 2011;42:330–341.
- Streubel G, Watson A, Jammula SG, et al. The H3K36me2 methyltransferase Nsd1 demarcates PRC2-mediated H3K27me2 and H3K27me3 domains in embryonic stem cells. Mol Cell. 2018;70:371–379 e375.
- Sakai K, Miyazaki J. A transgenic mouse line that retains Cre recombinase activity in mature oocytes irrespective of the cre transgene transmission. Biochem Biophys Res Commun. 1997;237:318–324.
- Chen W, DiFrancesco LM. Chondroblastoma: an update. Arch Pathol Lab Med. 2017;141:867–871.
- Logan M, Martin JF, Nagy A, et al. Expression of cre recombinase in the developing mouse limb bud driven by a Prxl enhancer. Genesis. 2002;33:77–80.
- Jin H, Kasper LH, Larson JD, et al. ChIPseqSpikeInFree: a ChIP-seq normalization approach to reveal global changes in histone modifications without spike-in. Bioinformatics. 2020;36:1270–1272.
- Bracken AP, Dietrich N, Pasini D, et al. Genome-wide mapping of Polycomb target genes unravels their roles in cell fate transitions. Genes Dev. 2006;20:1123–1136.
- Zenk F, Loeser E, Schiavo R, et al. Germ line-inherited H3K27me3 restricts enhancer function during maternal-to-zygotic transition. Science. 2017;357:212–216.
- Cruz-Molina S, Respuela P, Tebartz C, et al. PRC2 facilitates the regulatory topology required for poised enhancer function during pluripotent stem cell differentiation. Cell Stem Cell. 2017;20:689–705 e689.
- Shen Y, Yue F, McCleary DF, et al. A map of the cis-regulatory sequences in the mouse genome. Nature. 2012;488:116–120.
- Suomi S, Taipaleenmaki H, Seppanen A, et al. MicroRNAs regulate osteogenesis and chondrogenesis of mouse bone marrow stromal cells. Gene Regul Syst Bio. 2008;2:177–191.
- Watanabe T, Sato T, Amano T, et al. Dnm3os, a non-coding RNA, is required for normal growth and skeletal development in mice. Dev Dyn. 2008;237:3738–3748.
- Mirzamohammadi F, Papaioannou G, Kobayashi T. MicroRNAs in cartilage development, homeostasis, and disease. Curr Osteoporos Rep. 2014;12:410–419.
- Roberto VP, Gavaia P, Nunes MJ, et al. Evidences for a new role of miR-214 in chondrogenesis. Sci Rep. 2018;8:3704.
- Qin L, Beier F. EGFR signaling: friend or foe for cartilage? JBMR Plus. 2019;3:e10177.
- Yamamoto S, Uchida Y, Ohtani T, et al. Hoxa13 regulates expression of common Hox target genes involved in cartilage development to coordinate the expansion of the autopodal anlage. Dev Growth Differ. 2019;61:228–251.
- Wellik DM, Capecchi MR. Hox10 and Hox11 genes are required to globally pattern the mammalian skeleton. Science. 2003;301:363–367.
- Mirzamohammadi F, Papaioannou G, Inloes JB, et al. Polycomb repressive complex 2 regulates skeletal growth by suppressing Wnt and TGF-beta signalling. Nat Commun. 2016;7:12047.
- Massip L, Ectors F, Deprez P, et al. Expression of Hoxa2 in cells entering chondrogenesis impairs overall cartilage development. Differentiation. 2007;75:256–267.
- Li Y, Trojer P, Xu C-F, et al. The target of the NSD family of histone lysine methyltransferases depends on the nature of the substrate. J Biol Chem. 2009;49:34283–34295.
- Zhuang L, Jang Y, Park YK, et al. Depletion of Nsd2-mediated histone H3K36 methylation impairs adipose tissue development and function. Nat Commun. 2018;9:1796.
- Cong L, Ran FA, Cox D, et al. Multiplex genome engineering using CRISPR/Cas systems. Science. 2013;339:819–823.
- Brind’Amour J, Liu S, Hudson M, et al. An ultra-low-input native ChIP-seq protocol for genome-wide profiling of rare cell populations. Nat Commun. 2015;6:6033.
- Langmead B, Salzberg SL. Fast gapped-read alignment with Bowtie 2. Nat Methods. 2012;9:357–359.
- Wang L, Wang S, Li W. RSeQC: quality control of RNA-seq experiments. Bioinformatics. 2012;28:2184–2185.
- Li H, Handsaker B, Wysoker A, et al., Genome Project Data Processing, S. The sequence alignment/map format and SAMtools. Bioinformatic. 2009;25:2078–2079.
- Quinlan AR, Hall IM. BEDTools: a flexible suite of utilities for comparing genomic features. Bioinformatics. 2010;26:841–842.
- Ramirez F, Ryan DP, Gruning B, et al. deepTools2: a next generation web server for deep-sequencing data analysis. Nucleic Acids Res. 2016;44:W160–165.
- Kim D, Langmead B, Salzberg SL. HISAT: a fast spliced aligner with low memory requirements. Nat Methods. 2015;12:357–360.
- Love MI, Huber W, Anders S. Moderated estimation of fold change and dispersion for RNA-seq data with DESeq2. Genome Biol. 2014;15:550.