
 ?Mathematical formulae have been encoded as MathML and are displayed in this HTML version using MathJax in order to improve their display. Uncheck the box to turn MathJax off. This feature requires Javascript. Click on a formula to zoom.
ABSTRACT
Mortality assessments are conducted for both civil and commercial purposes. Recent advances in epigenetics have resulted in DNA methylation tools to assess risk and aid in this task. However, widely available array-based algorithms are not readily translatable into clinical tools and do not provide a good foundation for clinical recommendations. Further, recent work shows evidence of heritability and possible racial bias in these indices. Using a publicly available array data set, the Framingham Heart Study (FHS), we develop and test a five-locus mortality-risk algorithm using only previously validated methylation biomarkers that have been shown to be free of racial bias, and that provide specific assessments of smoking, alcohol consumption, diabetes and heart disease. We show that a model using age, sex and methylation measurements at these five loci outperforms the 513 probe Levine index and approximates the predictive power of the 1030 probe GrimAge index. We then show each of the five loci in our algorithm can be assessed using a more powerful, reference-free digital PCR approach, further demonstrating that it is readily clinically translatable. Finally, we show the loci do not reflect ethnically specific variation. We conclude that this algorithm is a simple, yet powerful tool for assessing mortality risk. We further suggest that the output from this or similarly derived algorithms using either array or digital PCR can be used to provide powerful feedback to patients, guide recommendations for additional medical assessments, and help monitor the effect of public health prevention interventions.
Introduction
Accurate and simple assessment of risk for mortality is relevant for a wide variety of professionals including physicians, insurance underwriters and public health data analysts. The approaches used to assess risk vary widely, however, with respect to the setting. For example, in the acute care setting, physicians commonly use algorithms such as Acute Physiology, Age and Chronic Health Evaluation (I–IV) (APACHE), Multi-Organ Dysfunction Syndrome (MODS) or Sequential Organ Failure Assessment (SOFA) that rely on physiological variables such as serum potassium levels, haematocrit and oxygen saturation for predicting mortality [Citation1]. In general, since the input variables for these prediction algorithms can change rapidly, and the output from these algorithms can be used to make critical life or death decisions, there is an intense need for quick accurate predictions from these and similar algorithms. In contrast, insurance underwriters and public health analysts work in a context that has a lower need for speed. Still, the need for accuracy is high, and pressures to reduce cost and potential patient burden are substantial. For example, tracking the population-level impact of public health initiatives is difficult but important for guiding future investments. Similarly, erroneous assessments of morbid risk in high-value policies can have substantial financial consequences. Additionally, in both public health and insurance decision-making, a successful future may involve moving beyond a one size fits all approach premised on the law of large numbers. The need for personalization of offerings and the ability of the risk tool to assess continuously helps consumer centrism. Therefore, no matter what the setting, there is high demand for accuracy in mortality prediction, with minimizing burden on consumers an important secondary consideration.
In addition to the demand for accuracy and low participant burden, there are often cost and speed considerations when choosing a method for assessing mortality. For research purposes, speed of assessment is generally not an issue, but cost may be a major consideration. For life insurance, both cost and speed may need to be considered [Citation2]. For example, for a low face value term life insurance policy (e.g. 75,000 USD), the financial cost of a face-to-face physical exam of a random 30 year-old would likely outweigh the potential information gained by that assessment. Conversely, when the stakes are higher (e.g. 10,000,000 USD) and the applicant is older, the calculus is reversed and extensive medical exams are universally employed [Citation2]. Speed is also an issue to insurers. Delayed time service between the initial client inquiry and the quote by an insurer, leads to lower placement rates. As a result of these and other trade-offs, finding solutions that are quick, evidence-based, personalized, objective, and continuous has become the aim of disruptive insurers; there is a great deal of interest in challenging the existing approaches which are more lengthy, anecdotal, generalized, subjective, and discrete in their scope. Improved accuracy, reduced participant burden, reduced costs, and increased speed of risk assessment are the value propositions.
Recently, approaches for assessing mortality that incorporate epigenetic measures have attracted considerable attention. Beginning with the work of Fraga and Esteller in 2007, and Bocklandt and associates in 2011, a number of investigators have attempted to use epigenetic approaches to assess age or risk for mortality [Citation3,Citation4]. In 2013, groups led by Greg Hannum and Steve Horvath were the first to use stepwise regression methods and methylation information from the Illumina 450 K array to impute relative age [Citation5,Citation6]. Over the subsequent years, “epigenetic ageing’ (EA) indices that built upon these methods have been described and, not surprisingly, there is a good deal of debate as to which index is most accurate [Citation7–9]. Given the continued interest and the introduction of the Illumina Epic array, which nearly doubles the amount of available methylation information, it is likely that this debate will continue and that further improvements to epigenetic clocks will be made. A major advantage of EA indices is that they have low participant burden and require only a small volume of blood or saliva.
Still, no matter which epigenetic index is used, there are several limitations that have impeded the use of genome-wide arrays for routine imputation of mortality risk in medical, public health, or insurance settings. The first is price. Methylation arrays are costly and the data derived from them must undergo extensive bioinformatic processing before it can be utilized[Citation10]. The second is speed. The complicated laboratory procedures used in genome-wide hybridizations typically take a full week of laboratory time to complete. The third limitation is scaling. Arrays must be run in groups referred to as ‘batches’. Although kits for smaller sets of samples exist, the standard batch size for Illumina arrays is 96 samples (which generally includes two controls). If one has more than 94 samples, those samples must be run in a separate group. The fourth limitation is less obvious. The extraordinarily complex data processing approach used to infer methylation levels utilizes both intra- and inter-sample normalization[Citation11]. In layman’s terms, this means that to a certain extent, the methylation value derived for one locus is dependent on values of rest of the loci for that sample and to methylation values in other samples. Although the sum of these effects are generally small, they can be substantial with methylation differences of up to 10% being frequently observed in technical replicates from the same laboratory[Citation11].
A final limitation for the use of these array in mortality prediction is less discussed, but potentially more important from the standpoint of accurately identifying causes and protecting against discrimination; many of the probes on these ‘epigenetic’ arrays also implicitly convey significant amounts of genetic information [Citation12–14]. The global regulatory landscape in the insurance industry has, in large part, leaned away from the use of such personal identifying genetic information for decision-making. In previous work, we and others have shown that it is possible to generate tens of thousands of genotypes from these arrays and that the information can be used to define ethnicity [Citation13,Citation14]. In addition to raising privacy issues, the inclusion of loci linked to ethnic background could lead to race-linked bias in array-based EA algorithms. That bias can lead to biased decision-making in the clinical, public health and insurance industries – clearly both disenfranchising and reputationally catastrophic. Two of the leading algorithms, the Levine PhenoAge Index (h2 = 0.51) and the recently introduced GrimAge index (h2 = 0.37) have significant heritability [Citation9,Citation15]. In previous work, we have shown that some of the 513 sites used in the Levine PhenoAge Index can be used to predict ancestry and that this may result in bias that interferes with risk prediction in African American subjects [Citation16]. Whether this is true for other indices is not known and we note that the 1030 probes used in the GrimAge index has not been publicly disclosed[Citation15]. As a result of these and other limitations, methylation arrays have not gained traction as tools for assessing mortality risk outside of research settings.
Understanding the conceptual framework through which these array-based indices predict age or mortality is critical to understanding on how improvements on this approach could be made. The initial indices by Horvath and Hannum were designed to predict age. [Citation5,Citation6] These indices were formed by first conducting progression analyses of genome-wide methylation data from large informative cohorts to identify loci in which age-dependent epigenetic drift [Citation17] in DNA methylation reliably occur [Citation3,Citation17,Citation18]. Overall, tens of thousands of loci mapping to a wide variety of pathways show age-related changes in methylation[Citation19]. Then, LASSO or some similar technique is used to remove colinear sites and identify the least redundant set of markers capable of accurately predicting age. Building on work linking specific changes in DNA methylation to disease processes, the majority of subsequent indices adjusted this approach to derive measures capable of predicting mortality by comparing the actual age to the computed methylation age with the difference being termed ‘age acceleration’. [Citation8,Citation9,Citation15] The strengths of this approach include the ability to incorporate data from literally hundreds of existing databases, some of which are very well characterized for specific conditions. Weaknesses include significant variation in the quality of outcome assessments and access to healthcare among cohorts, the latter of which is well known to have prominent effects on mortality. Nevertheless, useful estimates of general risk for cardiac disease and smoking status have been produced, particularly by the Grim Age index[Citation15].
Fortunately, there are alternative approaches to the stepwise regression methods for generating methylation indices for mortality risk. One of these is by developing and then compiling individual mortality index markers from important, yet discrete environmental exposure or disease processes then combining this disease-specific information with age and sex. This focused approach takes advantage of the fact that age and sex are traditionally the strongest predictors of mortality and are readily available pieces of data in almost any situation. As such, there is little value in trying to independently impute them. In this vein, our group initially approached using DNA methylation as a tool to predict cigarette and alcohol consumption status[Citation20]. To date, this approach has been highly successful and has led to the production of clinically implementable DNA methylation assays for both cigarette and alcohol consumption with the cg05575921 marker for smoking being perhaps the most replicated finding in clinical epigenetics with over 100 PubMed publications replicating or extending these findings [Citation21–23]. The indices that can be constructed using these limited marker sets with age and sex information are powerful. A simple combination of cg05575921 along with cg04987734, a marker from a four marker alcohol prediction panel, outperforms the Levine index with respect to predicting mortality in the Framingham Heart Study (FHS) Offspring population[Citation24]. To a certain extent, the greater predictive ability of this simple index makes sense because smoking and drinking are important contributors to morbid risk for many of the top 10 causes of death such as cancer and heart disease. Still, it is important to note that a portion of the variance in FHS mortality predicted by these methods are not completely overlapping and a substantial portion of the variance remains unexplained.
We hypothesized that some of the unexplained variance in mortality was secondary to the effects of other disease processes that may be partially independent of substance use, such as diabetes. Fortunately, over the past several years, at least three groups have published genome-wide methylation analyses of Type 2 diabetes mellitus (T2DM) and have shown that methylation status at cg19393031, a CpG site in the 5’ untranslated region (UTR) of TXNIP, is a strong predictor of future T2DM, current T2DM and haemoglobin A1c levels [Citation25–27]. Hence, reliable predictors of diabetes status are readily available.
Despite the success for diabetes, improving mortality prediction by identifying additional loci predictive of common environmental drivers or disease processes has proven difficult. In part, this is due to the genetic confounding of methylation signals and the co-linearity of methylation signatures makes identification of sensitive, yet specific epigenetic signals for discrete disorders with more complex, multifactorial aetiologies difficult[Citation28]. Fortunately, for the former, machine learning approaches may be of help[Citation29]. Although in some ways less intuitive or elegant than the more traditional stepwise approaches, these new artificial intelligence-guided methods are generally more powerful in prediction than classical statistical approaches analysing smaller datasets and may be the only viable approach for identifying predictive markers from large integrated genetic and epigenetic datasets for highly dimensional syndromes [Citation29,Citation30]. These methods automatically handle colinear variables and all types of non-linear relationships (e.g., interactions, variables taken to a power), and there are powerful variable selection methods that have been developed[Citation31].
Using these machine learning approaches to interrogate genome-wide epigenetic and genetic data from the FHS and DNA from Intermountain (IM) Healthcare, we identified and validated a marker set that included three epigenetic loci for risk for incident Myocardial Infarction (MI), and then described their translation to dPCR [Citation32–34]. The resulting marker sets outperformed current blood-based methods such as the Framingham Risk Score or the Atherosclerotic Cardiovascular Disease Risk Estimator for predicting risk for incident Coronary Artery Disease (CAD) in the IM and FHS test sets. Critically, each of the methylation markers in the predictor set mapped differently to the clinical risk factors (e.g. smoking, hypertension, or diabetes) for CAD. Serendipitously, this also creates a set of markers that can be used to capture the additional variance for mortality not already captured by cg05575921 and cg04987734.
In this communication, after applying the machine learning approaches, we use conventional survival analysis to test whether the addition of an additional alcohol marker (cg02583484) from our previously published panel [Citation22], and both the CAD and T2DM-specific marker information improves prediction of our current model [Citation24] relative to existing EA models. Then, we explore the translatability of the array-based assessments to more generally implementable dPCR methods.
Methods
The current communication relies on information data derived from three separate studies. The first set of data are from the Framingham Heart Study Offspring Cohort. A complete description of the FHS Offspring Cohort is available elsewhere [Citation35]. All procedures and protocols used for the use of FHS data were approved by the University of Iowa Institutional Review Board (IRB 201503802). After review and approval of the planned study procedures by the National Heart, Lung, and Blood Institute Data Access Committee, the data for this study were downloaded from dbGAP (https://dbgap.ncbi.nlm.nih.gov).
A second set of clinical and methylation information were drawn from the Family and Community Health Studies (FACHS) Primary Caretaker (PC) cohort. The FACHS PC cohort is the adult component in a longitudinal study begun in 1997 of the effects of psychosocial factors on health-related outcomes of 889 African American parent–child dyads [Citation36]. The current biological and clinical data, whose collection and preparation have been described elsewhere, are taken from Wave 5 of the FACHS PC study (2008–2010) [Citation16]. All procedures in the FACHS study were approved by the University of Iowa IRB (IRB 200802719).
A third and final set of clinical and methylation data were taken from the Healthy Iowans Study, a longitudinal investigation of the development of smoking and smoking-related health behaviours in high school sophomores [Citation37]. The clinical and biological data used in this study were taken from their intake examination. All procedures in the Healthy Iowans Study were approved by the University of Iowa IRB (IRB 201409705).
DNA methylation data
The preparation of data from 2256 FHS Offspring Cohort subjects used in this study have been described elsewhere [Citation16,Citation28]. After downloading, the genome-wide methylation data (Infinium Methylation450 BeadChip (Illumina, San Diego, CA)) from 2,567 individuals of the Offspring Cohort who participated in the Framingham Offspring 8th exam (2005 to 2008) were extracted and then were subjected to DASEN normalization using the MethyLumi, WateRmelon, and IlluminaHumanMethylation450k.db R packages[Citation38]. These data were filtered with individual CpG sites being removed if they had a bead count of <3 and/or >1%, and samples were removed if they had a detection p-value >0.05. [Citation38] After removal of those participants for whom either acceptable genome-wide epigenetic was not available, data for 2295 participants remained. The same quality control steps were used to prepare the HumanMethylationEPIC 850 BeadChip (Illumina, San Diego, CA) methylation data obtained using DNA from the Wave 5 FACHS PC subjects. The methylation values for cg05575921, cg04987734, cg02583484, cg19693031 and cg00300879 were then extracted from both datasets.
Clinical data
Clinical data from the FHS for this study were extracted from the Wave 8 examinations of the cohort [Citation39]. These data include: age, sex, date of death (for 289 participants with death certificates) and dates of assessment for those who participated in Wave 9. The data from those 17 subjects whose death status was unknown and who did not participate in Wave 9 analyses were excluded from the analyses.
Similarly, for the FACHS PC and Healthy Iowan studies, age, gender, body mass index (BMI), and where indicated Haemoglobin A1c (HbA1c) values were extracted from their respective databases.
Survival analyses
Comparisons of the predictive capacity of the marker approaches () in the FHS were conducted using survival models, namely Cox proportional hazards regression [Citation40]. For the reader unfamiliar with Cox proportional hazard models, they are expected risk functions that take the form of:
Table 1. Key demographic and clinical characteristics of participants
Table 2. Model fit statistics assessing methylation-mortality association
Where is the expected hazard (or death rate) at time
,
is the rate when all predictors (age, methylation, etc.) are zero,
,, etc. are the baseline values for each of the predictors, and
,
, etc. are the parameter estimates for each of those individual predictors from which the hazard ratios are calculated.
The event of interest in the Cox regression models is mortality and each individual either experiences the event or is censored during the follow-up period. In our models, we examine the association of age, sex, and the methylation markers with time to all-cause mortality. The time metric was days from the Wave 8 visit (time 0) to death (all causes) or censoring (87% of samples were censored). All the predictors in the proportional hazards models were measured at the time 0 baseline of the Wave 8 visit. Predictors were first considered individually in models and then together in a series of multivariate models with different numbers of predictors, as described below. Harrell’s C was used to index the overall prediction accuracy of each model and pseudo R2 was used to quantify the strength of association of the model predictors with time to death [Citation41,Citation42]. Akaike’s Information Criterion (AIC) was used to assess overall model fit [Citation43]. In the base model (Model 1), only age and gender were used to predict all-cause mortality. Next, we added the Illumina array methylation values for cg05575921, cg04987734, and cg02583484 to re-create our previously described Model 2 [Citation24]. Then we added, separately then together, the array values for cg00300879 and cg19693031 to Model 2, which allowed us to examine changes in prediction accuracy and strength of association with time to death.
In Model 6 we used Levine’s PhenoAge, calculated as previously described as the predictor. We then added its values to Model 1 to create Model 7. In Model 8, we used GrimAge, calculated as described by Lu et al. using the proprietary UCLA website (http://www.dnamage.genetics.ucla.edu/) as the predictor. Finally, we then added it to the base model to create Model 9.
Internal validation of the models for the top CAD and diabetes makers in the FHS was accomplished through a resampling method using 200 bootstrap samples [Citation44]. The model was refit and tested against the observed sample to obtain an estimate of the predictive accuracy as measured by a comparison of average Harrell’s C values for the training and test datasets. Through resampling a shrinkage factor is also estimated to account for potential overfitting. All analyses were conducted using R Version 4.0.2.
Digital PCR
Digital PCR (dPCR) assessments of cg05575921, cg04987734, cg02583484, cg19693031 and cg00300879 methylation in DNA specimens from the FACHS and Healthy Iowans studies were conducted as previously described [Citation21,Citation22]. In brief, 1 µg of whole blood DNA from each subject was bisulphite converted using an Epitect Fast 96 Bisulphite Conversion kit (Qiagen, USA) and eluted in 70 µl of buffer. A 3 µl aliquot of the eluate was then pre-amped, diluted 1:1500 or 1:3000, then amplified using primer and probe reagent sets from Behavioural Diagnostics (Coralville, IA), Cardio Diagnostics (Coralville, IA) and Universal Digital PCR reagents and protocols from Bio-Rad (Carlsbad, CA). The number of droplets containing a ‘C’ allele (representing a methylated cytosine residue), a ‘T’ allele (representing an unmethylated cytosine), at least one ‘C’ and “T’ allele, or no amplified alleles was determined using a QX-200 droplet counter and Quantisoft Software (Bio-Rad, CA).
Analyses of dPCR data were conducted using JMP Version 14 (SAS Institute) using the tests outlined in the text. All T-tests were corrected for multiple comparisons using the method of Bonferroni [Citation45].
Results
describes the demographic and clinical characteristics of the FHS relevant to the current analyses. In brief, at the time of the Wave 8 examinations in 2008–2010, the cohort was exclusively White and slightly more females (55%) than males (45%). The rate of current self-and past reported smoking is 8% and 9%, respectively. The rate of self-reported diabetes is 12% with the average haemoglobin A1c level, a diagnostic marker for diabetes, being 5.7%. Finally, the rate of physician assessed CAD in the FHS, which is a population specifically garnered for the study of CAD, is 14.3%.
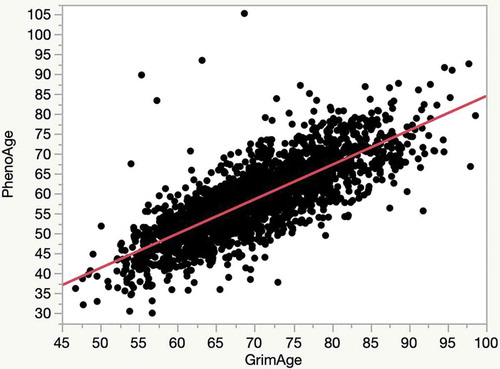
Two indices of EA, PhenoAge and GrimAge were calculated for each of the FHS subjects. Interestingly, the average PhenoAge for cohort is 7 years less than the chronological age while the average GrimAge is 5 years greater than the average chronological age. Despite that, the PhenoAge and the GrimAge are highly correlated with each other (R2 = 0.62; ).
Figure 1. A plot of the relationship of the relationship of the PhenoAge to GrimAge in the FHS cohort (R2 = 0.62)
In the first set of analyses, a series of survival models were fit to examine the association of smoking, alcohol, heart disease (CAD), and diabetes methylation markers with mortality. As the first step of these analyses, we began with our previously reported base model of age, sex, the smoking marker (cg05575921), and the alcohol consumption markers (cg04987734 and cg02583484). We subsequently added the lead CAD marker (cg00300879), then the diabetes marker (cg19693031) to the base model, one at a time. Harrell’s C was used to index the prediction accuracy of each model, pseudo R2 was used to quantify the strength of association of the model predictors with time to death, and Akaike’s Information Criterion (AIC) was used to assess overall model fit.
displays the results for the base model and the models with each CAD/diabetes marker added individually. Both cg00300879 and cg19693031 increase Harrell’s C and pseudo R2 and have decreased in AIC of >2, indicating improved fit over the base model. Validation of the models for these two makers was accomplished through a resampling method using 200 bootstrap samples (). The model was refit and tested against the observed sample to obtain an estimate of the predictive accuracy. The training and test estimates are similar as can be seen in the low optimism values. That is, the corrected values for Harrell’s C are nearly identical to the original values while the shrinkage coefficients of >0.96 are a sign of good model fit. The model with the proposed Mortality Index, one methylation marker from each domain (smoking, alcohol, CAD, and diabetes) along with age and sex, is presented in row 8 of and has the best fit of Models 1–5.
lists the hazard ratio estimates for all predictors in Model 5. In this model, age and sex are highly predictive of time to death after adjustment for the other predictors (age HR = 2.58, 95% CI = 2.26–2.95; M vs. F HR = 1.38, 95% CI = 1.09–1.74). Baseline fractional methylation levels are highly predictive as well. Lower levels in baseline fractional methylation at cg05575921 cg02583484, cg00300879, and cg19693031 and higher levels in baseline fractional methylation at cg04987734 result in an increased risk of mortality.
Table 3. Hazard ratio estimates for Model 5
The second set of analyses examined the Levine epigenetic age and Lu and colleagues GrimAge age indices for predicting mortality. Models 6 and 7 with epigenetic age and Models 8 and 9 with GrimAge are presented in the last four rows of . Using the Illumina array data, the five marker Mortality Index, Model 5, has better fit than either of the PhenoAge models but falls short of the performance of GrimAge in Models 8 and 9. Nevertheless, Harrell’s C and pseudo-R2 were not much smaller for Model 5, thus an argument of parsimony could support the choice of Model 5 over Model 8 or 9.
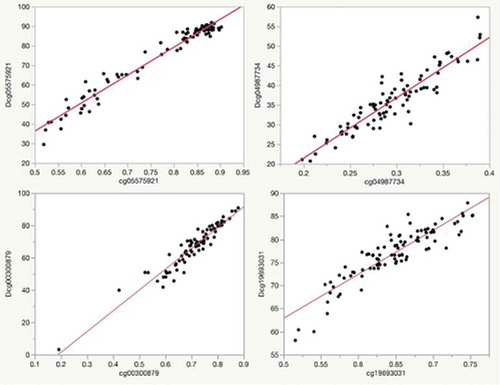
We believe that an important attribute of the five-marker approach relative to the much longer alternative EA measures, is the capacity to translate assays into highly sensitive dPCR assays that can be performed in most well-equipped molecular biology laboratories at low cost, providing rapid feedback. To illustrate this translation, we measured dPCR values for each of these loci in DNA contributed by 92 African American subjects from the Family and Community Health Studies (FACHS) for whom we have both genome-wide methylation data and substantial medical information including history of CAD, diabetes and HbA1c values. illustrates the relationship between the methylation values for four of these makers as assessed by the Illumina array and via dPCR in this middle-aged African American subjects from the Family and Community Health Studies (FACHS). The range for the digital values (expressed as %) was greater than for array values (expressed as fractional methylation) at each of the five loci cg055759219 (92% to 30% vs 0.90 to 0.52), cg04987734 (57% to 21% vs 0.39 to 0.20), cg02583484 (38 to 13% vs 0.34 to 0.18), cg19693031 (88% to 58% vs 0.75 to 0.52) and cg00300879 (91% to 3% vs 0.88 to 0.20) (see ). Still, the correlation between the array and the dPCR was excellent with R2 for each of the five markers being 0.96, 0.93, 0.85, 0.90 and 0.95, respectively.
Figure 2. Plots of the relationship of Illumina array methylation values (x-axis) to that of digital PCR values (y-axis) for each of the markers in the predictor set for the subjects in the FACHS study. The R2 for each of the correlations with their corresponding Illumina probe values is: Dcg05575921, 0.96; Dcg04987734, 0.93; Dcg19693031, 0.90; Dcg00300879, 0.95
In a previous study, we showed that the methylation values at many of the loci used in the PhenoAge index are correlated with ethnicity. To determine whether our dPCR assessments unintentionally tag ethnic-specific genetic effects that could confound epigenetic predictions, we compared the set points of cg05575921, cg04987734, cg02583484, cg19693031 and cg00300879 in 92 samples of DNA collected from 16-year-old subjects (45 African American and 45 White) who participated in Healthy Iowa Study (See ). This project enrolled high school sophomores from the Iowa City region and followed them for 2 years in the hopes of understanding peer and family influences on smoking initiation. Although matched in age, the African American students were significantly more obese than the White students (24.4 ± 4.7ve 22.3 ± 3.2, p < 0.0001). Critically, at the time of the blood draw, none of these 16-year-old subjects reported the consumption of more than 100 cigarettes, the presence of diabetes, chronic heavy alcohol consumption nor heart disease. After standard Bonferroni correction, there were no significant difference at any of the five loci included in the index.
Table 4. Internal validation: bootstrap results
Table 5. Demographic characteristics and digital PCR methylation values for the adults subjects from the family and community health study subjects
Table 6. Demographic and digital PCR methylation values for adolescents from the health iowa study
Discussion
The FHS Offspring Cohort is a valuable testing ground for the development of new prediction algorithms that has been used by hundreds of groups to better understand factors affecting important health outcomes. Arguably, one of the most important of these health outcomes is death. The current results suggest that addition of three methylation markers predictive of alcohol, CAD and diabetes, to an existing two marker panel conveys additional prediction with respect to mortality. Still, before discussing the implications of the findings, it should be noted that the FHS subjects are all White and >95% of whom are over the age of 50. Examination of the performance of the current algorithm in other data sets, particularly those including other ethnicities, will be needed before implementation of this or similar approaches should proceed.
The primary finding from this study is that the addition of information from a disease-specific index to a more general algorithm of environmental exposures and disease-specific biomarkers significantly improves the mortality prediction. The demonstration of the admittedly incremental increase over our prior communications is important because it highlights a pathway through which additional risk prediction can be generated and translated for routine implementation in healthcare, underwriting and public health.
To better understand how this approach can lead to an improved index, it is essential to understand the differences in the way conventional array-based ‘accelerated aging’ indices and the current index are constructed. In brief, array-based ‘epigenetic aging’ approaches for predicting mortality rely on large panels of markers generated through sequential addition of probes via various forms of penalized regression such as elastic net or lasso [Citation5,Citation6,Citation46]. The clinical datasets used to train these algorithms vary with the DNA PhenoAge and GrimAge both including the FHS as a prominent portion of their training data. Because smoking and drinking are risk factors for at least 8 of the top 10 common causes of death in the United States, it is not surprising to find that these algorithms that are developed and trained using mostly White, American general population samples load heavily on smoking and drinking. Previously, we have shown that 195 and 327 of the markers in the Levine panel being significantly associated with cg05575921 and cg04987734 methylation, respectively [Citation24]. However, each of these populations used in training these indices also have diseases (e.g. renal failure) or processes (e.g. toxic metal exposures) not highly related to smoking or drinking whose frequency varies between populations. This variability, and other challenges, can make use the use of regression techniques to identify sets of methylation loci that both reliably and discretely capture those varying mortality risks that are not colinear with either smoking or drinking using data from a non-enriched general population sample a difficult proposition. Thus, we believe that improving these accelerated ageing indices through current approaches may be a difficult task.
In contrast, our approach illustrates a process for building an adaptable mortality index in which we first select markers highly predictive of smoking and drinking status, then add disease-specific markers for prevalent causes of mortality that capture components of illness that are not highly related to substance use. To do this it is first necessary to collect DNA from large, ethnically informed, well characterized cohorts specific for each condition and then conduct epigenome-wide association analyses (EWAS) to identify these markers. Previously, we have accomplished this task for both drinking and smoking [Citation21–23] while others identified a reasonable epigenetic predictor of diabetes status [Citation25–27]. This disease-first foundation for the index was further supplemented by our recent integrated genetic-epigenetic analyses of CAD, which used DNA from an Intermountain cohort specifically collected for these purposes, that isolated a set of markers highly predictive of CAD [Citation34]. Because machine learning algorithm used in these studies emphasized the value of combinations of markers rather than the strength of the individual markers themselves, it was possible to identify non-collinear markers that map strongly risk factors for CAD such as elevated serum LDL levels, but not smoking. The current demonstration that cg00300879, a marker specific for incident CAD, significantly improves mortality prediction in the FHS suggests that the inclusion of other disease-specific methylation assays for prevalent heart disease or other less common causes of death such as Alzheimer’s disease could further improve mortality prediction when used in the right circumstances [Citation47]. However, to accomplish this, it will first be necessary to assemble the appropriate set of biomaterials from well-characterized clinical population studies and then conduct EWAS to identify markers reliably predictive for these discrete illnesses. Still, we wish to note that at the current time, there are no clear effective or prevention measures for Alzheimer’s Disease. Hence, we are ambivalent on the merits of adding such measures to the current index whose goal is to provide an initial simple, ethnically unbiased index of treatable conditions for health-care researchers.
A second important step forward illustrated in this paper is the reduction of the array-based assessments to more easily translatable components with clearer implications for follow-up assessment and, in some cases, intervention. A major barrier to greater use of methylation technologies for general purposes is the reliance of current mortality prediction tools on genome-wide arrays. This reliance is problematic because array-based assessments are costly, take considerable amounts of time, are computationally intensive and are reference-dependent. In contrast, single locus methylation-sensitive dPCR assessments can be performed more rapidly, are relatively easy to interpret, and are reference free [Citation48]. What is more, to date, because of the lack of off-target hybridization effects, we have shown that each of the five dPCR markers for substance use have greater predictive power than the Illumina array assessments that they were designed to model [Citation22]. Still, it is important to note that not all methylation loci can be easily modelled using dPCR, so as of yet, this approach will not work for all loci contained on the Illumina array. Fortunately, for those more difficult loci, there are other approaches such as pyrosequencing which also can be used to accurately assess methylation status [Citation48].
From a clinician’s viewpoint, perhaps the greatest advantages of this approach to predicting mortality are the interpretability and direct actionability of each of the variables. Each of the five methylation components used in this index map to discrete, potentially addressable clinical conditions. Because the sensitivity and specificity for smoking for cg05575921 are so high, current smoking status should be verified in anyone with significant demethylation of cg05575921 [Citation21]. In this regard, we feel compelled to repeat the fact that for those who smoke, smoking cessation is the most generally beneficial treatment that a patient can receive [Citation49]. Therefore, if the patient is still smoking, he/she should be strongly counselled to quit smoking. Furthermore, if the patient/subject has recently quit smoking, he/she should be periodically monitored to ensure that relapse does not occur. Similarly, although cg04987734 and cg02583484 are not as sensitive and specific for heavy alcohol consumption (HAC) as cg05575921 is for smoking, the individual AUC at these loci using the dPCR assay are still high enough (~0.85 each) to suggest that we believe that anyone with significant elevation of cg04987734 or cg02583484 methylation should be evaluated for an alcohol use disorder either through the use of the full dPCR methylation panel, which has an AUC of 0.95 for HAC and outperforms conventional carbohydrate-deficient transferrin testing [Citation50], or through referral to a mental health professional [Citation51]. Finally, significant changes in cg00300879 or cg19693031, particularly in the presence of significant cg05575921 demethylation, may suggest the need for further cardiovascular or HbA1c testing. Hence, we believe that each of the loci could bring value in the right clinical setting.
As shown in one of our recent communications, array-based assessment tools that have a heritable component can have ethnic bias [Citation16]. Hence, we and others have expressed some well-founded concerns about the use of ageing indices to guide health-care decisions [Citation14,Citation52]. To help ensure that our smoking and drinking markers had no ethnic bias, our National Institutes of Health-funded genome-wide studies purposefully conducted age, gender and ethnicity inclusive case and control examinations of relationship of alcohol and cigarette consumption to methylation status [Citation53,Citation54]. This case and control study design helped ensure that the resulting marker(s) specific for smoking or drinking would not be influenced by these factors and increased the likelihood that the results would generalize to individuals of all ages, ethnicities and gender. The essentially equal set points of cg05575921, cg04987734 and cg02583484 (see ), which provide the bulk of the predictive power of the index, in adolescent White and African Americans as well as every other ancestry that we have examined, combined with their large substance-induced dynamic ranges which are not influenced by ethnicity, suggests that to a large extent, we have achieved this goal.
Similarly, the current data and taken together with studies of the epigenetics of diabetes by others suggest that cg19693031 has little to no detectable ethnic or gender bias. However, in contrast to cg05575921, cg04987734 and cg02583484, which do not change in the absence of substance consumption, cg19693031 methylation is negatively correlated with age even when haemoglobin A1c levels are considered. But this may be secondary to the fact that the HbA1c does not perfectly predict diabetes status and the marker is tagging some of the unaccounted variance in the risk for either diabetes and/or mortality.
We are not oblivious to the statistically insignificant, yet arithmetically notable set point difference at cg00300879 and are continuing to examine this point further. It may well be that this marker, which makes a surprisingly minor contribution to the predictive power in this index, may need to be replaced if we are to be absolutely sure of having a completely bias free methylation index. Alternatively, as we show elsewhere, by adding genetic information to allow for incorporation of genetically contextual effects for a specific locus, it not only improves prediction but it makes possible to use methylation from that CpG locus in an ethnically unbiased manner [Citation34]. We note that cg00300879 is a marker selected for its predictive power for incident MI and is designed to be employed in combination with other methylation and genetic markers using a random forest prediction algorithm [Citation34]. It very well may be that other markers predictive of prevalent CAD or incident CAD identified through conventional EWAS approaches may be more informative for this type of application [Citation55]. In these cases, care should be engaged to safeguard accidentally tagging genetic variation.
Our intent in this communication to suggest an affordable, actionable set of assays, not to define a one-size fits-all mortality panel. Because the relative weighting of disease impact are age- and culture-specific, consideration should always be given to including new markers or excluding non-informative markers as indicated. To a certain extent, assessments of cg05575921 and the two alcohol markers, cg04987734 and cg02583484, will provide predictive value in most situations because of the profound direct impact of these environmental factors and indirect impact of the factors which segregate with substance use on mortality across the lifespan. However, the incident CAD marker and certainly any predictor of dementia would have little immediate predictive value in a younger population. Furthermore, as changes in the environment preferentially provoke previously less frequent disease processes, such as non-alcoholic fatty liver disease [Citation56], alterations of biomarker panels to include assays capable of capturing these new sources of hopefully preventable mortality. It is important to note that these biomarkers need not be epigenetic; they only need to be predictive and relatively free of bias.
To those interested in the question ‘which method is better?’, we simply note that an understanding as to how well these dPCR panels will perform as the GrimAge panel will take a direct comparison. The comparisons detailed in are flawed in at least two respects. First, because we do not have access to the FHS DNA, we used the Illumina probe values not the dPCR values. When we directly compare the power of the dPCR to the Illumina probe values with respect to alcohol and smoking markers, we significantly increase predictive power [Citation22]. Whether this same phenomenon will happen for the new diabetes and CAD markers is uncertain and their overall effect on algorithm performance unknown. Only testing using actual DNA samples from a cohort also examined with an Illumina array can determine this. Second, the GrimAge algorithm was trained using the FHS [Citation15], so it should work well in the FHS. However, because the performance of algorithms is normally highest in the dataset in which they were trained [Citation57] and the genetic loading described previously may affect generalizability to other populations, the performance in other populations is likely less. In contrast, our approach was developed in other population and tested in the FHS as evidence of generalizability. However, in the end, we note that the approaches are not mutually exclusive, and we simply suggest that investigators and clinicians pick a method that suits their purposes best. Indeed, as members of the medical community, it is our hope that this is the start of a better assessment process, and that other investigators expand and improve upon it.
In summary, we report the development of a five-locus assay that is highly predictive of mortality, relatively free of ethnic bias, does not contain personal identifying genetic information, and whose results are interpretable and actionable. The addition of other markers not highly associated with smoking or drinking yet predictive of other common causes of death could improve prediction and utility of this panel further.
Acknowledgments
The efforts to analyse the data and write this report were supported by R43 AA027197 (Philibert) and R01AG055393 (Simons). The collection of the FACHS subjects was supported by MH080898 (Philibert). The collection and characterization of the Healthy Iowans Study was supported by R01DA037648 (Gerrard and Philibert).
Disclosure statement
Dr. Philibert is the Chief Executive Officer of Behavioral Diagnostics, Chief Medical Officer of Cardio Diagnostics Inc, and inventor on several granted and pending patent applications with respect to cardiovascular disease, and both alcohol and tobacco consumption related to the material discussed herein. The use of cg05575921 status to determine smoking status is protected by US Patents 8,637,652 and 9,273,358. Dr. Dogan is the CEO of Cardio Diagnostics Inc and the inventor of pending patent applications with respect to cardiovascular disease.
Additional information
Funding
References
- Rapsang AG, Shyam DC. Scoring systems in the intensive care unit: a compendium. Indian J Crit Care Med. 2014;18:220.
- Cummins JD, Smith BD, Vance RN, et al. Risk classification in life insurance. Springer Science & Business Media. Netherlands: Springer; 2013.
- Fraga MF, Esteller M. Epigenetics and aging: the targets and the marks. Trends Genet. 2007;23:413–418.
- Bocklandt S, Lin W, Sehl ME, et al. Epigenetic predictor of age. Plos One. 2011;6(6):e14821.
- Hannum G, Guinney J, Zhao L, et al. Genome-wide methylation profiles reveal quantitative views of human aging rates. Mol Cell. 2013;49(2):359–367.
- Horvath S. DNA methylation age of human tissues and cell types. Genome Biol. 2013;14(10):3156.
- Zhang Y, Schöttker B, Florath I, et al. Smoking-associated DNA methylation biomarkers and their predictive value for all-cause and cardiovascular mortality. Env Health Perspect. 2015;124:67–74.
- Zhang Y, Saum K-U, Schöttker B, et al. Methylomic survival predictors, frailty, and mortality. Aging (Albany NY). 2018;10:339.
- Levine ME, Lu AT, Quach A, et al. An epigenetic biomarker of aging for lifespan and healthspan. Aging (Albany NY). 2018;10:573.
- Pidsley R, Zotenko E, Peters TJ, et al. Critical evaluation of the Illumina MethylationEPIC BeadChip microarray for whole-genome DNA methylation profiling. Genome Biol. 2016;17(1):208.
- Dedeurwaerder S, Defrance M, Bizet M, et al. A comprehensive overview of Infinium HumanMethylation450 data processing. Brief Bioinform. 2013;15:929–941.
- Chen Y-A, Lemire M, Choufani S, et al. Discovery of cross-reactive probes and polymorphic CpGs in the Illumina Infinium HumanMethylation450 microarray. Epigenetics. 2013;8:203–209.
- Rahmani E, Shenhav L, Schweiger R, et al. Genome-wide methylation data mirror ancestry information. Epigenetics Chromatin. 2017;10(1):1.
- Philibert RA, Terry N, Erwin C, et al. Methylation array data can simultaneously identify individuals and convey protected health information: an unrecognized ethical concern. Clin Epigenetics. 2014;6(1):28.
- Lu AT, Quach A, Wilson JG, et al. DNA methylation GrimAge strongly predicts lifespan and healthspan. Aging (Albany NY). 2019;11(2):303.
- Philibert R, Beach SRH, Lei M-K, et al. Array-based epigenetic aging indices may be racially biased. Genes (Basel). 2020;11(6):685.
- Issa J-P. Aging and epigenetic drift: a vicious cycle. J Clin Invest. 2014;124:24–29.
- Martin GM. Epigenetic drift in aging identical twins. Proc Natl Acad Sci U S A. 2005;102:10413–10414.
- Field AE, Robertson NA, Wang T, et al. DNA methylation clocks in aging: categories, causes, and consequences. Mol Cell. 2018;71:882–895.
- Philibert RA, Gunter TD, Beach SR, et al. MAOA methylation is associated with nicotine and alcohol dependence in women. Am J Med Genet A. 2008;147B:565–570.
- Philibert R, Dogan M, Beach SRH, et al. AHRR methylation predicts smoking status and smoking intensity in both saliva and blood DNA. Am J of Genet. 2019;183:51–60.
- Philibert R, Miller S, Noel A, et al. A four marker digital PCR toolkit for detecting heavy alcohol consumption and the effectiveness of its treatment. J Insur Med. 2019. DOI:https://doi.org/10.17849/insm-48-1-1-1.1
- Park SL, Patel YM, Loo LWM, et al. Association of internal smoking dose with blood DNA methylation in three racial/ethnic populations. Clin Epigenetics. 2018;10(1):110.
- Mills JA, Beach S, Dogan M, et al. A direct comparison of the relationship of epigenetic aging and epigenetic substance consumption markers to mortality in the Framingham heart study. Genes (Basel). 2019;10(1):51.
- Chambers JC, Loh M, Lehne B, et al. Epigenome-wide association of DNA methylation markers in peripheral blood from Indian Asians and Europeans with incident type 2 diabetes: a nested case-control study. Lancet Diabetes Endocrinol. 2015;3(7):526–534.
- Soriano-Tárraga C, Jiménez-Conde J, Giralt-Steinhauer E, et al. Epigenome-wide association study identifies TXNIP gene associated with type 2 diabetes mellitus and sustained hyperglycemia. Hum Mol Genet. 2015;25(3):609–619.
- Florath I, Butterbach K, Heiss J, et al. Type 2 diabetes and leucocyte DNA methylation: an epigenome-wide association study in over 1,500 older adults. Diabetologia. 2016;59(1):130–138.
- Dogan MV, Beach SRH, Philibert RA. Genetically contextual effects of smoking on genome wide DNA methylation. Am J Med Genet B Neuropsychiatr Genet. 2017;174:595–607.
- Miguel-Hurtado O, Guest R, Stevenage SV, et al. Comparing machine learning classifiers and linear/logistic regression to explore the relationship between hand dimensions and demographic characteristics. Plos One. 2016;11:e0165521.
- Bzdok D, Altman N, Krzywinski M. Points of significance: statistics versus machine learning. Nature Methods. 2018;15(04):233–234
- Kursa MB, Rudnicki WR. Feature selection with the Boruta package. J Stat Softw. 2010;36:1–13.
- Dogan M, Beach S, Simons R, et al. Blood-based biomarkers for predicting the risk for five-year incident coronary heart disease in the Framingham heart study via machine learning. Genes (Basel). 2018;9(12):641.
- Dogan MV, Grumbach IM, Michaelson JJ, et al. Integrated genetic and epigenetic prediction of coronary heart disease in the Framingham Heart Study. PloS One. 2018;13:e0190549.
- Dogan MV, Knight S, Dogan T, et al. External validation of integrated genetic-epigenetic biomarkers for predicting incident coronary heart disease. (In Submission).
- Garrison RJ, Castelli WP, Feinleib M, et al. The association of total cholesterol, triglycerides and plasma lipoprotein cholesterol levels in first degree relatives and spouse pairs. Am J Epidemiol. 1979;110(3):313–321.
- Gibbons FX, Gerrard M, Cleveland MJ, et al. Perceived discrimination and substance use in African American parents and their children: a panel study. J Pers Soc Psychol. 2004;86:517–529.
- Dawes K, Andersen A, Papworth E, et al. Refinement of cg05575921 demethylation response in nascent smoking. Clin Epigenetics. 2020;12(1):1–11.
- Pidsley R, Wong CC, Volta M, et al. A data-driven approach to preprocessing Illumina 450K methylation array data. BMC Genomics. 2013;14(1):1–10.
- Tsao CW, Vasan RS. Cohort profile: the Framingham Heart Study (FHS): overview of milestones in cardiovascular epidemiology. Int J Epidemiol. 2015;44(6):1800–1813.
- Cox DR. Regression models and life-tables. J R Stat Soc Series B Stat Methodol. 1972;34:187–220.
- Harrell FE Jr, Califf RM, Pryor DB, et al. Evaluating the yield of medical tests. JAMA. 1982;247:2543–2546.
- Hosmer DW Jr, Lemeshow S. Applied survival analysis: regression modelling of time to event data (1999). Eur Orthodontic Soc. 1999;561–562.
- Akaike H. A new look at the statistical model identification. IEEE Trans Autom Control. 1974;19:716–723.
- Harrell FE Jr. Regression modeling strategies: with applications to linear models, logistic and ordinal regression, and survival analysis. New York, NY: Springer; 2015.
- Bonferroni CE, Bonferroni C, Bonferroni C Teoria statistica delle classi e calcolo delle probabilita’. 1936.
- Ogutu JO, Schulz-Streeck T, Piepho H-P. Genomic selection using regularized linear regression models: ridge regression, lasso, elastic net and their extensions. BMC Proc. 2012;6:S10.
- Vasanthakumar A, Davis JW, Idler K, et al. Harnessing peripheral DNA methylation differences in the Alzheimer’s Disease Neuroimaging Initiative (ADNI) to reveal novel biomarkers of disease. Clin Epigenetics. 2020;12(1):1–11.
- U.S. Department of Health & Human Services. Quantitative comparison of DNA methylation assays for biomarker development and clinical applications. Nat Biotechnol. 2016;34:726.
- Health, U.S.D.o. & Services, H. The health consequences of smoking: a report of the Surgeon General. 2004.
- Miller S, Mills JA, Long J, et al. Comparison of the predictive power of DNA methylation with carbohydrate deficient transferrin for heavy alcohol consumption. (In Submission).
- Philibert R, Miller S, Noel A, et al. A Four Marker Digital PCR Toolkit for Detecting Heavy Alcohol Consumption and the Effectiveness of Its Treatment. Journal of Insurance Medicine. 2019;48(1):90–102
- Dupras C, Beck S, Rothstein MA, et al. Potential (mis) use of epigenetic age estimators by private companies and public agencies: human rights law should provide ethical guidance. Environ Epigenet. 2019;5:dvz018.
- Dogan MV, Xiang J, Beach SRH, et al. Ethnicity and Smoking-Associated DNA Methylation Changes at HIV Co-Receptor GPR15. Front Psychiatry. 2015;6. DOI:https://doi.org/10.3389/fpsyt.2015.00132
- Philibert R, Dogan M, Noel A, et al. Genome-wide and digital polymerase chain reaction epigenetic assessments of alcohol consumption. Am J Med Genet B Neuropsychiatr Genet. 2018;177(5):479–488.
- Huan T, Joehanes R, Song C, et al. Genome-wide identification of DNA methylation QTLs in whole blood highlights pathways for cardiovascular disease. Nat Commun. 2019;10(1):4267.
- Bellentani S. The epidemiology of non-alcoholic fatty liver disease. Liver Int. 2017;37:81–84.
- Tharwat A. Classification assessment methods. Appl Comput Inf. 2020. [ahead-of-print ahead-of-print]. doi:https://doi.org/10.1016/j.aci.2018.08.003