
ABSTRACT
The herbicide glyphosate has been shown to promote the epigenetic transgenerational inheritance of pathology and disease in subsequent great-grand offspring (F3 generation). This generational toxicology suggests the impacts of environmental exposures need to assess subsequent generations. The current study was designed to identify epigenetic biomarkers for glyphosate-induced transgenerational diseases using an epigenome-wide association study (EWAS). Following transient glyphosate exposure of gestating female rats (F0 generation), during the developmental period of gonadal sex determination, the subsequent transgenerational F3 generation, with no direct exposure, were aged to 1 year and animals with specific pathologies identified. The pathologies investigated included prostate disease, kidney disease, obesity, and presence of multiple disease. The sperm were collected from the glyphosate lineage males with only an individual disease and used to identify specific differential DNA methylation regions (DMRs) and the differential histone retention sites (DHRs) associated with that pathology. Unique signatures of DMRs and DHRs for each pathology were identified for the specific diseases. Interestingly, at a lower statistical threshold overlapping sets of DMRs and DHRs were identified that were common for all the pathologies. This is one of the first observations that sperm histone retention can potentially act as a biomarker for specific diseases. The DMR and DHR associated genes were identified and correlated with known pathology specific-associated genes. Observations indicate transgenerational epigenetic biomarkers of disease pathology can be identified in the sperm that appear to assess disease susceptibility. These biomarkers suggest epigenetic diagnostics could potentially be used to facilitate preventative medicine.
Introduction
Environmental exposures such as toxicants or nutrition can modulate genome activity (e.g. gene expression) and biology through epigenetic processes [Citation1–4]. Epigenetics is defined as ‘molecular factors and processes around DNA that regulate genome activity, independent of DNA sequence, and are mitotically stable’ [Citation5,Citation6]. Epigenetic processes include DNA methylation, histone modifications, non-coding RNA, chromatin structure, and RNA methylation. Previous observations have shown a variety of environmental factors can promote the epigenetic transgenerational inheritance of disease or phenotypic alterations through epigenetic changes in the germline (sperm or eggs) [Citation1]. The direct exposure of multiple generations, such as the gestating female and fetus, to affect the F0 and F1 generations are termed multigenerational exposures and intergenerational effects [Citation7], while the transmission of epigenetic alterations and phenotypes through the sperm or egg in the absence of continued direct exposure is termed epigenetic transgenerational inheritance [Citation8]. The initial germline transgenerational epigenetic alteration reported involved differential DNA methylation regions (DMRs) [Citation9]. Subsequently, alterations in ncRNA were observed [Citation10], and injection of altered sperm ncRNA into eggs transgenerationally propagated a behavioural alteration observed [Citation11]. Histone alterations in sperm associated with histone retention regions (DHRs) have also been observed transgenerationally [Citation12,Citation13]. Recently, the concurrent transgenerational alterations in DMRs, DHRs, and ncRNA have been observed in sperm [Citation13,Citation14]. Therefore, the integrated actions of all the epigenetic processes appear to be involved in the epigenetic transgenerational inheritance phenomenon. The alterations of the DMRs in sperm have been previously associated with toxicant-induced transgenerational diseases and pathologies [Citation15–17]. The current study further investigates these epigenetic biomarkers and association with disease susceptibility.
Glyphosate is one of the most commonly used herbicides in agriculture worldwide [Citation18,Citation19]. Monsanto, St. Louis Missouri, commercialized glyphosate in the 1970s which is now used extensively in corn, soy, and canola crops [Citation18]. Annual increases in glyphosate use have been observed in most agricultural crops, as well as in public lawn and garden use. The USA Environmental Protection Agency (EPA) has designated glyphosate as ‘safe’ for direct exposure toxicity. The European Food Safety Authority (EFSA) has stated there is a low acute toxicity observed by oral, dermal, or inhalation routes. The International Agency for Research on Cancer (IARC) has expressed a concern regarding cancer following glyphosate exposure [Citation20]. General public exposure is primarily assumed to be from food consumption of crops that have had application of glyphosate, due to the ability of the plants to take up the compound [Citation19]. The No Observational Adverse Effect Level (NOAEL) is 50 mg/kg per day dose [Citation21]. Exposures of 50–500 mg/kg per day have been reported [Citation22]. The relatively rapid half-life of ~5–10 hours in mammals and minimal direct exposure toxicity observed supports the regulatory agency determinations.
Recently we have demonstrated that a low-level glyphosate direct exposure, below the NOAEL dose, has no effect on the pathologies of the directly exposed individuals using a mammalian rat model [Citation23], supporting previous studies that direct exposure toxicity of glyphosate is minimal [Citation24,Citation25]. When the exposed gestating female F0 generation and F1 generation offspring were examined later in life, they both were found to have negligible detectable alteration in pathology from the control vehicle exposed population [Citation23]. However, the subsequent F2 generation grand offspring and F3 generation great-grand offspring did have a significant increase in the frequency of pathology and disease [Citation23]. The direct actions of glyphosate on the F0 generation gestating female and F1 generation offspring were not found to promote major pathology, but generational toxicology on the F2 and F3 generations were observed [Citation23]. The effects observed in the F1 generation were alterations in puberty and weaning weights in males and females [Citation23]. The altered pathology in the F2 generation males involved increases in testis and kidney disease, altered pubertal onset, increased obesity, and the presence of multiple disease [Citation23]. The F2 generation female altered pathology included increased ovarian disease, mammary tumors, altered pubertal onset, obesity, premature birth abnormalities, and the presence of multiple diseases [Citation23]. The glyphosate-induced transgenerational disease in the F3 generation pathology in males included prostate disease, obesity, weaning weight alterations, and increased multiple disease frequency [Citation23]. Transgenerational F3 generation pathology in females included ovarian disease, kidney disease, parturition abnormalities, obesity, and increased presence of multiple diseases [Citation23]. All these transgenerational pathologies observed are relevant to human populations that have observed generational increases in these diseases, including ovarian disease, kidney disease, prostate disease, testis disease, altered pubertal onset, obesity, parturition abnormalities, and the presence of multiple diseases [Citation1]. Therefore, the previous observations demonstrate negligible disease in the direct-exposed generations, but significant disease in subsequent generations, termed generational toxicology [Citation1], that is mediated through glyphosate-induced epigenetic transgenerational inheritance mechanisms.
Previous studies with the agricultural fungicide vinclozolin [Citation17,Citation26], pesticide DDT (dichloro-diphenyl-trichloroethane) [Citation16], and herbicide atrazine [Citation15] have shown the ability of these toxicants to induce the epigenetic transgenerational inheritance of disease, and these pathologies are associated with potential epigenetic biomarker signatures of DMRs. The individual animals with specific pathologies in these transgenerational model systems were associated with unique epigenetic (i.e. DMRs) signatures for each of the different toxicant exposures [Citation1,Citation15,Citation16]. A transgenerational disease DMR biomarker signature was identified for the majority of transgenerational pathologies observed. Therefore, the concept that an epigenetic biomarker for a specific disease induced by a variety of the toxicants transgenerationally has been established [Citation15,Citation16].
The current study extends these previous analyses to include the potential that both DMRs and differential histone retention sites (DHRs) can also be used as transgenerational disease biomarkers. This is one of the first reports of the potential that sperm DHRs may act as disease biomarkers. In addition, the assessment of potential overlapping DMR and DHR biomarkers between different diseases or pathologies was determined. Glyphosate induced epigenetic transgenerational sperm DMR and DHR biomarkers for specific disease were identified. How the various disease biomarkers overlap were investigated to assess the underlying potential epigenetic alterations associated with the transgenerational disease. Observations provide insight into the role of environmental epigenetics and transgenerational inheritance in disease etiology, with a focus on generational toxicology.
Materials and methods summary
Animal studies and breeding
Outbred Sprague Dawley SD male and female rats were fed a standard diet with water ad lib and mated. Gestating female rats were exposed to glyphosate and offspring bred for three generations in the absence of exposure. The breeding strategy and details are described in the Supplemental Methods. The F3 generation was aged to 1 year and pathologies assessed, as described in the Supplemental Methods. Sperm were isolated and used for epigenetic analysis and correlated to individuals’ disease, as described in the Supplemental Methods. All experimental protocols for the procedures with rats were pre-approved by the Washington State University Animal Care and Use Committee (protocol IACUC # 2568), and all methods were performed in accordance with the relevant guidelines and regulations.
Epigenetic analysis, statistics and bioinformatics
DNA was isolated from the purified sperm, as previously described [Citation13] in the Supplemental Methods. Methylated DNA immunoprecipitation (MeDIP) and differential histone retention with H3 histone chromatin immunoprecipitation (H3-ChIP), followed by next-generation sequencing (MeDIP-Seq) and (H3-ChIP-Seq) was performed. MeDIP-Seq and H3-ChIP-Seq, sequencing libraries, next-generation sequencing quality control, and bioinformatics analysis were performed, as described in the Supplemental Methods. Epimutation gene associations and analysis are also described in the Supplemental Methods. All molecular data have been deposited into the public database at NCBI (GEO # GSE118557 and GSE152678), and R code computational tools are available at GitHub (https://github.com/skinnerlab/MeDIP-seq) and www.skinner.wsu.edu.
Results
Animal breeding
Sprague Dawley gestating female rats (F0 generation) at 90 days of age were exposed in order to study the transgenerational effects of glyphosate. Previously we have identified inbreeding depression of transgenerational epigenetics [Citation27], so prefer an outbred line of rats to optimize the epigenetic transgenerational inheritance of pathologies. The pregnant rats were transiently exposed (25 mg/kg body weight glyphosate daily) between days 8–14 of gestation during fetal gonadal sex determination when germ cell epigenetic programming occurs. Twenty-five mg/kg/day is half the No Observable Adverse Effect Level (NOAEL) exposure of 50 mg/kg/day [Citation28]. Glyphosate has a rapid metabolism turnover of 5–10-h half-life, such that the concentration will decrease by approximately 75–90% daily during the transient exposure period. The 2–4 half-lives that occur each 24-h period indicates that after 7 days of exposure less than 50 mg/kg/daily, the exposures NOAEL, would be present. The offspring F1 generation rats (directly exposed in utero) were aged to 90 days of age and bred within the lineage to generate the grand-offspring F2 generation (directly exposed through the F1 generation germline), which were then bred at 90 days of age to generate the F3 generation (not directly exposed so transgenerational). The control lineage used F0 gestating rats exposed to the vehicle control dimethyl sulphoxide (DMSO) or phosphate-buffered saline (PBS). All the lineages were aged to 1 year and euthanized for pathology and sperm epigenetic analysis. At each generation, five litters were obtained with no sibling or cousin breeding to prevent any inbreeding artifacts in the control or glyphosate lineages. Due to the lack of any inbreeding, the potential frequency of genetic segregation is minimal in the F3 generation and was not observed with sibling comparisons. As previously described and to prevent litter bias, at each generation between 6 and 8 unrelated founder gestating females from different litters were bred, and five litters were obtained and culled early in postnatal development to 10 pups per litter with animals of each sex from each litter used to generate 25–50 individuals of each sex for each generation for analysis [Citation23]. Similar numbers of males and females were used from each litter to avoid any litter bias. Additional details of the breeding strategy are presented in the Supplemental Methods. All protocols and studies were approved by the Washington State University Animal Care and Use Committee (protocol IACUC # 2568).
Pathology analysis
In our previous study, pathology calls were made by assessing histology sections of testis, kidney, prostate, and gonadal adipocytes [Citation23]. The complete histological sections were analysed by two different observers blinded to the exposure. In the event of a discrepancy, a third observer blinded to the exposure was also used. The pathology parameters identified were as previously described [Citation15–17,Citation23]. For the testis pathology, the abnormalities quantified were atrophy of seminiferous tubules, vacuoles within seminiferous tubules, and sloughing of cellular debris into the tubular lumen (maturation arrest). For prostate pathology, the abnormalities quantified were atrophy of prostatic epithelium, vacuoles within the prostatic epithelium, and prostatic epithelial hyperplasia. For kidney pathology, the abnormalities quantified were reduced glomerular size, thickening of the Bowman’s capsule, and renal cysts. The age of puberty onset was determined. Obesity was assessed with an increase in adipocyte size (area), body mass index (BMI) and abdominal adiposity [Citation16]. In all cases the number of abnormalities in an animal’s tissue was compared with the mean number of abnormalities in the control group to determine if that tissue was diseased, as described in the Supplemental Methods. For the F3 generation glyphosate lineage male pathology, the individual animals are listed and a (+) indicates presence of disease and (-) absence of disease (). The F3 generation control lineage male pathology, the individuals are listed similarly (Supplemental Table S1). Only the individuals with a single disease for a specific pathology were used for that pathology, except in the case of the multiple category disease when animals with two of more diseases were used. This allows a more accurate association with disease and eliminates the confounding presence of other disease or co-morbidities. The control lineage did not have sufficient numbers of animals with a specific disease, Supplemental Table S1, so were not analysed further. Although the F3 generation males had a testis disease group, two individuals had only testis disease, so too few for further analysis. The other disease had n = 4 individuals for kidney disease, n = 7 with prostate disease, n = 13 for obesity, and n = 10 for multiple (≥2) disease, . The disease animals were compared to animals with no disease n = 8, . The limited number of individuals needs to be considered in data interpretation and statistical analysis. In contrast to previous analyses using DDT or vinclozolin sperm biomarkers for disease, when all animals with a specific disease were analysed independent of co-morbidities [Citation16,Citation17], the current study sought to optimize disease specific biomarker assessment.
Table 1. F3 generation glyphosate lineage male pathology. The individual animals for the glyphosate lineage males are listed and a (+) indicates presence of disease and (-) absence of disease. The animals with shaded (+) were used for the epigenetic analysis due to the presence of only one disease, except the multiple (≥2) disease
Sperm DNA methylation analysis
Transgenerational inheritance of pathology and disease requires the germline (sperm or egg) to transmit epigenetic information between generations [Citation1]. Purified sperm were collected from the control and glyphosate lineage F3 generation males for epigenetic analysis, as described in the Supplemental Methods. Potential differential DNA methylation regions (DMRs) in the sperm were identified using a comparison between the control and the glyphosate lineage (). Within the glyphosate lineage, individuals with a given disease (prostate, kidney, obesity, multiple disease (≥2)) were compared to non-diseased animals from the glyphosate lineage to define disease-specific DMRs (–E).
Figure 1. DMR identification and numbers. The number of DMRs found using different p-value cut-off thresholds. The All Window column shows all DMRs. The Multiple Window column shows the number of DMRs containing at least two significant windows (1 kb each). The number of DMRs with the number of significant windows (1 kb per window) at an edgeR p-value threshold bolded for DMR. (a) Glyphosate versus control DMRs; (b) Prostate disease DMRs; (c) Kidney disease DMRs; (d) Obesity disease DMRs; and (e) Multiple disease DMRs. (f) Venn diagram DMR overlap of each data set with edgeR p-value indicated. The bolded edgeR p-value was used for all subsequent data analysis
DNA from the sonicated purified sperm was isolated, fragmented and the methylated DNA immunoprecipitated using a methyl-cytosine antibody (MeDIP). The MeDIP DNA fragments were then sequenced for an MeDIP-Seq analysis, as described in the Supplemental Methods [Citation12,Citation13,Citation29]. The MeDIP-Seq analysis was used since >90% of the genome has low CpG density regions, so can assess >90% of the genome-wide DNA methylation. The sperm DMR numbers are presented in for various edgeR statistical p-value cut-off threshold values, and a stringent p-value of p < 1e−05 (control versus glyphosate) or p < 1e−04 (diseased versus non-diseased) were selected as the threshold for subsequent analyses, as previously described [Citation23]. The total number of DMRs for the control versus glyphosate is 340 with 11 of them having multiple neighboring 1000 bp windows ( and Supplemental Table S2). The previously reported transgenerational F3 generation sperm glyphosate versus control lineage DMRs used three pools of different animals to identify the glyphosate-induced sperm DNA alterations [Citation23]. The current study used individual animal sperm analysis to identify the glyphosate-induced transgenerational F3 generation DMRs (). A comparison of these two studies demonstrates the 340 DMRs with a p < 1e-05 has an overlap of 129 DMRs with the previous DMRs at p < 0.05. Therefore, a 38% overlap was observed at this reduced statistical threshold. We feel this is a reasonable degree of overlap due to the original study [Citation23] using three pooled sets of samples compared to individual animal analysis in the current study. The current study of individual animal analysis has higher statistical power due to the larger sample size compared to the previous pooled analysis with n = 3 [Citation23].
The animals with a specific disease were compared to non-disease animals to identify the disease-specific sperm DMRs. Previous studies have demonstrated this statistical threshold is optimal for disease-specific epigenetic biomarkers [Citation15–17,Citation26]. The group of animals with prostate disease had 242 DMRs at p < 1e-04 with two multiple windows (i.e., 1 kb each) detected, (). The kidney disease group was found to have 180 total DMRs with 1 of these having multiple neighboring windows (). The obesity disease group had 250 DMRs at p < 1e-04 with 1 of these having multiple neighboring windows (). The multiple disease group had 345 DMRs at p < 1e-04 with 31 of them having multiple neighboring 1000 bp windows, . Using a log-fold-change analysis of individual DMRs, approximately 50% had an increase in DNA methylation with the rest a decrease in DNA methylation, Supplemental Tables S2-S6. Therefore, the different diseases were found to have altered DNA methylation in the F3 generation sperm. Interestingly, negligible overlap was observed between these different DMRs at a statistical threshold of p < 1e-04, (). Observations indicate glyphosate can promote germline epigenetic alterations in DNA methylation with predominantly disease specific DMRs with an edgeR p < 1e-04 threshold (Supplemental Tables S2 – S6).
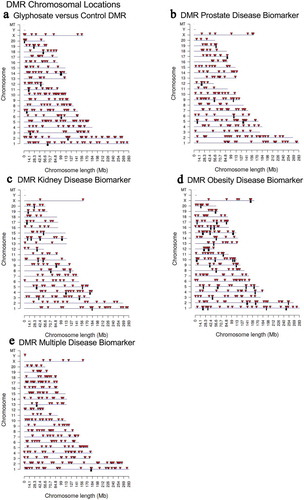
The DMRs chromosomal locations are presented in where arrowheads indicate DMR locations, and black boxes the DMR clusters. All chromosomes had DMRs for glyphosate versus control, but the prostate, kidney, obesity and multiple disease DMR biomarkers were not on the Y or mitochondrial DNA (MT). Therefore, the DMRs were genome-wide and identified on nearly all chromosomes. These DMR chromosomal signatures are potential sperm biomarkers for disease. The CpG density of the DMRs and the DMRs length are shown in Supplemental Figure S1. The CpG density of the DMRs for all the comparisons was 1–5 CpG per 100 bp being predominant, (Supplemental Figure S1). This is characteristic of a low-density CpG deserts [Citation30] which was previously reported with other transgenerational DMRs. The length of the DMRs for each disease biomarker and glyphosate versus control were 1–4 kb with 1 kb length being predominant, Supplemental Figure S1. Generally, the DMRs are 1 kb in size with around 10 CpGs, as previously reported [Citation30]. A principal component analysis (PCA) for the different DMR genomic site comparisons (glyphosate versus control, prostate disease biomarker, kidney disease biomarker, obesity disease biomarker and multiple disease biomarker) demonstrated clustered DMR principal component separation of the control versus glyphosate, and the prostate, kidney, obesity and multiple diseased versus non-diseased (Supplemental Figure S2).
Figure 2. DMR chromosomal locations. The DMR locations on the individual chromosomes is represented with an arrowhead and a cluster of DMRs with a black box. All DMRs containing at least one significant window at the select (bold) edgeR p-value threshold are shown. The chromosome number and size of the chromosome (megabase) are presented. (a) Glyphosate versus control DMRs; (b) Prostate disease DMRs; (c) Kidney disease DMRs; (d) Obesity disease DMRs; and (e) Multiple disease DMRs
Sperm histone retention analysis
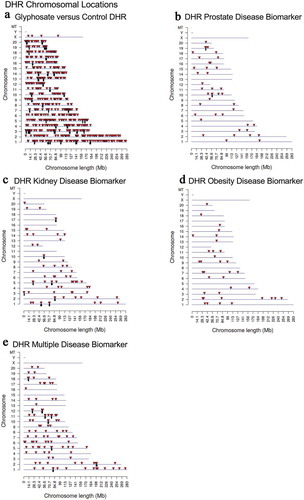
Previous observations have demonstrated that differential histone retention in sperm also appears to have a role in epigenetic transgenerational inheritance [Citation12]. Similarly to the DMRs, the differential histone retention regions (DHRs) in the sperm were identified using a comparison between the control and the glyphosate lineage ( and Supplemental Table S7). Within the same glyphosate lineage animals with a given disease (prostate, kidney, obesity, multiple disease (≥ 2)) versus non-diseased animals were assessed to identify DHRs (–E and Supplemental Tables S8–S11). Interestingly, a high number of DHRs (836) was found at edgeR p < 1e-05 in the glyphosate versus control comparison, . A smaller number of DHRs were detected at p < 1e-04 in the disease biomarkers (prostate, kidney, obesity and multiple diseases), (–E). Similar to the DMR analysis, an overlap of these disease specific DHRs at edgeR p < 1e-04 revealed minimal overlap (). The chromosomal locations of these DHRs are presented in . The different DHRs appear to be genome-wide for the glyphosate versus control comparison, but are more specific over the genome for prostate, kidney, obesity and multiple diseases.
Figure 3. DHR identification and numbers. The number of DHRs found using different edgeR p-value cut-off thresholds. The All Window column shows all DHRs. The Multiple Window column shows the number of DHRs containing at least two significant windows (1 kb each). The number of DHRs with the number of significant windows (1 kb per window) at a bolded p-value threshold is presented. (a) Glyphosate versus control DHRs; (b) Prostate disease DHRs; (c) Kidney disease DHRs; (d) Obesity disease DHRs; and (e) Multiple disease DHRs. (f) Venn diagram DHR overlap for each data set with p-value indicated
Figure 4. DHR chromosomal locations. The DHR locations on the individual chromosomes is represented with an arrowhead and a cluster of DHRs with a black box. All DHRs containing at least one significant window at the edgeR p-value threshold selected (bold) are shown. The chromosome number and size (megabase) are presented. (a) Glyphosate versus control DHRs; (b) Prostate disease DHRs; (c) Kidney disease DHRs; (d) Obesity disease DHRs; and (e) Multiple disease DHRs
The DHRs CpG density and length of DHRs are presented in (Supplemental Figure S3). The CpG density of the DHRs for all the comparisons was 1–5 CpG per 1000 bp being predominant, Supplemental Figure S3. The length of the DHRs for each disease biomarker and glyphosate versus control were 1–3 kb with 1 kb length being predominant except for the glyphosate versus control showing DHRs length from 1 to 10 kb with 1 and 2 kb length being predominant, Supplemental Figure S3. Generally, the DHRs are 1 kb in size with around 10 CpGs as previously reported [Citation30]. A PCA of the different DMR genomic site comparisons (glyphosate versus control, prostate disease biomarker, kidney disease biomarker, obesity disease biomarker and multiple disease biomarker) for the DHRs revealed a clustered separation of the diseases versus non-disease, (Supplemental Figure S4). This helps confirm the edgeR analysis is identifying differential disease sites.
Epimutation comparison analysis
A relatively stringent edgeR p-value for the DMRs or DHRs is used for the identification of these disease specific epimutations, as previously described [Citation15–17,Citation26]. A reduced statistical threshold of p < 0.05 was used to compare and further evaluate the potential overlap of the DMRs or DHRs between the glyphosate versus control and the different disease biomarkers when compared to the higher edgeR p < 1e-04 statistical threshold DMRs. By lowering the stringency to a p-value of <0.05 for the comparison (i.e. extended overlap) the procedure allows for the identification of more potential overlaps between the glyphosate versus control, and the prostate, kidney, obesity and multiple disease comparisons. The relatively high statistical threshold is used as the epigenetic site definition. A comparison of the p < 1e-04 for the DMRs, with each potential comparison at p < 0.05, , demonstrates a much higher overlap between the prostate DMRs and the kidney DMRs (37.2%) and obesity DMRs (59.5%) (). The extended overlap between the DMRs for the different pathologies generally was minimally 30% and as high as 70%, as indicated with highlighted horizontal row comparisons. Interestingly, minimal overlap was observed between the DMRs and DHRs (<10%), except for the glyphosate versus control comparisons with >25% overlap, (). An additional comparison was made between individuals with ≥2 or ≥3 different pathologies. The overlap between these ≥2 and ≥3 multiple diseases was greater than 90% (). Therefore, there was not an increase of DMR or DHR with ≥3 pathologies, and similar DMR and DHR sites were identified. Observations suggest having an increased amount of disease/pathology does not appear to correlate with an increased number of epigenetic alterations. No further analysis of the ≥3 pathology DMR data was performed.
Figure 5. Extended overlap disease DMRs and DHRs. The p-value data set at p < 1e-04 for disease-specific and p < 1e-05 for exposure specific are compared to the p < 0.05 data to identify potential overlap between the different pathologies with DMR or DHR number and percentage of the total presented. The grey highlight is the expanded 100% overlap and yellow highlight overlaps >25%
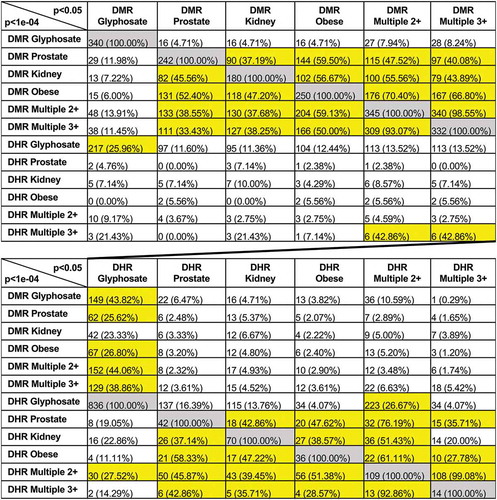
The same reduced statistical edgeR threshold extended overlap was used for the DHRs in . Similarly to the DMRs, a comparison of the p < 1e-04 for the DHRs, with each potential comparison at p< 0.05, (), shows a much higher overlap between the prostate DHRs and the kidney DHRs (42.9%) and obesity DHRs (47.6%) and multiple disease DHRs (76.2%) (). Although very few overlaps are observed between the DMRs and DHRs (), observations indicate that a subset of DMRs and DHRs appear to be common among diseases for a specific disease comparison. Analysis of the DMR or DHR overlaps for sites that are common between the different pathologies identified lists for both, Supplemental Table S12. The lists of DMR and DHR in common with all pathologies identify those with associated genes. Interestingly, when the common DMR and DHR sites for a specific disease comparison were identified and then compared between all the diseases, negligible overlap was observed (). Therefore, there are common DMRs within a specific disease comparisons, but these common DMR sets are primarily disease specific, (Supplemental Figure S5).
Epimutation gene associations
The list of DMRs and DHRs for all the epigenetic alterations identified are presented in Supplemental Tables S2–S11. Epimutation gene associations used DMR or DHR identified within 10 kb of a gene so as to include proximal and distal promoter elements. The minority of DMR or DHR, less than 20%, have epimutations associated with genes. Therefore, the majority are intergenic and not within 10 kb of a gene. The DMR and DHR associated genes found were categorized into relevant functional categories for the glyphosate versus control, and for each set of disease biomarkers (). The associated gene categories listed for the Tables S2-S11 used DAVID and Panther public databases with direct experimental gene functional links, as described in the Supplemental Methods. The common GO terms with gene associations are based on literature search correlations between genes and function, which have accuracy issues, even with updated bioinformatics procedures [Citation31], and so were not used in the current study. The top 10 gene categories containing multiple genes are presented for DMRs () and DHRs (). Epimutations were found predominantly in the signalling, metabolism, transcription, receptor and cytoskeleton categories for both DMRs and DHRs (). The number of epimutations was higher for the DMRs compared to the DHRs. The highest represented gene categories typically involve the gene categories with the highest number of associated genes, such as metabolism. No statistical analysis was performed to determine over-represented gene category associations. This analysis was simply done to determine that the general gene category associations expected were observed.
Figure 6. Associated gene categories. (a) DMR-associated gene categories. (b) DHR associated gene categories. The different gene categories and number DMR or DHR presented with color index insert. No statistical analysis was performed for over-represented genes, but sample correlations provided for each gene category
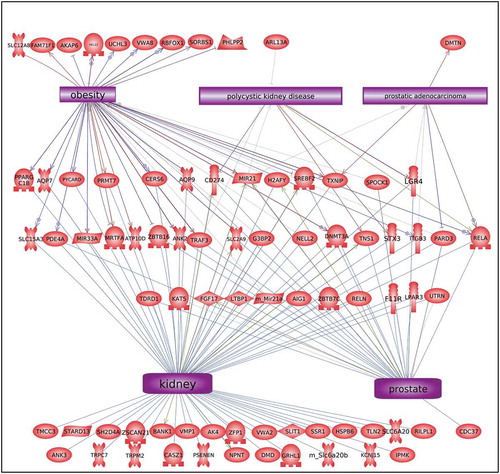
The disease-specific DMR-associated genes, Supplemental Figure S2-S6, were analysed using a Pathway Studio gene database and network tool to identify associated gene processes (). Not surprisingly, the disease-specific DMR-associated genes predominantly corresponded with the associated disease for prostate disease, kidney disease, and obesity (). Some additional associated disease groups were also identified. Interestingly, the multiple (≥2) disease epimutation biomarker DMR-associated genes were found to be correlated with all the major prostate, kidney, and obesity processes (). The individual gene processes and shared gene processes are identified (). The epimutation gene associations with previously identified disease-linked genes helps validate the observations and biomarkers. Statistical analysis of over-representation of DMR-associated genes with diseases as performed by Pathway Studio software (Elsevier, Inc. 2020) revealed that for prostate disease DMR-associated genes () the disease term Benign Prostatic Hypertrophy was enriched (p = 0.048). For obesity disease DMR-associated genes () the term Obesity was enriched (p = 0.046). For the multiple disease DMR-associated genes () the disease terms Obesity (p = 0.004), Polycystic Kidney Disease (p = 0.0008), and Prostatic Adenocarcinoma (p = 0.008) were significantly enriched.
Figure 7. DMR-associated genes within the pathology biomarker DMR set for each individual pathology. The physiologic and pathology process is listed with direct gene links. (a) Prostate disease, (b) kidney disease, and (c) obesity
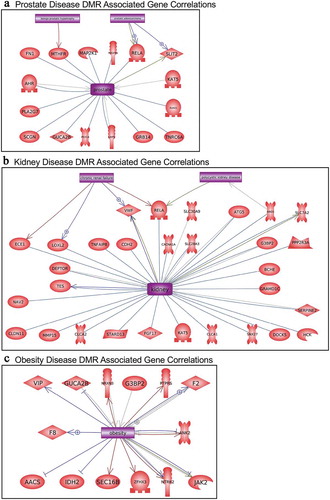
Figure 8. DMR-associated genes within the pathology biomarker DMR set for multiple disease pathology. The physiologic and pathology process is listed with direct gene links
Discussion
A previous study by our laboratory demonstrated the ability of one of the most commonly used agricultural herbicides, glyphosate, to promote the epigenetic transgenerational inheritance of pathology [Citation23]. Negligible pathology was observed in the F0 or F1 generations from direct exposure, but a significant increase in pathology and disease was observed in the grand offspring F2 generation and great-grand offspring F3 generation [Citation23]. This is termed generational toxicology, and appears to develop through the epigenetic transgenerational inheritance of germline epimutation alterations that include imprinted-like gene characteristics and are transmitted to subsequent generations [Citation1,Citation32]. The current study used groups of individuals with a single pathology to identify potential epigenetic biomarkers for disease. The pathologies observed with sufficient numbers of animals include prostate disease, kidney disease, obesity, and multiple disease with individuals with ≥2 different pathologies. These are relevant pathologies for humans in that prostate disease is one of the most prominent pathologies in human males [Citation33]. Prostate disease impacts 50% of the males over the age of 50 years and 100% of the males over 70 years in the USA. Kidney disease is also a prominent disease in ageing population. Obesity is dramatically increasing in the population for both males and females with greater than 30% of the males in the USA [Citation34] and Europe. Although genetic mutations with GWAS have been associated with these human pathologies, the percentage of the disease populations with the genetic mutation association is generally less than 1% of the disease population.
In contrast, altered epigenetic sites termed epimutations appear to have a much higher frequency and appear in the majority of individuals with the disease [Citation15–17]. The current study supports this observation with the majority of individuals with the disease having the pathology epimutation biomarkers. For the transgenerational F3 generation males, the number of differential DNA methylation regions (DMRs) identified for each disease was generally over 200 for the individual disease at edgeR p < 1e-04 threshold. Negligible overlap was observed between the different prostate, kidney, obesity, or multiple disease pathologies DMR biomarkers, . Interestingly, at a reduced comparison statistical threshold, a 30–50% overlap was observed among the different comparisons for specific disease DMR biomarker sets, . Therefore, potential pathology specific epigenetic biomarkers were identified, but individual comparison overlapping sets of DMRs at a reduced threshold are present. The DMR gene associations demonstrate correlation with previously known genes linked to the respective pathologies, and the multiple diseases with the majority of the pathologies. Observations suggest subsets of epimutations common between the pathologies are minimal, while a unique set of pathology-specific biomarkers are present that may provide the disease-specific susceptibility.
In addition to the DMR pathology biomarkers, the novel observation was made that sperm differential histone retention regions (DHRs) are also observed with the different pathologies. The number of DHRs were less than the number of DMRs and the DHRs were also found to have disease specificity, . The histones in sperm are replaced by protamines to compact DNA into the head of the sperm [Citation35] at the later stage of spermatogenesis in the testis following meiosis. However, specific histone retention sites are observed and found to be conserved [Citation12]. Recently we identified environmental toxicant-induced epigenetic transgenerational inheritance of differential histone retention regions (DHRs) [Citation13,Citation14]. The current study demonstrates glyphosate appears to promote the epigenetic transgenerational inheritance of DHRs in sperm. These sperm DHRs also appear to provide epigenetic biomarkers for disease, and this is one of the first observations of DHRs as potential biomarkers for disease. An overlap at edgeR p < 1e-04 demonstrated limited overlap of DHRs between the different pathologies, but at a reduced threshold comparison overlap demonstrated a 25–75% overlap between the pathologies, . Negligible overlap was observed between the DMRs and DHRs at each of the edgeR statistical thresholds. Observations demonstrate the sperm DHRs also appear to provide potential epigenetic biomarkers for disease. The combination of DMRs and DHRs is anticipated to facilitate pathology diagnosis.
A limitation of the current study was the low numbers of animals with a specific individual disease. The edgeR analysis is optimal for the identification of individual DMR or DHR and used a high stringency threshold. Although an edgeR p-value was used to identify and analyse both the disease biomarker DMRs and DHRs [Citation15–17,Citation26], analysis for multiple testing error for false discovery rate (FDR) only provided a p < 0.05 for the exposure versus control comparison with a larger number of individuals. The FDR values for the disease biomarkers were >0.1. Previous studies have demonstrated limitation in FDR analysis with low sample numbers due to the presumptions in the multiple testing parameters [Citation36–41]. Although several corrections for this limitation of FDR have been designed to correct FDR for low sample number limitations, we feel the edgeR value is more useful, due to its use in the identification of the individual epimutations. Therefore, the low sample number is a limitation in the current analysis. Potential higher variability in the data needs to be considered even though higher edgeR values were used, but this does not address multiple testing corrections. Future studies will need to use higher n-values and/or improved analysis techniques to reduce this analysis limitation [Citation36–41].
The presence of the glyphosate-induced transgenerational DMRs in sperm for specific pathologies suggests potential epigenetic biomarkers may be used to assess paternal transmission of disease susceptibility to the offspring. Such an epigenetic biomarker could potentially be used as a preconception diagnostic to determine the susceptibility of disease for the subsequent generations, but future studies are required to investigate this possibility. The knowledge that a disease susceptibility exists would allow potential preventative lifestyle change and therapeutics to be used and/or developed. Therefore, future generation health care could be transitioned to a preventative medicine strategy versus the reactionary medicine used today. The current study provides associated pathology with epigenetic biomarkers of both DMRs and DHRs. Further analysis is needed to determine the use of these biomarkers for early life disease susceptibility biomarkers, prior to the onset of diseases. The previous studies suggest this may be possible [Citation15–17], but formal preventative diagnostics have not been developed. Therefore, the current study used glyphosate induction of transgenerational disease as a proof of concept such environmental biomarkers can be identified and potentially used as diagnostics for disease susceptibility in the future. Since epigenetic biomarkers have a high frequency of association with individuals, the incorporation of epigenetic diagnostics into medicine is anticipated to facilitate preventative medicine and disease management.
Availability of Data and Materials
All molecular data have been deposited into the public database at NCBI (GEO # GSE118557 and GSE152678), and R code computational tools are available at GitHub (https://github.com/skinnerlab/MeDIP-seq) and www.skinner.wsu.edu.
Ethics approval
All experimental protocols for the procedures with rats were pre-approved by the Washington State University Animal Care and Use Committee (protocol IACUC # 2568), and all methods were performed in accordance with the relevant guidelines and regulations.
Consent for Publication
Not applicable.
Author contributions
MBM Molecular analysis, data analysis, wrote and edited manuscript.
DB Bioinformatic analysis, data analysis, edited manuscript.
EN Animal studies, cell isolations, data analysis, edited manuscript.
DK Animal breeding and care, data analysis, edited manuscript.
MKS Conceived, oversight, obtained funding, data analysis, wrote and edited manuscript.
Disclosure of Interest
The authors report no conflict of interest.
Supplemental Material
Download Zip (2.1 MB)Acknowledgments
We acknowledge Dr. Ingrid Sadler-Riggleman, Ms. Michelle Pappalardo, and Mr. Ryan Thompson for technical assistance. We acknowledge Ms. Amanda Quilty for editing and Ms. Heather Johnson for assistance in preparation of the manuscript. We thank the Genomics Core laboratory at WSU Spokane for sequencing data. This study was supported by John Templeton Foundation (50183 and 61174) (https://templeton.org/) grants to MKS and NIH (ES012974) (https://www.nih.gov/) grant to MKS. The funders had no role in study design, data collection and analysis, decision to publish, or preparation of the manuscript.
Supplemental data
Supplemental data for this article can be accessed here.
Funding
This study was supported by John Templeton Foundation (50183 and 61174) (https://templeton.org/) grants to MKS and NIH (ES012974) (https://www.nih.gov/) grant to MKS. The funders had no role in study design, data collection and analysis, decision to publish, or preparation of the manuscript;National Institutes of Health [ES012974];
Additional information
Funding
References
- Nilsson E, Sadler-Riggleman I, Skinner MK. Environmentally induced epigenetic transgenerational inheritance of disease. Environ Epigenet. 2018;4(2):1–13.
- Soubry A. Epigenetic inheritance and evolution: a paternal perspective on dietary influences. Prog Biophys Mol Biol. 2015;118(1–2):79–85.
- Vaiserman AM, Koliada AK, Jirtle RL. Non-genomic transmission of longevity between generations: potential mechanisms and evidence across species. Epigenetics Chromatin. 2017;10(1):38.
- Legoff L, D’Cruz SC, Tevosian S, et al. Transgenerational inheritance of environmentally induced epigenetic alterations during mammalian development. Cells. 2019;8(12):1559.
- Waterland RA. Epigenetic mechanisms and gastrointestinal development. J Pediatr. 2006;149(5 Suppl):S137–42.
- Skinner MK, Guerrero-Bosagna C. Environmental signals and transgenerational epigenetics. Epigenomics. 2009;1(1):111–117.
- Skinner MK. What is an epigenetic transgenerational phenotype? F3 or F2. Reprod Toxicol. 2008;25(1):2–6.
- Skinner MK. Environmental epigenetic transgenerational inheritance and somatic epigenetic mitotic stability. Epigenetics. 2011;6(7):838–842.
- Anway MD, Cupp AS, Uzumcu M, et al. Epigenetic transgenerational actions of endocrine disruptors and male fertility. Science. 2005;308(5727):1466–1469.
- Klastrup LK, Bak ST, Nielsen AL. The influence of paternal diet on sncRNA-mediated epigenetic inheritance. Mol Genet Genomics. 2019;294(1):1–11.
- Gapp K, Jawaid A, Sarkies P, et al. Implication of sperm RNAs in transgenerational inheritance of the effects of early trauma in mice. Nat Neurosci. 2014;17(5):667–669.
- Ben Maamar M, Sadler-Riggleman I, Beck D, et al. Epigenetic transgenerational inheritance of altered sperm histone retention sites. Sci Rep. 2018;8(1):1–10.
- Ben Maamar M, Sadler-Riggleman I, Beck D, et al. Alterations in sperm DNA methylation, non-coding RNA expression, and histone retention mediate vinclozolin-induced epigenetic transgenerational inheritance of disease. Environ Epigenet. 2018;4(2):dvy010.
- Skinner MK, Ben Maamar M, Sadler-Riggleman I, et al. Alterations in sperm DNA methylation, non-coding RNA and histone retention associate with DDT-induced epigenetic transgenerational inheritance of disease. Epigenetics Chromatin. 2018;11(1):1–24. .
- McBirney M, King SE, Pappalardo M, et al. Atrazine induced epigenetic transgenerational inheritance of disease, lean phenotype and sperm epimutation pathology biomarkers. PloS One. 2017;12(9):e0184306. .
- King SE, McBirney M, Beck D, et al. Sperm epimutation biomarkers of obesity and pathologies following DDT induced epigenetic transgenerational inheritance of disease. Environ Epigenet. 2019;5(2):dvz008.
- Nilsson E, King SE, McBirney M, et al. Vinclozolin induced epigenetic transgenerational inheritance of pathologies and sperm epimutation biomarkers for specific diseases. PloS One. 2018;13(8):e0202662. .
- Benbrook CM. Trends in glyphosate herbicide use in the United States and globally. Environ Sci Eur. 2016;28(1):3.
- Myers JP, Antoniou MN, Blumberg B, et al. Concerns over use of glyphosate-based herbicides and risks associated with exposures: a consensus statement. Environ Health. 2016;15:19.
- Davoren MJ, Schiestl RH. Glyphosate-based herbicides and cancer risk: a post-IARC decision review of potential mechanisms, policy and avenues of research. Carcinogenesis. 2018;39(10):1207–1215.
- ATSDR. Toxicological profile for glyphosate. U.S. Department of Health and Human Services, Public Health Service, Agency for Toxic Substances and Disease Registry. ATSDR.; 2019.
- Mesnage R, Defarge N, Spiroux de Vendomois J, et al. Potential toxic effects of glyphosate and its commercial formulations below regulatory limits. Food Chem Toxicol. 2015;84:133–153.
- Kubsad D, Nilsson EE, King SE, et al. Assessment of glyphosate induced epigenetic transgenerational inheritance of pathologies and sperm epimutations: generational toxicology. Sci Rep. 2019;9(1):6372.
- Mertens M, Hoss S, Neumann G, et al. Glyphosate, a chelating agent-relevant for ecological risk assessment? Environ Sci Pollut Res Int. 2018;25(6):5298–5317.
- Van Bruggen AHC, He MM, Shin K, et al. Environmental and health effects of the herbicide glyphosate. Sci Total Environ. 2018;616–617:255–268.
- Stouder C, Paoloni-Giacobino A. Transgenerational effects of the endocrine disruptor vinclozolin on the methylation pattern of imprinted genes in the mouse sperm. Reproduction. 2010;139(2):373–379.
- Guerrero-Bosagna C, Covert T, Haque MM, et al. Epigenetic transgenerational inheritance of vinclozolin induced mouse adult onset disease and associated sperm epigenome biomarkers. Reprod Toxicol. 2012;34(4):694–707. .
- Euorpean Food Safety Authority E. Conclusion on the peer review of the pesticide risk assessment of the active substance glyphosate. Efsa J. 2015;13(11):4302.
- Guerrero-Bosagna C, Settles M, Lucker B, et al. Epigenetic transgenerational actions of vinclozolin on promoter regions of the sperm epigenome. PloS One. 2010;5(9):e13100.
- Skinner MK, Guerrero-Bosagna C. Role of CpG deserts in the epigenetic transgenerational inheritance of differential DNA methylation regions. BMC Genomics. 2014;15(1):692.
- Minneci F, Piovesan D, Cozzetto D, et al. FFPred 2.0: improved homology-independent prediction of gene ontology terms for eukaryotic protein sequences. PloS One. 2013;8(5):e63754.
- Ben Maamar M, King SE, Nilsson E, et al. Epigenetic transgenerational inheritance of parent-of-origin allelic transmission of outcross pathology and sperm epimutations. Dev Biol. 2020;458(1):106–119.
- Rawla P. Epidemiology of prostate cancer. World J Oncol. 2019;10(2):63–89.
- Hales CM, Carroll MD, Fryar CD, et al. Prevalence of obesity among adults and youth: United States, 2015–2016. Hyattsville, MD: National Center for Health Statistics; 2017.
- Rathke C, Baarends WM, Awe S, et al. Chromatin dynamics during spermiogenesis. Biochim Biophys Acta. 2014;1839(3):155–168.
- Devlin B, Roeder K, Wasserman L. Analysis of multilocus models of association. Genet Epidemiol. 2003;25(1):36–47.
- Higdon R, van Belle G, Kolker E. A note on the false discovery rate and inconsistent comparisons between experiments. Bioinformatics. 2008;24(10):1225–1228.
- Yang H, Churchill G. Estimating p-values in small microarray experiments. Bioinformatics. 2007;23(1):38–43.
- Bretz F, Landgrebe J, Brunner E. Multiplicity issues in microarray experiments. Methods Inf Med. 2005;44(3):431–437.
- Jung SH. Sample size and power calculation for molecular biology studies. Methods Mol Biol. 2010;620:203–218.
- Nilsson R, Bjorkegren J, Tegner J. On reliable discovery of molecular signatures. BMC Bioinformatics. 2009;10:38.