
ABSTRACT
Micronutrients (vitamins and minerals) have been less well studied compared to macronutrients (fats, proteins, and carbohydrates) although they play important roles in growth, metabolism, and maintenance of tissues. Hence, there is growing interest to understand the influence of micronutrients across various aspects in nutritional research. In the last two decades, aquaculture feeds have been shifted to containing more plant-based materials to meet the increasing demand and maintain the sustainability in the industry. A recent whole life cycle feeding trial of Atlantic salmon (Salmo salar) with graded levels of micronutrient packages has concluded that the levels of several B-vitamins and microminerals need to be increased from the current recommendation levels for optimal growth and fish welfare when plant-based diets are used. Here, we show the effect of micronutrient supplementation on hepatic transcriptional and epigenetic regulation in a dose dependent manner. . Specifically, our aim is to reveal the mechanisms of altered cell metabolism, which results in improved growth performance by micronutrient surpluses, at gene expression and DNA methylation levels. Our results strongly indicate that micronutrient supplementation suppresses gene expression in lipid metabolism in a dose-dependent manner and broadly affects DNA methylation in cell-adhesion and cell-signalling. In particular, it increases DNA methylation levels on the acetyl-CoA carboxylase alpha promoter in a concentration-dependent manner, which further suggests that acetyl-CoA carboxylase alpha is an upstream epigenetic regulator controlling its downstream lipid biosynthesis activities. This study demonstrates a comprehensive analysis to reveal an important role of micronutrients in lipid metabolism through epigenetic control of gene expression.
Introduction
Micronutrient status is a major environmental variable to increase growth performance and long-term phenotypic changes [Citation1,Citation2]. A deficiency in dietary micronutrients has various health consequences, such as risks of morbidity and even mortality, that are highly linked to a world-wide problem known as hidden hunger for humans [Citation3]. As fish are a rich source of micronutrients [Citation4], achieving a sustainable development of aquaculture that aims to produce healthy and nutritiousfish is important to tackle human micronutrient deficiencies but also a key factor for healthy growth for aquaculture species like Atlanticsalmon (Salmo salar).
The rapid expansion of the salmon farming industry over the last two decades has led to an increased demand for sustainable protein and lipid sources to replace traditional marine-based ingredients in aquafeeds [Citation5]. As a consequence, fish meal and fish oil have been progressively replaced with plant meal and plant oil in salmon feed [Citation6,Citation7]. For instance, the level of plant ingredients utilized in Norwegian salmon feed has increased from 9.5% (9.5% starch) in 1990 to 71.1% (10.6% starch, 20.2% plant oil, and 40.3% plant protein) in 2016 [Citation8]. This shift of ingredients has led to subsequent changes in the composition and contents of micronutrients in salmon feed [Citation9,Citation10]. In addition, plant ingredients often contain anti-nutrient compounds that prevent efficient absorption of micronutrients in fish [Citation11], which may cause potential nutrient deficiencies even though the feed composition satisfies the required level of micronutrients. In this regard, the recommendations for optimal levels of micronutrients have been re-evaluated for salmon feed by taking account of plant ingredients along with the nutrient package containing premixed vitamins and minerals [Citation12–15].
Vitamins and minerals as micronutrients are a diverse group of bioactive compounds required in tiny amounts to regulate cellular structure and metabolism. For instance, they can work as co-factors of essential enzymes for growth, immune responses, and energy expenditure [Citation16]. Key micronutrients associated with growth performance are vitamin B6, vitamin B12, and folate (vitamin B9) [Citation17] that together comprise part of the one-carbon (1 C) nutrients [Citation18]. In contrast to other micronutrients, 1 C nutrients showed significant influence on growth performance in zebrafish [Citation17] and salmon [Citation12–15] feeding trials. Moreover, the 1 C nutrients are primary components of the 1 C metabolism, which influences different developmental stages and conditions, such as embryonic development, cancer, and neurodegenerative diseases [Citation18–20]. The 1 C metabolism supports S-adenosyl methionine (SAM), a universal methyl donor, that can transfer a methyl group to various reactions where methylation occurs, including the cytosine within a CpG site for DNA methylation [Citation21].
DNA methylation is an epigenetic regulatory mechanism that interacts with environmental stimuli to control cell stability, differentiation, and development [Citation16,Citation18]. As DNA methylation is transmitted and inherited during cell replication, it may contribute to long-term gene regulatory alterations [Citation22]. DNA methylation regulates gene transcription especially when it is located in promoter regions [Citation23,Citation24]. Moreover, DNA methylation is highly associated with histone modifications [Citation25], which also play an important role in epigenetic mechanisms as a result of alternating chromatin structure. For instance, H3K4me3, which represents the tri-methylation at the fourth lysine residue of the histone H3, is enriched at active promoters near transcription start sites (TSSs) [Citation26].
Here, the aim of our study is to bridge nutrition, metabolism, genetics, and epigenetics by analysing multiple data sources from a whole life cycle feeding trial (~54 weeks) of Atlantic salmon [Citation15]. In this trial, fish were split into three dietary groups and fed with graded levels of a nutrient package (NP). Based on the recommendation level for Atlantic salmon [Citation12–14,Citation27], the NP contains 24 micronutrient components, including 13 vitamins, eight minerals, two crystalline amino acids, and cholesterol. The feed for the control group contains 1x NP, whereas the feed for the other two treatment groups contains 2x and 4x NPs. Furthermore, the formulation of the feed mainly consists of plant-based ingredients by replacing conventional fish meal (FM) and fish oil (FO) based ingredients. During the course of the trial, the proportions of micronutrient levels were maintained in a graded manner even though the other factors, such as pellet sizes and FM/FO inclusion rates, altered. Vera and colleagues summarized the main outcome of the trial regarding optimal micronutrient levels, fish growth, and fish welfare [Citation15], and they recommended that the levels of several B-vitamins (niacin, riboflavin, and cobalamin) and microminerals (zinc and selenium) should be increased from the widely used NRC (National Research Council) recommended levels [Citation27] for optimal growth and fish welfare when the feed includes high rates of plant-based ingredients. Hence, the present study focuses on providing insights into genetic and epigenetic regulations potentially influenced by these micronutrient surpluses.
To evaluate which genes and pathways might be under epigenetic regulations by micronutrient supplementation, we measured gene expression using RNA sequencing (RNA-seq) and DNA methylation using reduced representation bisulphite sequencing (RRBS) [Citation28]. The present study revealed the effect of micronutrients in salmon feed on transcriptional and epigenetic gene regulation in various regulatory pathways mainly in lipid metabolism. Due to the fact that our experimental feeds were formulated by three graded levels, we could effectively interpret the gradient patterns of gene expression and DNA methylation, which enabled us to produce more robust outcomes than dealing with only two experimental groups. We believe our results contribute to understanding the long term and potentially trans-generational effects of micronutrients, which would be critical knowledge for the sustainable development within the salmon farming industry as well as across a wide range of fields in nutritional research.
Results
Manufactured diets for our feeding trial show graded concentrations of micronutrient
The feeding trial was implemented by allocating triplicate groups of parr, through smoltification, to final harvest stage ()). The three feeding groups were fed L1, L2, and L3 diets with graded levels of micronutrient supplementation throughout the experiment ()). L1 contained 100% of the recommended level [Citation12–14,Citation27], whereas L2 and L3, respectively, contained twice (200%) and four times (400%) of the recommended level (Supplementary Table 1). The inclusion of plant raw materials progressively increased, while marine-based ingredients decreased from 23% at smolt to 8% at final harvest (Supplementary Tables 2 & 3), which resembles a current common practice in the farmed salmon industry.
Figure 1. Fish fed L2 and L3 diets show better growth at smolt and final harvest in a whole life cycle feeding trail. (a) The schematic diagram shows the experimental outline of this study. The diagram includes the trial duration, experimental groups with types of the feed given throughout the trial, pellet sizes, the inclusions of fish mean and fish oil, and sampling points where we performed different analyses. (b) Two bar plots show the mean body weights for L1, L2 and L3 at smolt and final harvest. Letters indicate significant groups (p < 0.05, one-way ANOVA) by the compact letter display of Tukey’s HSD
To investigate the actual concentrations of micronutrient in manufacture diets, we selected over 20 micronutrients from the NP and analysed them in the diet of pellet size 3.5 mm. We calculated the concentration ratios of L2 and L3 based on L1 so that the absolute ratios would be 2 (200%) for L2/L1 and 4 (400%) for L3/L1 if only NP nutrients were considered without the base ingredients. The results confirmed that all micronutrients in L1 were in a range of recommended levels (Supplementary Table 4), while L2 and L3 showed gradient concentration levels as expected (Supplementary Figure 1).
Atlantic salmon fed micronutrient-rich diets show improved growth
To measure the growth performance by diet, we calculated average body weights at two sampling points ()). At smolt, all the diet groups were significantly different among each other, with L2 showing the best growth in terms of weight gain (~113% in average compared to L1) followed by L3 (~109% compared to L1). At harvest, both L2 and L3 showed significantly better growth (~112% for both L2 and L3) than L1 (Supplementary Table 5).
Apart from the body weight, we also analysed three additional measures – mortality, hepatosomatic index (HSI), and Fulton’s condition factor (K) at the same sampling points (Supplementary Table 5). HSI is an indirect predictor of energy reserve in liver as calculated from the relative liver weight [Citation29]. Condition factor (K) is an indicator of health calculated from the body weight and length [Citation30] that has a high positive correlation with total body lipid [Citation31]. Firstly, there were no significant mortality differences between diet groups throughout the experiment. Secondly, L1 had a significantly higher HSI than L2 and L3 at smolt, suggesting L1 retained more energy in the liver than L2 and L3 before sea transfer. A potential explanation is that liver cells store excess energy as fat when micronutrients were barely sufficient. Finally, condition factor (K) was significantly higher for L3 compared to L1, and L2 intermediary to both at final harvest.
Micronutrient supplementation affects gene expression in a concentration-dependent manner
We performed gene expression analysis on 18 male liver samples collected at final harvest, with each group having an equal number of samples (n = 6, Supplementary Table 6). Following RNA-seq sample pre-processing, we examined overall gene expression patterns. A principal component analysis (PCA) on the top 500 high variance genes, which were selected to eliminate potential noises, clearly showed three clusters by diet on the first component ()). Specifically, L1 and L3 were distinctly separated with L2 being intermediary. A further PCA using all of the genes still showed a similar separation pattern although clusters were less distinct (Supplementary Figure 2).
Figure 2. Both L2 and L3 diet significantly affect gene expression but L3:L1 show more DEGs than L2:L1. a) The PCA bi-plot shows top 500 high variance genes of RNA-seq counts with VST (variance stabilization transformation). The three diet groups are indicated by colours as red for L1, green for L2 and blue for L3. b) and c) Two volcano plots show log2 fold changes vs -log10 adjusted p-values for L2:L1 and L3:L1. Gene symbols (when available) are shown for the genes with -log10 adjusted p-value > 3 for L2:L1 and -log10 adjusted p-value > 10 for L3:L1
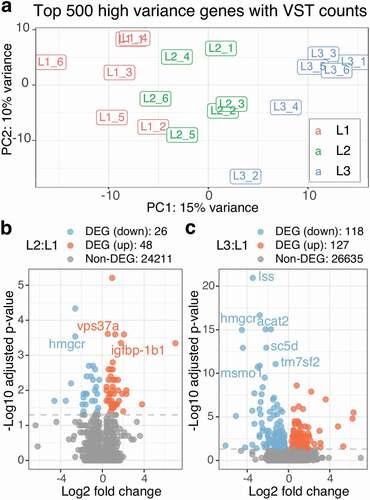
To evaluate the effect of micronutrient supplementation on each gene, we calculated the differences in gene expression as log fold changes (LFCs) along with the p-values comparing both L2 and L3 against L1 as control, and subsequently denoted as L2:L1 and L3:L1 thereafter. Differential gene expression (DE) analysis revealed 74 differentially expressed genes (DEGs; adjusted p-value < 0.01) for L2:L1 ()) and 245 DEGs for L3:L1 ()). As expected from PCA, L3:L1 had more DEGs with lower p-values than L2:L1, indicating that the differences in gene expression between L1 and L3 were larger than those between L1 and L2 for most of the DEGs.
Combining the DEGs from both L2:L1 and L3:L1 resulted in 26 common DEGs (12 down-regulated and 14 up-regulated) DEGs between L2:L1 and L3:L1 (Supplementary Table 7). All 12 down-regulated DEGs showed gradient expression in a concentration-dependent manner with L2 being intermediary (L3 < L2 < L1), whereas only six out of the fourteen up-regulated DEGs showed gradient expression with L2 again intermediary (L1 < L2 < L3; Supplementary Table 7). Among them, HMG-CoA reductase (hmgcr) was one of the down-regulated DEGs with proper gene symbols (non-provisional) assigned for Atlantic salmon (, ); hmgcr regulates an early rate-limiting step of cholesterol biosynthesis pathway [Citation32].
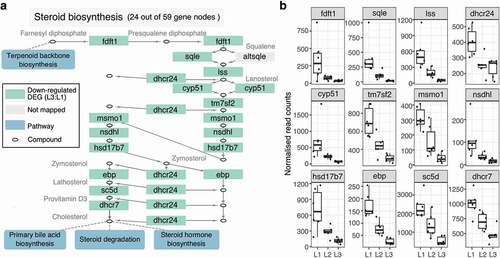
Figure 3. Micronutrient supplementation down-regulate genes in steroid biosynthesis in a concentration-dependent manner. (a) The pathway diagram is part of the KEGG steroid biosynthesis pathway (sasa00100) using only 24 out of the total 59 genes in the pathway. Green boxes represent significantly down-regulated genes in L3:L1, whereas blue rectangles represent other pathways that are connected to this steroid pathway. (b) Box plots show the normalized read counts of down-regulated genes from all individual samples. The counts were normalized with the median ratio method provided by the DESeq2 package
The results of DE analysis implied that micronutrient supplementation affected more down-regulated genes in a concentration-dependent manner than up-regulated genes, especially when the differences of gene expression were significant.
Micronutrient supplementation suppresses gene expression in the pathways related to lipid metabolism
For the functional annotation of the DEGs, we performed an over-representation analysis (ORA) with the 168 pathways annotated for Atlantic salmon in the KEGG database [Citation33]. ORA revealed one enriched pathway for L2:L1 and six enriched pathways for L3:L1 (; adjusted p-value < 0.01). The number of enriched pathways for L3:L1 increased to 16 when adjusted p-values were less than 0.05, but the number remained the same for L2:L1 (Supplementary Table 8). The enriched pathways were mostly linked to lipid metabolism for L3:L1 (Supplementary Table 9), and the steroid biosynthesis pathway (sasa00100) was enriched for both L2:L1 and L3:L1 ().
Table 1. Enriched KEGG pathways for DEGs
In addition to KEGG, we performed an ORA on the GO (gene ontology) database [Citation34], which consists of a hierarchical structure with the three root terms: cellular component (CC), biological process (BP), and molecular function (MF). ORA on GO identified three enriched terms (1 BP and 2 MFs) for L2:L1 and 52 enriched terms (4 CCs, 39 BPs, and 9 MFs) for L3:L1 (Supplementary Table 10). Moreover, the enriched BP terms had a large overlap with the enriched KEGG pathways. The most significantly enriched BP terms for L3:L1 were lipid biosynthetic process (GO:0008610) and steroid metabolic process (GO:0008202).
Along with ORA, gene set enrichment analysis (GSEA) is a popular functional annotation method that works with a set of the whole genes in the genome instead of selecting DEGs. GSEA also indicates either up-regulation or down-regulation for the detected pathways. GSEA on KEGG revealed 30 enriched pathways for L2:L1 and 49 enriched pathways for L3:L1 (Supplementary Table 11). Among them, 21 pathways were commonly enriched for both L2:L1 and L3:L1 (Supplementary Table 12). Furthermore, 8 out of the 21 common pathways were supported by ORA (). All the enriched pathways supported by both ORA and GSEA had negative NESs (normalized enrichment scores), which indicates that most of the genes involved in the detected pathways were down-regulated in L2 and L3 when compared to the corresponding genes in L1.
From the results of functional annotation, we concluded that micronutrient supplementation significantly suppressed hepatic expression of genes involved in pathways related to lipid metabolism.
Most genes in the enriched pathways show gradient gene expression patterns
To explore the enriched pathways in depth, we first examined the expression pattern of the genes involved in the steroid biosynthesis pathway (sasa00100). We selected a sub-pathway that partially consists of 24 nodes out of the total 59 nodes (Supplementary Figure 3), where all but one node (altsqle) had corresponding orthologues for Atlantic salmon ()), which were further trimmed down to 12 non-redundant genes ()). All 12 genes were significantly down-regulated in L3:L1 and had a clear gradient expression pattern as L2 being intermediary (L3 < L2 < L1), except dhcr24 ()).
In addition to the steroid biosynthesis pathway, we investigated other five enriched pathways identified by ORA (adjusted p-value < 0.01) with a full GSEA support (both L2:L1 and L3:L1; terpenoid backbone biosynthesis, fatty acid metabolism, and carbon metabolism; Supplementary Figure 3–5) and partial GSEA support (either L2:L1 or L3:L1; PPAR signalling pathway and pyruvate metabolism; Supplementary Figures 6 & 7). Among the total of 35 genes associated with the five pathways, almost all the down-regulated genes (28 out of 29) showed clear gradient expression with L2 being intermediary (L3 < L2 < L1), whereas two-thirds of the up-regulated genes (4 out of 6) showed clear gradient expression with L2 being intermediary (L1 < L2 < L3).
The results from the individual gene expression analysis strongly indicated that micronutrient supplementation affected hepatic gene expression in multiple pathways related to lipid metabolism, mainly by L3 having the lowest expression level followed by L2 and then L1.
Experimental groups show no distinct clustering when all the mapped CpGs were used
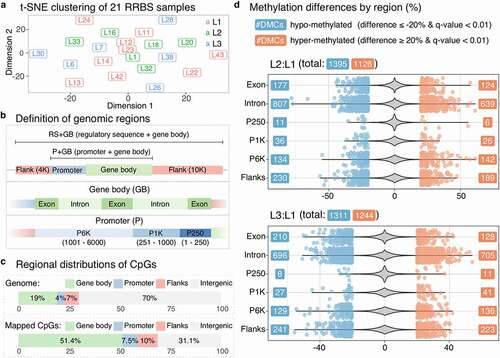
To analyse the effects of micronutrient supplementation on DNA methylation patterns, we used 21 liver samples collected at final harvest, with L1 having 9 samples, and L2 and L3 having 6 samples each (Supplementary Table 13). These samples were from both male and female fish, while the RNA-seq samples were from male fish. After RRBS sample pre-processing, we used a non-linear dimensionality reduction method, called t-SNE (t-distributed stochastic neighbour embedding), to find whether any overall methylation patterns could be observed when all the mapped CpGs with methylation call were used. The result of t-SNE showed no distinct clusters by diet ()), which was further supported by linear clustering methods, including PCA, hierarchical clustering, and correlation analysis (Supplementary Figure 9). To test a potential confounding factor caused by mixing male and female samples, we again used t-SNE and PCA but with sex instead of diet for labelling samples, which also resulted in no distinct separation (Supplementary Figure 10). Moreover, there were no clear differences of the methylation rates between the diet groups as the average rate was approximately 84% for all of them (Supplementary Table 13). Thereafter, we directed our attention towards investigating DNA methylation patterns in a more region-specific manner rather than focusing on the overall methylation pattern using all the mapped CpGs.
Figure 4. Micronutrient supplementation affects DNA methylation profiles in mRNAs and their regulatory sequences. (a) The t-SNE plot shows clustering of 21 RRBS samples with the three diet groups indicated by colours as red for L1, green for L2, and blue for L3. The perplexity parameter was set to 2. (b) Definition of the genomic regions used in our study. (c) Four stacked bars show the percentages of regional distributions of mapped CpGs in gene bodies and promoters. (d) Two violin plots show the density of overall methylation differences for L2:L1 and L3:L1 with scattered dots indicating the values of the significantly methylated CpG sites (q-value < 0.01 and the percentage methylation difference ≥ 20%)
mRNAs and their surroundings have a higher RRBS coverage than intergenic regions
RRBS fragments represent only part of the whole genome and mainly originate from CpG rich regions. To identify the original locations of the RRBS fragments, especially within mRNAs and their surroundings, we defined three regions in the genome; regulatory sequence (RS), promoter (P), and gene body (GB), which were further divided into six sub-regions; flanks (flanking regions both 10 K upstream and downstream around mRNAs), P250 (promoter region between 1 bp and 250 bp upstream from the TSS), P1K (promoter region between 251 bp and 1 K bp), P6K (promoter region between 1001 bp and 6 K bp), exon, and intron ()). Flanks were for covering enhancer regions, whereas P250 and P6K were, respectively, for proximal and distal promoters. In addition, we defined the remaining part of the genome outside of the sub-regions as intergenic. All the regions and sub-regions satisfied non-redundant representation for all the positions in the genome as a site in the genome always has only one corresponding region or sub-region.
The proportion of the mapped CpGs increased from the original proportion of 30% (19% gene body, 4% promoter, and 7% flanks) to 68.9% (51.4% gene body, 7.5% promoter, and 10% flanks) in mRNAs and their surroundings ()). Among the sub-regions, introns showed the highest coverage (39.9%), followed by exons (11.6%) and then flanks (10%). The odds ratios (ORs) of all the sub-regions except for intergenic showed significant enrichment compared to the original proportions (Supplementary Table 14), indicating that mRNAs and their surroundings had a higher RRBS coverage than intergenic regions.
In addition to regional representations of RRBS fragments, average methylation rates were also noticeably various among different regions (Supplementary Figure 11), which was ranged from the lowest for P250 (~23%) followed by P1K (~57%) and to the highest for intergenic (~87.7%). The rate of exons (~76%) was lower than that of P6K (~83.5%) because first exons near the TSS tend to have lower methylation rates.
Even though DNA methylation in intergenic regions has important roles to suppress the expression of potentially harmful genetic elements, such as transposons [Citation22], it would convey little information about the epigenetic regulations on protein-coding genes. Therefore, throughout the subsequent RRBS analyses, we used the CpG sites with methylation calling from mRNAs and their surroundings.
The overall influence of regional DNA methylation appears to be similar between L2 and L3 diets
We defined differentially methylated CpG sites (DMCs) with a logistic regression model [Citation35,Citation36], again based on L1 as control, when a CpG site with methylation call had a q-value lower than 0.01 and the difference of methylation rates equal to or larger than 20% between dietary groups. Moreover, DMCs were distinguished either hypo-methylated or hyper-methylated depending on either negative or positive methylation differences based on L1.
As expected from the t-SNE analysis, the number of DMCs was similar between L2:L1 and L3:L1 as well as having the balanced number of hypo-methylated and hyper-methylated sites ()). Even when divided into the six sub-regions, the distributions of DMCs remained similar between L2:L1 and L3:L1 ()). Although promoter regions were under-represented regarding the number of DMCs, they appeared to have significantly more DMCs than the original proportion among the mapped regions (Supplementary Table 15).
The analysis of DMC distributions inferred that micronutrient-rich diets affected regional methylation pattern in liver when the differences of methylation rates were significant, but the graded micronutrient levels seemed to have limited impact on the pattern.
Micronutrient supplementation affects the DNA methylation patterns in the pathways related to to cell adhesion and cell signalling
To perform functional annotation with CpG methylation call, we defined differentially methylated genes (DMGs) as protein-coding genes that contained at least one DMC. ORA with DMGs on KEGG revealed five enriched pathways for L2:L1 and two enriched pathways for L3:L1 (). Most enriched KEGG pathways were associated with cell adhesion and cell signalling mainly through DMCs in gene bodies. Moreover, ORA on GO resulted in 18 enriched terms (2 CCs, 10 BPs, and 6 MFs) for L2:L1 (Supplementary Table 16) and 22 enriched terms (6 CCs, 8 BPs, and 8 MFs) for L3:L1 (Supplementary Table 17). Similarly, most of the enriched GO terms were associated with cell adhesion (cell-cell adhesion, GO:0098609) and cell signalling (cell-cell signalling, GO:0007267).
Table 2. Enriched KEGG pathways for DMGs
To use all available methylation data like GSEA in gene expression analysis, we used Wilcoxon signed rank test (Wilcox) to compare two groups of methylation rates in a pair-wise manner and also Bootstrap Kolmogorov–Smirnov test (KS-boot) to compare sets of methylation differences against background distribution (see Supplementary Methods for details with examples). A combined result from both Wilcox and KS-boot revealed two enriched pathways for L2:L1 and three enriched pathways for L3:L1 ().
Only cell-adhesion molecules (CAMs; sasa04514 & GO:0098609) were detected by all the four methods. In gene expression analysis, GSEA on KEGG showed CAMs as significantly up-regulated pathway both in L2:L1 and L3:L1 (Supplementary Table 11). Nonetheless, unlike the gene expression result, CAMs had no clear methylation trends regarding either hypo- or hyper-methylation.
The functional annotation results suggested that micronutrient-rich diets affected pathways related to cell adhesion and cell signalling mainly through the CpG sites in gene bodies, but the involved CpG sites showed both higher or lower methylation rates compared to L1.
Combing the DMCs from L2:L1 and L3:L1 has identified five common DMGs strongly affected by both L2 and L3 diets
Combining the DMCs from both L2:L1 and L3:L1 in a region-specific manner resulted in 319 common DMGs (Supplementary Table 18), which were further filtered to 31 DMGs with at least two common DMCs in the same region type (Supplementary Table 19) and similarly five common DMGs with more than two common DMCs (, ). Like the functional annotation of DMGs, all five DMGs were linked to GO terms related to signalling, synapse, and immune response (Supplementary Table 20). The five common DMGs showed a consistent number of hypo- and hyper-methylated DMCs between L2:L1 and L3:L1 ().
Table 3. DMGs with at least three common DMCs between L2:L1 and L3:L1
Table 4. List of 10 DEGs that contain at least one DMCs
Among them, the gene CD28 (T-cell-specific surface glycoprotein CD28-like, LOC106574316), which is involved in T-cell activation, proliferation, and survival, contained five common hyper-methylated DMCs in its P6K (). Although the gene expression of CD28 showed no significant differences for L2:L1 and L3:L1, all the common DMCs showed gradient methylation rates with L2 being intermediary (L1 < L2 < L3; Supplementary Figure 12), suggesting that micronutrient supplementation influenced DNA methylation of CD28 in a concentration-dependent manner.
Linking DEGs with DMCs has identified multiple genes whose gene expression and DNA methylation are under the influence of micronutrient supplementation
To identify the effect of micronutrient supplementation on both gene expression and DNA methylation, we merged DEGs with DMCs, which resulted in 10 DEGs that contain at least one DMC within their gene body and its surroundings (). We subsequently selected three genes as candidates for further analysis.
Firstly, sqle (squalene monooxygenase-like, LOC106605546) squalene monooxygenase-like, which is involved in the steroid biosynthesis pathway (sasa00100), contains a hypo-methylated DMC in its promoter for L2:L1. The expression of sqle, however, showed down-regulation instead of up-regulation, which is inconsistent with the common gene regulation by DNA methylation in promoter regions [Citation37].
Secondly, KIAA0825 ortholog (kiaa0825) contains three hyper- and one hypo-methylated DMCs in its introns. The methylation level of the first intron is known to have inverse association with gene expression [Citation38]. Nonetheless, none of the four DMCs resides in the first intron of kiaa0825.
Finally, acetyl-CoA carboxylase alpha (acaca) has multiple DMCs in its promoter region. Also, acaca is part of the pyruvate metabolism (sasa00620) enriched in L1:L2 and fatty acid metabolism (sasa01212) enriched in both L2:L1 and L3:L1 (). The gene expression of acaca was significantly down-regulated in L3:L1 while all of the DMCs were hyper-methylated, which matches with a well-studied gene regulation by DNA methylation in promoter regions [Citation37]. Thus, we specifically targeted acaca to understand the potential effect of micronutrient supplementation on epigenetic regulation.
Micronutrient supplementation affects gene expression and DNA methylation of acetyl-CoA carboxylase alpha (acaca) in a concentration-dependent manner
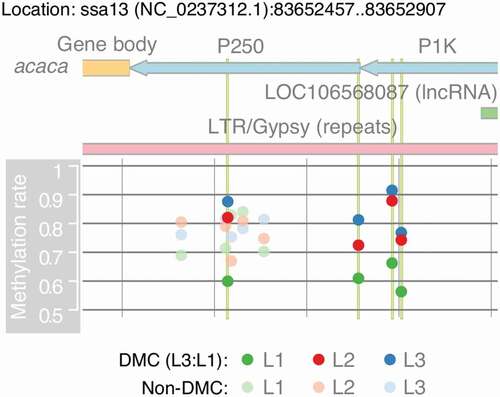
acaca is an enzyme that catalyses the initiation of fatty acid biosynthesis by converting acetyl-CoA to malonyl-CoA [Citation39]. It encodes a long primary transcript (60031 bp), with having one long non-coding RNA (lncRNA; LOC106568087) in the opposite strand of the promoter region (). The lncRNA LOC106568087 is completely covered by a long terminal repeat (LTR) retrotransposon (), suggesting that the gene may have similar functionality of retrotransposon. The lncRNA and acaca may share a bidirectional promoter although LOC106568087 had no expression detected in our liver samples.
Figure 5. Micronutrient supplementation affect DNA methylation in the promoter region of acetyl-CoA carboxylase alpha(acaca) in a concentration-dependent manner. The region contains the 3′ end of acaca and part of its promoter region. It shows four significantly methylated genes that are highlighted in vertical green lines. Methylation rates are calculated as the average rates separately for L1, L2, and L3. The region also contains part of a long tandem repeat (gypsy) and a long non-coding RNA (LOC106568087)
Both ChIP-seq (chromatin immunoprecipitation sequencing) and ATAC-seq (assay for transposase-accessible chromatin using sequencing) [Citation40] identified that the first intron of acaca has peaks of H3K4me3 makers. The peaks are outside of its promoter region, but they are still located at around 6300 bp downstream from the TSS (Supplementary Figure 13).
Although acaca was not a DEG in L2:L1, the gene expression of acaca showed gradient expression with L2 being intermediary (L3 < L2 < L1). In addition, acaca is involved in fatty acid metabolism (sasa01212), where all of the eight DEGs in L3:L1 including acaca had gradient expression with L2 being intermediary (L3 < L2 < L1; Supplementary Figure 5), which was further supported by NESs of GSEA () as L3:L1 (−2.2) < L2:L1 (−1.7). Conversely, DNA methylation rates of all the four DMCs in L3:L1 for acaca showed gradient methylation rates of L1 < L2 < L3 (). Moreover, three out of these four CpG sites had significantly higher methylation rates in L2 compared to L1, but their methylation differences were slightly lower than 20% at 19.8%, 18.9%, and 17.5% (Supplementary Table 20). Thus, the gradient patterns infer that micronutrient supplementation affects gene expression and DNA methylation of acaca in a concentration-dependent manner.
Discussion
We show for the first time that graded levels of supplemented micronutrient through a whole life feeding trial have gradient effect on suppression of gene expression in lipid biosynthesis and increment of DNA methylation in the promoter of acetyl-CoA carboxylase alpha (acaca), which encodes the enzyme acetyl-CoA (ACC). ACC catalyses the first crucial step of fatty acid metabolism in vertebrates, and its activity is complex and versatile, including phosphorylation, allosteric regulation, and protein–protein interaction [Citation41].
In mammals, multiple promoters are known to initiate the transcription of acaca [Citation42]. For example, in cattle, four promoters (PI, PIA, PII, and PIII) have been identified for acaca [Citation43]. Among them, PIA is tissue specific as it is active in liver, adipose tissue, and mammary gland. Intriguingly, PIA can be nutritionally controlled as observed in human and rat [Citation44]. Furthermore, in sheep, PI is a GC-rich bidirectional promoter shared between acaca and another gene, transcriptional adaptor 2A (TADA2L), which encodes a component of chromatin-modifying complexes [Citation45]. Thus, micronutrient supplementation might alternate the isoforms of acaca through DNA methylation in its promoter and also potentially reform the chromatin structure around the TSS, which collectively could affect its direct downstream regulation of lipid biosynthesis.
High macronutrient intakes with low micronutrients are associated with overweight and obesity [Citation46], and alternated DNA methylation of acaca is also linked with obesity and diabetes [Citation47]. A study using human liver samples showed that an ATF (activating transcription factor) binding site in ACACA was significantly hypo-methylated for both ‘obese with non-diabetic’ and ‘type 2 diabetic’ groups compared to the non-obese group [Citation47]. The regulation of lipid metabolism is highly conserved among vertebrates, and as such further studies need to verify if our findings could relate to a world-wide problem of micronutrient deficiencies [Citation3] as well as the increasing burden faced by ever-rising rates of obesity.
Apart from acaca, micronutrient supplementation also affected DNA methylation among genes associated with cell-adhesion and cell-signalling mainly through their gene bodies. The detailed mechanism of DNA methylation on cell-adhesion is unknown. Nonetheless, a human blood epigenome study reported that the improved quality of diets and physical activities affected DNA methylation patterns of the genes related to cell-adhesion via plasma-membrane [Citation48]. A feeding trial that evaluated the effect of two different selenium supplements in rainbow trout (Oncorhynchus mykiss) also reported that diets with enriched selenium affected DNA methylation patterns in cell-adhesion [Citation49]. Hence, many genes involved in cell adhesion may epigenetically respond to different nutrient status via DNA methylation in their gene bodies. Although the function of DNA methylation in gene bodies remains largely unclear, evidence suggests that methylation rates in gene bodies are positively correlated with gene expression especially in highly dividing cells [Citation22]. Also, DNA methylation in gene bodies can be involved in splicing regulation [Citation50]. In the transcriptome analysis, GSEA revealed that micronutrient supplementation significantly up-regulated gene expression in cell-adhesion and cell-signalling. Hence, micronutrient supplementation may contribute to up-regulation of several genes involved in cell-adhesion and cell-signalling through alternated DNA methylation in their exons and introns.
Several genes have multiple common DMCs clustered within a short distance. Such clusters are potential candidates of differentially methylation regions (DMRs), whose status are strongly associated with specific development stages and reprogrammed progresses [Citation51]. For instance, CD28 (LOC106574316) has a DMR in the distal promoter region (PK6), where four common DMCs are located within a range of 50 bp. Although the gene expression of CD28 was non-significant both in L2:L1 and L3:L1, the gene could be under epigenetic regulation influenced by micronutrients in other tissues or developmental stages.
The results of functional annotation between RNA-seq and RRBS showed less overlap than expected. One possible explanation is that the methylome detected by RRBS is less comprehensive than the transcriptome detected by RNA-seq. RRBS represents only CpG rich regions in the genome with having strong dependencies on the restriction enzymes. Many genes in lipid metabolism could be under the influence of DNA methylation; nonetheless, RRBS might have failed to detect them since they lack restriction enzyme sites. Development of a tool that can detect the coverage of restriction enzyme sites can be beneficial to RRBS experiments especially for studies with non-model organisms as the distributions of restriction enzyme sites are species specific. Another issue related to DNA methylation studies is that one gene may have multiple DNA methylation statuses spreading over the gene body and its vicinity. In this regard, a gene could be simultaneously associated with both hypo- and hyper-methylation.
In addition to species-specific distributions of restriction sites and multiple methylation status per gene, we encountered serval other obstacles during our RRBS analysis. The Atlantic salmon genome contains a number of duplicated genes through the salmonid whole genome duplication event as well as a high coverage of repeated sequences, estimated approximately 60% of the whole genome [Citation52]. These duplicated and repeated sequences could be negative factors for accurate read alignments of sequence data. The average percentage of uniquely aligned reads was around 47% for our liver samples. Development of an algorithm that utilizes the reads mapped on multiple locations could be beneficial to enhance the CpG coverage for RRBS studies with salmonids. Furthermore, our original experimental design for RRBS was to analyse the same liver samples used for RNA-seq. Some of the male liver samples for RRBS, however, failed to pass our quality control screening, which led to our decision to add extra female liver samples that would decrease potential false positives. Among them, nine male samples are originated from the same fish used in RNA-seq (Supplementary Table 22). Adding extra 12 female samples considerably reduced the number of DMCs approximately from 20 000 to 2 500 (Supplementary Table 23). We extensively performed correlation and clustering analyses (for instance, Supplementary Figure 10) to ensure that extra female samples could be added without causing a batch effect.
To gain a better understanding of epigenetic regulations associated with micronutrients in metabolic pathways, it is crucial to analyse the data from different perspectives, to be aware of the species-specific limitations of RRBS, and to compare the data between multiple species as well as other tissue types. To serve as resources for further studies, we provide nine different data sets with annotated information for DEGs, DMCs, and DMGs in spreadsheets (see Data availability).
Conclusion
Our main aim was to elucidate the effect of micronutrient supplementation in Atlantic salmon feed by combining results of growth performance, gene expression profiles, and DNA methylation patterns. Using three experimental groups with graded levels of micronutrients helped to interpret the results of gradient patterns encountered in multiple analyses. To conclude, we show that micronutrient supplementation suppresses liver gene expression in the pathways related to lipid metabolism and increases the methylation rates in the acaca gene, which is involved in the upstream regulation of the lipid biosynthesis pathway.
Materials and methods
Ethical considerations
All experimental procedures and husbandry practices were conducted in compliance with the Animals Scientific Procedures Act 1986 (Home Office Code of Practice) in accordance with EU regulation (EC Directive 86/609/EEC) and approved by the Animal Ethics and Welfare Committee of the University of Stirling. All fish were monitored daily by the Named Animal Care and Welfare Officer (NACWO).
Fish and experimental diets
The trial was carried out with Atlantic salmon obtained from SalmoBreed AS (Norway). Feeds were formulated to reflect standard practice in commercial salmon feeds in terms of protein, oil and energy contents. Also, feeds were supplemented with a nutrient package (NP) based on the given requirement levels reported for Atlantic salmon according to the EU-funded ARRAINA project [Citation12,Citation13,Citation15]. The NP contains 24 micronutrient components, including 13 vitamins (A, B1, B2, B3, B5, B6, B7, B9, B12, C, D3, E, and K3), eight minerals (Ca, Co, I, Se, Fe, Mn, Cu, and Zn), two crystalline amino acids (L-taurine and histidine), and cholesterol. Three diet treatments with different levels of NP content were prepared as L1 with 100% NP, L2 with 200% NP, and L3 with 400% NP (Supplementary Table 1). All feeds were produced at the BioMar Tech-Centre (Brande, Denmark). See Supplementary methods and materials for more details.
Micronutrient analysis of experimental diets
Micronutrient analysis was performed by several different technologies and methods as described previously [Citation53]. Vitamins were determined by microbiological methods and high-performance liquid chromatography (HPLC), whereas minerals were determined by inductively coupled plasma mass spectrometry (ICP-MS). See Supplementary Methods for more details.
Feeding trial
The freshwater phase was carried out at the Niall Bromage Freshwater Research Facility (Stirlingshire, UK). Initially, 500 diploid salmon parr (initial mean weight, 38.2 ± 5.8 g) were stocked (September 2014) into nine 1.6 m3 circular fibreglass tanks (3 tanks/diet). Fish were fed continuously during the light period of the light/dark cycle by automatic feeders (Arvotec T2000, Arvotec, Finland).
Post-smolts were transferred (November 2014) to the Marine Harvest (Mowi) Feed Trial Unit (Ardnish, Scotland) and on-grown for 12 months in 5 x 5 × 5 m sea pens under natural photoperiod and ambient water temperatures ranging from 6 to 16 °C. Triplicate groups of 250 post-smolts from respective tanks were stocked per pen and on-grown to a final size of ~3.0 Kg. Fish were fed continuously during daylight by automatic feeders (Arvotec T2000) with automatic feed collection to ensure fish were fed to satiation. See Supplementary Methods for more details.
Measurement of growth and morphometric indices
For body weights and fork lengths, all fish per pen were individually measured. Following measurement, all fish were allowed to recover in aerated water before returning to their original experimental pens. Fulton’s condition factor (K) was calculated using: K = (W * 100)/L3 where W is body weight (g) and L is fork length (mm). Hepatosomatic index (HSI) was calculated as liver weight (g)/body weight (g) * 100.
DNA and RNA extraction
At the end of the feeding trial, liver tissue for both RNA and DNA extraction was dissected from the same area of each individual and snap frozen in liquid nitrogen. DNA and RNA were extracted from the same fish. For both RNA and DNA extraction, tissue samples were homogenized using ceramic beads. See Supplementary Methods for more details.
RNA-seq library preparation and sequencing
RNA-sequencing (RNA-seq) was performed by the DeepSeq sequencing facility at Nord University, Bodø, Norway. RNA-seq library preparation was completed using an NEBNext Ultra II Directional RNA Library Prep Kit for Illumina using the manufacturer protocol and workflow (New England Biolabs). Libraries were ligated with four primers using NEBNext Multiplex Oligos for Illumina Index Primer Sets 1, 2, 3 and 4. Samples were multiplexed into two pools of nine samples, with multiplexing barcodes ligated to each sample during the PCR amplification step, and further sequenced on the NextSeq500 machine (Illumina).
RRBS library preparation and sequencing
Extracted genomic DNA was digested by MspI and TaqI prior to size selection and bisulphite conversion. RRBS libraries were sequenced on Illumina HiSeq 3000/4000 instruments. See Supplementary Methods for more details.
Atlantic salmon genome and genomic annotation
The reference sequence data (ICSASG version 2) were downloaded from the NCBI assembly site (https://www.ncbi.nlm.nih.gov/assembly/GCF_000233375.1).
Multiple mRNAs with alternative splicing were filtered to keep only one transcript with the longest length for RRBS. Promoter region was split into three sub-regions based on the distance from the transcription start site (TSS) as P250 (1–250), P1K (251–1 K) and P6K (1001–6 K). Flanking regions (flanks) were defined as 5 K upstream from the 5′ end of P6Ks and 10 K downstream of the 3′ end of mRNAs. Non-annotated sites were categorized as intergenic. In case of overlapping, a site is assigned to the sub-region with a higher precedence as exon > intron > P250 > P1K > P6K > flanks > intergenic.
Quality trimming, alignment and quantification of RNA-seq reads
Adaptors, low-quality bases, low-quality reads (phred scores < Q30) and reads less than 20 bases in length were trimmed from sequence reads using cutadapt [Citation54]. Quality trimmed reads were aligned to the Atlantic salmon RefSeq reference genome (ICSASG version 2). HISAT2 [Citation55] was used to index the reference genome and align reads to the indexed genome. The number of reads per gene was quantified using featureCounts [Citation56], based on gene region definitions (GFF) from the ICSASG reference genome (version 2).
Differential gene expression analysis
Prior to differential expression (DE) analysis, samples were assessed for batch effects and outliers using principal component analysis (PCA) and hierarchical clustering. DE analysis was completed using the DESeq2 package [Citation57]. We adjusted the p-values by Benjamini-Hochberg and selected genes as differentially expressed genes (DEGs) when their adjusted p-values were less than 0.05.
Functional enrichment of DEGs using KEGG pathways and GO terms
The list of significant DE genes per experimental treatment was used to examine functional enrichment [Citation58] in KEGG (Kyoto Encyclopaedia of Genes and Genomes) pathways [Citation59] and GO (Gene Ontology) terms [Citation34]. For KEGG pathways, we used over representation analysis (ORA) [Citation58] and gene set enrichment analysis (GSEA) [Citation60], whereas we used only ORA for GO terms. The R package clusterProfiler [Citation61,Citation62] was used to analyse and visualize functional enrichment. We adjusted the p-values by Benjamini-Hochberg and defined function enrichment when adjusted p-values were <0.05 for ORA for KEGG and <0.01 for ORA for GO and GSEA.
Quality trimming, alignment and clustering of RRBS reads
Pooled samples were de-multiplexed by Illumina2bam tools (1.17.3; https://github.com/wtsi-npg/illumina2bam). BAM files were converted into FASTQ files by SAMtools [Citation63], and the reads quality was checked by FastQC (Barbraham Institute; https://www.babraham.ac.uk), and MultiQC [Citation64]. Adapters and low-quality reads were removed by Trim Galore! (Barbraham Institute) with the RRBS mode based on Cutadapt [Citation54]. All reads with >50 bp were trimmed down to 50 bp. In-house Python scripts were used to keep only the reads digested by MspI and TaqI (around 97% of the total reads).
Reads were aligned to the Atlantic salmon genome by Bismark [Citation65] with Bowtie 1 [Citation66]. Methylation calls at CpG sites were retrieved by using bismark_methylation_extractor and coverage2cytosine provided by Bismark [Citation65]. Reads with less than or equal to 10 and above the 99.9th percentile of coverage were discarded by methylKit [Citation35].
For clustering analysis, the tsne package obtained from CRAN (Comprehensive R Archive Network; https://cran.r-project.org) was used to perform t-SNE analysis [Citation67] with perplexity 2. The factoextra packages from CRAN were used to perform other clustering analyses: PCA, scree plots, sample-sample distance plot based on Pearson’s correlation coefficients, hierarchical clustering with Ward’s method and gap statistic [Citation68].
Differential methylation analysis
The methylKit R package [Citation35] was used to calculate percentage methylation differences with p-values for all the CpG sites with methylation calls. P-values were calculated by logistic regression [Citation35], and SLIM method [Citation36] was used to calculate q-values. DMCs were defined as the CpG sites with q-values less than 0.01 and percentage methylation differences greater than or equal to 20%.
Functional enrichment of DMCs using KEGG pathways and GO terms
We defined genes as differentially methylated genes (DMGs) if they had at least one DMCs. Enrichment analysis with KEGG [Citation59] and GO [Citation34] were performed on DMGs by the clusterProfiler R package [Citation61]. Enriched GO terms and KEGG pathways were defined by adjusted p-values <0.05.
For KEGG pathways, we used over representation analysis (ORA) [Citation58], Wilcoxon signed rank test (Wilcox) [Citation69], and Kolmogorov–Smirnov with bootstrap p-value calculation (KS boot) [Citation70], whereas we used only ORA for GO terms. See Supplementary Methods for more details about Wilcox and KS boot.
Linking DNA methylation with RNA expression
CpG sites with methylation calls were merged with corresponding mRNA expression levels by Entrez gene IDs, which we used as our internal IDs for both RNA-seq and RRBS analyses. The merged data were filtered by DMCs with 20% threshold and DEGs with adjusted p-values <0.01. The plot of the genomic features around the acaca locus was generated by the Gvis R package [Citation71].
Bioinformatics pipelines
For RNA-seq, shell and R scripts were used to develop a pipeline. For RRBS, R and Python scripts were coordinated in a pipeline by using Snakemake [Citation72].
Author contributions
K.H.S conceived and designed the genomic and epigenetic research. J.F.T. and D.R.T. conducted and designed the feeding trail. J.M.O.F., P.W. T.S. prepared RNA-seq and RRBS data. T.S., P.W., A.A., M.E. and K.H.S. analysed and interpreted data. T.S. drafted the manuscript. The authors read and approved the final manuscript.
Supplemental Material
Download PDF (2.6 MB)Acknowledgments
We thank Amelie Nemc, Bekir Ergüner, and Christoph Bock for sequencing and advice on RRBS analysis, and Hui-Shan Tung and Eva Mykkeltvedt for DNA and RNA extraction at the Institute of Marine Research (Bergen, Norway). This work was supported by the European Commission under FP7 Integrated Project No. 288925, Advanced Research Initiatives for Nutrition & Aquaculture (ARRAINA); and by the Norwegian Research Council under project no: 267787 (NutrEpi).
Disclosure statement
No potential conflict of interest was reported by the authors.
Data availability
Quality trimmed read data for both RNA-seq samples (PRJNA632591) and RRBS samples (PRJNA628740) have been uploaded to the Sequence Read Archive. As resources for further analyses, nine data sets – (i) DEGs, (ii) KEGG with DEGs, (iii) mapped CpGs (L2:L1), (iv) mapped CpGs (L3:L1), (v) DMGs, (vi) KEGG with DMGs (L2:L1), (vii) KEGG with DMGs (L3:L1), (viii) common DMGs, and (vi) DEGs with DMCs – have been uploaded to Figshare (DOI: 10.6084/m9.figshare.12481826; see Supplementary Tables 24-32 for data descriptions).
Supplementary materials
Supplemental data for this article can be accessed here.
Additional information
Funding
References
- Xu J, Sinclair KD. One-carbon metabolism and epigenetic regulation of embryo development. Reprod Fertil Dev. 2015;27(4):667–676.
- Portha B, Fournier A, Kioon MD, Mezger V, and Movassat J.Early environmental factors, alteration of epigenetic marks and metabolic disease susceptibility. Biochimie. 2014;97:1–15.
- Bailey RL, West KP Jr., Black RE. The epidemiology of global micronutrient deficiencies. Ann Nutr Metab. 2015;66(Suppl 2):22–33.
- Hicks CC, Cohen PJ, Graham NAJ, Nash KL, Allison EH, D'Lima C, Mills DJ, Roscher M, Thilsted SH, Thorne-Lyman AL, and MacNeil MA.Harnessing global fisheries to tackle micronutrient deficiencies. Nature. 2019;574(7776):95–98.
- Gatlin DM, Barrows FT, Brown P, Dabrowski K, Gaylord TG, Hardy RW, Herman E, Hu G, Krogdahl Å, Nelson R, et al. Expanding the utilization of sustainable plant products in aquafeeds: a review. Aquacult Res. 2007;38(6):551–579.
- Hardy RW. Utilization of plant proteins in fish diets: effects of global demand and supplies of fishmeal. Aquacult Res. 2010;41(5):770–776.
- Soller F, Rhodes MA, Davis DA. Replacement of fish oil with alternative lipid sources in plant-based practical feed formulations for marine shrimp (Litopenaeus vannamei) reared in outdoor ponds and tanks. Aquaculture Nutr. 2017;23(1):63–75.
- Aas TS, Ytrestoyl T, Asgard T. Utilization of feed resources in the production of Atlantic salmon (Salmo salar) in Norway: an update for 2016. Aquacult Rep. 2019;15. DOI:https://doi.org/10.1016/j.aqrep.2019.100216.
- Sissener NH, Julshamn K, Espe M, Lunestad BT, Hemre GI, Waagbo R, and Mage A. Surveillance of selected nutrients, additives and undesirables in commercial Norwegian fish feeds in the years 2000–2010. Aquaculture Nutr. 2013;19(4):555–572.
- Olsvik PA, Hemre GI, Waagbo R. Exploring early micronutrient deficiencies in rainbow Trout (Oncorhynchus mykiss) by next-generation sequencing technology–from black box to functional genomics. PLoS One. 2013;8(7):e69461.
- Krogdahl A, Penn M, Thorsen J, Refstie S, and Bakke AM. Important antinutrients in plant feedstuffs for aquaculture: an update on recent findings regarding responses in salmonids. Aquacult Res. 2010;41(3):333–344.
- Hamre K, Sissener NH, Lock EJ, Olsvik PA, Espe M, Torstensen BE, Silva J, Johansen J, Waagbo R, and Hemre GI. Antioxidant nutrition in Atlantic salmon (Salmo salar) parr and post-smolt, fed diets with high inclusion of plant ingredients and graded levels of micronutrients and selected amino acids. PeerJ. 2016;4:e2688.
- Hemre GI, Lock EJ, Olsvik PA, Hamre K, Espe M, Torstensen BE, Silva J, Hansen AC, Waagbo R, Johansen JS, Sanden M, and Sissener NH, Atlantic salmon (Salmo salar) require increased dietary levels of B-vitamins when fed diets with high inclusion of plant based ingredients. PeerJ. 2016;4:e2493.
- Prabhu AJ, Lock EJ, Hemre GI, Hamre K, Espe M, Olsvik PA, Silva J, Hansen AC, Johansen J, Sissener NH, and Waagbo R, Recommendations for dietary level of micro-minerals and vitamin D3 to Atlantic salmon (Salmo salar) parr and post-smolt when fed low fish meal diets. PeerJ. 2019;7:e6996.
- Vera LM, Hamre K, Espe M, Hemre GI, Skjærven K, Lock EJ, Prabhu AJ, Leeming D, Migaud H, Tocher DR, and Taylor JF, Higher dietary micronutrients are required to maintain optimal performance of Atlantic salmon (Salmo salar) fed a high plant material diet during the full production cycle. Aquaculture. 2020;528:735551.
- Wu S, Zhang J, Li F, Du W, Zhou X, Wan M, Fan Y, Xu X, Zhou X, Zheng L, and Zhou Y, One-carbon metabolism links nutrition intake to embryonic development via epigenetic mechanisms. Stem Cells Int. 2019;2019:3894101.
- Skjaerven KH, Jakt LM, Dahl JA, Espe M, Aanes H, Hamre K, and Fernandes JM, Parental vitamin deficiency affects the embryonic gene expression of immune-, lipid transport- and apolipoprotein genes. Sci Rep. 2016;6:34535.
- Amenyah SD, Hughes CF, Ward M, Rosborough S, Deane J, Thursby SJ, Walsh CP, Kok DE, Strain JJ, McNulty H, and Lees-Murdock DJ, Influence of nutrients involved in one-carbon metabolism on DNA methylation in adults-a systematic review and meta-analysis. Nutr Rev. 2020;78(8):647–666.
- Rush EC, Katre P, Yajnik CS. Vitamin B12: one carbon metabolism, fetal growth and programming for chronic disease. Eur J Clin Nutr. 2014;68(1):2–7.
- Liu JJ, Ward RL. Folate and one-carbon metabolism and its impact on aberrant DNA methylation in cancer. Adv Genet. 2010;71:79–121.
- Miller JW, Nadeau MR, Smith J, Smith D, and Selhub J, Folate-deficiency-induced homocysteinaemia in rats: disruption of S-adenosylmethionine’s co-ordinate regulation of homocysteine metabolism. Biochem J. 1994;298((Pt 2)):415–419.
- Moore LD, Le T, Fan G. DNA methylation and its basic function. Neuropsychopharmacology. 2013;38(1):23–38.
- Bestor TH. DNA methylation: evolution of a bacterial immune function into a regulator of gene expression and genome structure in higher eukaryotes. Philos Trans R Soc Lond B Biol Sci. 1990;326(1235):179–187.
- Bird AP. Functions for DNA methylation in vertebrates. Cold Spring Harb Symp Quant Biol. 1993;58:281–285.
- Cedar H, Bergman Y. Linking DNA methylation and histone modification: patterns and paradigms. Nat Rev Genet. 2009;10(5):295–304.
- Liang G, Lin JC, Wei V, Yoo C, Cheng JC, Nguyen CT, Weisenberger DJ, Egger G, Takai D, Gonzales FA, and Jones PA. Distinct localization of histone H3 acetylation and H3-K4 methylation to the transcription start sites in the human genome. Proc Natl Acad Sci U S A. 2004;101(19):7357–7362.
- Council NR. Nutrient requirements of fish and shrimp. National academies press; 2011.
- Meissner A, Gnirke A, Bell GW, Ramsahoye B, Lander ES, and Jaenisch R. Reduced representation bisulfite sequencing for comparative high-resolution DNA methylation analysis. Nucleic Acids Res. 2005;33(18):5868–5877.
- Chellappa S, Huntingford FA, Strang RHC, and Thomson RY. Condition factor and hepatosomatic index as estimates of energy status in male three-spined stickleback. J Fish Biol. 1995;47(5):775–787.
- Froese R. Cube law, condition factor and weight-length relationships: history, meta-analysis and recommendations. J Appl Ichthyol. 2006;22(4):241–253.
- Herbinger CM, Friars GW. Correlation between condition factor and total lipid content in Atlantic salmon, Salmo salar L., parr. Aquacult Res. 1991;22(4):527–529.
- Efeyan A, Comb WC, Sabatini DM. Nutrient-sensing mechanisms and pathways. Nature. 2015;517(7534):302–310.
- Kanehisa M, Sato Y, Morishima K. BlastKOALA and GhostKOALA: KEGG tools for functional characterization of genome and metagenome sequences. J Mol Biol. 2016;428(4):726–731.
- Ashburner M, Ball CA, Blake JA, Botstein D, Butler H, Cherry JM, Davis AP, Dolinski K, Dwight SS, Eppig JT, Harris MA, Hill DP, Issel-Tarver L, Kasarskis A, Lewis S, Matese JC, Richardson JE, Ringwald M, Rubin GM, and Sherlock G. Gene ontology: tool for the unification of biology. The gene ontology consortium. Nat Genet. 2000;25(1):25–29.
- Akalin A, Kormaksson M, Li S, Garrett-Bakelman FE, Figueroa ME, Melnick A, and Mason CE. methylKit: a comprehensive R package for the analysis of genome-wide DNA methylation profiles. Genome Biol. 2012;13(10):R87.
- Wang HQ, Tuominen LK, Tsai CJ. SLIM: a sliding linear model for estimating the proportion of true null hypotheses in datasets with dependence structures. Bioinformatics. 2011;27(2):225–231.
- Zemach A, McDaniel IE, Silva P, and Zilberman D, Genome-wide evolutionary analysis of eukaryotic DNA methylation. Science. 2010;328(5980):916–919.
- Anastasiadi D, Esteve-Codina A, Piferrer F. Consistent inverse correlation between DNA methylation of the first intron and gene expression across tissues and species. Epigenetics Chromatin. 2018;11(1):37.
- Abu-Elheiga L, Jayakumar A, Baldini A, Chirala SS, and Wakil SJ. Human acetyl-CoA carboxylase: characterization, molecular cloning, and evidence for two isoforms. Proc Natl Acad Sci U S A. 1995;92(9):4011–4015.
- Macqueen DJ, Primmer CR, Houston RD, Nowak BF, Bernatchez L, Bergseth S, Davidson WS, Gallardo-Escarate C, Goldammer T, Guiguen Y, et al. Functional Annotation of All Salmonid Genomes (FAASG): an international initiative supporting future salmonid research, conservation and aquaculture. BMC Genomics. 2017;18(1):484.
- Kim KH. Regulation of mammalian acetyl-coenzyme A carboxylase. Annu Rev Nutr. 1997;17:77–99.
- Mao J, Chirala SS, Wakil SJ. Human acetyl-CoA carboxylase 1 gene: presence of three promoters and heterogeneity at the 5ʹ-untranslated mRNA region. Proc Natl Acad Sci U S A. 2003;100(13):7515–7520.
- Shi X, Metges CC, Seyfert HM. Characterization of a far upstream located promoter expressing the acetyl-CoA carboxylase-alpha in the brain of cattle. Gene. 2013;515(2):266–271.
- Lopez-Casillas F, Ponce-Castaneda MV, Kim KH. In vivo regulation of the activity of the two promoters of the rat acetyl coenzyme-A carboxylase gene. Endocrinology. 1991;129(2):1049–1058.
- Travers MT, Cambot M, Kennedy HT, Lenoir GM, Barber MC, and Joulin V Asymmetric expression of transcripts derived from the shared promoter between the divergently oriented ACACA and TADA2L genes. Genomics. 2005;85(1):71–84.
- Garcia OP, Long KZ, Rosado JL. Impact of micronutrient deficiencies on obesity. Nutr Rev. 2009;67(10):559–572.
- Kirchner H, Sinha I, Gao H, Ruby MA, Schonke M, Lindvall JM, Barres R, Krook A, Naslund E, Dahlman-Wright K, et al. Altered DNA methylation of glycolytic and lipogenic genes in liver from obese and type 2 diabetic patients. Mol Metab. 2016;5(3):171–183.
- Hibler E, Huang L, Andrade J, and Spring B. Impact of a diet and activity health promotion intervention on regional patterns of DNA methylation. Clin Epigenetics. 2019;11(1):133.
- Wischhusen P, Saito T, Heraud C, Kaushik SJ, Fauconneau B, Prabhu AJ, Fontagne-Dicharry S, and Skjaerven KH. Parental selenium nutrition affects the one-carbon metabolism and the hepatic DNA methylation pattern of rainbow trout (Oncorhynchus mykiss) in the progeny. Life (Basel). 2020;10(8). DOI:https://doi.org/10.3390/life10080121
- Lev Maor G, Yearim A, Ast G. The alternative role of DNA methylation in splicing regulation. Trends Genet. 2015;31(5):274–280.
- Doi A, Park IH, Wen B, Murakami P, Aryee MJ, Irizarry R, Herb B, Ladd-Acosta C, Rho J, Loewer S, et al. Differential methylation of tissue- and cancer-specific CpG island shores distinguishes human induced pluripotent stem cells, embryonic stem cells and fibroblasts. Nat Genet. 2009;41(12):1350–1353.
- Lien S, Koop BF, Sandve SR, Miller JR, Kent MP, Nome T, Hvidsten TR, Leong JS, Minkley DR, Zimin A, et al. The Atlantic salmon genome provides insights into rediploidization. Nature. 2016;533(7602):200–205.
- Taylor JF, Vera LM, De Santis C, Lock EJ, Espe M, Skjaerven KH, Leeming D, Del Pozo J, Mota-Velasco J, et al. The effect of micronutrient supplementation on growth and hepatic metabolism in diploid and triploid Atlantic salmon (Salmo salar) parr fed a low marine ingredient diet. Comp Biochem Physiol B Biochem Mol Biol. 2019;227:106–121.
- Martin M. Cutadapt removes adapter sequences from high-throughput sequencing reads. EMBnet.journal. 2011;17(1):10–12.
- Kim D, Langmead B, Salzberg SL. HISAT: a fast spliced aligner with low memory requirements. Nat Methods. 2015;12(4):357–360.
- Liao Y, Smyth GK, Shi W. featureCounts: an efficient general purpose program for assigning sequence reads to genomic features. Bioinformatics. 2014;30(7):923–930.
- Love MI, Huber W, Anders S. Moderated estimation of fold change and dispersion for RNA-seq data with DESeq2. Genome Biol. 2014;15(12):550.
- Boyle EI, Weng S, Gollub J, Jin H, Botstein D, Cherry JM, and Sherlock G. GO:TermFinder–open source software for accessing Gene Ontology information and finding significantly enriched Gene Ontology terms associated with a list of genes. Bioinformatics. 2004;20(18):3710–3715.
- Kanehisa M, Goto S. KEGG: kyoto encyclopedia of genes and genomes. Nucleic Acids Res. 2000;28(1):27–30.
- Subramanian A, Tamayo P, Mootha VK, Mukherjee S, Ebert BL, Gillette MA, Paulovich A, Pomeroy SL, Golub TR, Lander ES, et al. Gene set enrichment analysis: a knowledge-based approach for interpreting genome-wide expression profiles. Proc Natl Acad Sci U S A. 2005;102(43):15545–15550.
- Yu G, Wang LG, Han Y, and He QY. clusterProfiler: an R package for comparing biological themes among gene clusters. OMICS. 2012;16(5):284–287.
- Yu G, Wang LG, Yan GR, and He QY. DOSE: an R/Bioconductor package for disease ontology semantic and enrichment analysis. Bioinformatics. 2015;31(4):608–609.
- Li H, Handsaker B, Wysoker A, Fennell T, Ruan J, Homer N, Marth G, Abecasis G, Durbin R, and S. Genome Project Data Processing. The sequence alignment/map format and SAMtools. Bioinformatics. 2009;25(16):2078–2079.
- Ewels P, Magnusson M, Lundin S, and Kaller M. MultiQC: summarize analysis results for multiple tools and samples in a single report. Bioinformatics. 2016;32(19):3047–3048.
- Krueger F, Andrews SR. Bismark: a flexible aligner and methylation caller for Bisulfite-Seq applications. Bioinformatics. 2011;27(11):1571–1572.
- Langmead B, Trapnell C, Pop M, and Salzberg SL. Ultrafast and memory-efficient alignment of short DNA sequences to the human genome. Genome Biol. 2009;10(3):R25.
- Maaten LVD, Hinton G. Visualizing data using t-SNE. J Mach Learn Res. 2008;9(Nov):2579–2605.
- Tibshirani R, Walther G, Hastie T. Estimating the number of clusters in a data set via the gap statistic. J R Stat Soc Ser B Stat Methodol. 2001;63(2):411–423.
- Wilcoxon F. Individual comparisons by ranking methods. Biom Bull. 1945;1(6):80–83.
- Sekhon JS. Multivariate and propensity score matching software with automated balance optimization: the matching package for R. J Stat Softw. 2011;42(7):1–52.
- Hahne F, Ivanek R. Visualizing genomic data using gviz and bioconductor. In: Mathé E, Davis S, editors. Statistical genomics: methods and protocols. New York: Springer New York; 2016. p. 335–351.
- Koster J, Rahmann S. Snakemake–a scalable bioinformatics workflow engine. Bioinformatics. 2012;28(19):2520–2522.