
ABSTRACT
Proper development of the mammalian cerebral cortex relies on precise gene expression regulation. Increasing evidence shows that cortical development is regulated by both mRNAs and long noncoding RNAs (lncRNAs), which also are modified by N6-methyladenosine (m6A). Patterns of m6A-methylation in lncRNAs in the developing cortex have not been uncovered. Here we reveal differentially expressed lncRNAs and report stage-specific m6A-methylation patterns in lncRNAs expressed in mouse embryonic (E) and postnatal (P) cortices using RNA sequencing (RNA-seq) and methylated RNA immunoprecipitation (MeRIP) sequencing. Many lncRNAs show temporal differential expression, and display genic distribution in the genome. Interestingly, we detect temporal-specific m6A-methylation with consensus m6A motif GGACU in the last exon in most lncRNAs. And m6A methylation levels of lncRNAs are positively correlated with the transcript abundance of lncRNAs that have no significantly differential expression in E- and P-stages. Furthermore, the transcript abundance has a positive correlation between the m6A genic lncRNAs and their nearest m6A methylated mRNAs. Our work reveals a fundamental expression reference of lncRNAs and their nearest mRNAs, and highlights an importance of m6A-mediated epitranscriptomic modifications in lncRNAs that are temporally expressed in the developing cortex.
Introduction
The mammalian cerebral cortex is a highly evolved and complex organ with well-organized six layers laminar structure [Citation1]. In the embryonic cortex, radial glial cells and intermediate progenitors, which reside in the ventricular zone (VZ) and subventricular zone (SVZ), respectively, produce excitatory projection neurons. Inhibitory interneurons produced in the subpallium migrate into distinct cortical layers [Citation2]. Differentiated neurons form sophisticated neural circuits and control complicated behaviours including cognition, emotion, sensory perception, and motor function [Citation3]. Gene expression programmes in neural progenitors and mature neurons are tightly regulated to ensure proper cortical development and function.
Both genetic and epigenetic regulations are crucial for normal cortical development [Citation4,Citation5]. Besides of mRNAs, a significant number of long noncoding RNAs (lncRNAs) have been identified in the cortex [Citation6]. LncRNAs are classified as transcripts longer than 200 nucleotides (nt) in length, with little or no protein-coding potential [Citation7,Citation8]. They can be transcribed from the DNA strand and spliced like typical mRNAs [Citation9,Citation10]. Studies have shown that lncRNAs are mainly located in the nucleus, and some are transported into the cytoplasm [Citation11–13]. LncRNAs can function through various mechanisms, such as cis and trans regulations, modulation of chromatin structure, gene transcription, mRNA processing, and translation [Citation14]. In the nervous system, lncRNAs have been proven to be a novel player in regulating differentiation of neural progenitors and survival of newborn neurons [Citation6,Citation15,Citation16]. Because little is known about comprehensive expression profiles of lncRNAs in the developing cortex, functions of lncRNAs in cortical development are still largely unclear.
Furthermore, epitranscriptomic regulations in transcribed RNAs have been reported to play a role in brain development and function [Citation17]. In particular, N6-methyladenosine (m6A) modification in mRNAs can alter RNA stability, polyadenylation and splicing, translation efficiency, secondary structure, and subcellular localization [Citation18–20]. In mammals, m6A-methylation is found in multiple tissues, with high levels in the liver, kidney, and brain, and is shown to regulate cortical neurogenesis [Citation5,Citation21]. Interestingly, m6A-methylation also has been found in noncoding RNAs such as rRNA, tRNA, snRNA, and lncRNAs in various organisms, including virus, yeast, Arabidopsis thaliana, Drosophila, and mammals [Citation22–27]. In human foetal tissues, m6A-methylation has potential effects on regulating splicing of long intergenic noncoding RNA (lincRNA) [Citation28]. However, little is known about m6A-methylation status in lncRNAs that show specific expression in the developing cerebral cortex.
In this study, we identify differentially expressed lncRNAs in mouse embryonic and postnatal cortices using RNA sequencing (RNA-seq), and classify them into three categories according to their genomic location related to their nearest mRNAs. Moreover, we uncover abundant m6A binding sites and specific patterns in cortical lncRNAs using methylated RNA immunoprecipitation (MeRIP) sequencing. Our results reveal temporal-specific lncRNA expression and m6A-methylation status in them during cortical development, and provide a fundamental reference for further research on function of lncRNAs.
Results
Differentially expressed lncRNAs in embryonic and postnatal mouse cortices
In the mouse brain, cortical development begins by embryonic day 11 (E11), and neural progenitors actively proliferate and expand by E12.5 [Citation3]. After birth, the six layers structure of the cortex is fully formed by postnatal day 14 (P14) [Citation29]. To determine whether embryonic and postnatal mouse cerebral cortices display distinct profiles of lncRNA expression, we collected cortical tissues from E12.5–13 brains, termed E-stage, and from P14 brains, termed P-stage. RNA-sequencing (RNA-seq) was performed on an Illumina platform, resulting in around 30 million reads per sample [Citation30]. Raw sequencing data were analysed using fragments per kilobase of transcript per million mapped reads (FPKM) as gene transcript abundance values, with qualifying values subjected to the FPKM threshold of greater than 0.1 [Citation31]. The mean FPKM from three biological replicates at two developmental stages was regarded as the gene transcript abundance. Sample to sample correlation of mRNA transcript abundance resulted in a highly reproducible range between three biological replicates (blue >0.9) (Fig. S1a). Moreover, transcript abundance correlation of annotated lncRNAs also resulted in a highly reproducible range between three biological replicates (purple >0.72) (Fig. S1b). These results indicate that the RNA samples are reproducible.
We detected 4,259 lncRNAs and 17,164 mRNAs by RNA-seq in total, and filtered 758 out of 4,259 lncRNAs and 10,345 out of 17,164 mRNAs differentially expressed using the criteria of adjusted p-value (padj) <0.05, when comparing RNAs from embryonic and postanal cortices by the DESeq2 software. We analysed the transcript abundance of these RNAs (red dots, padj <0.05), and found that the transcript abundance of lncRNAs was mainly in a range of 0.2 < log10 (baseMean) <4.3, and mRNA transcript abundance was in a range of 0.2 < log10 (baseMean) <5.0 () and S1c). A majority of lncRNAs (89%) was less than the value 2 (log10 baseMean), while only a small portion of mRNAs (26%) was at the same transcript abundance range () and S1c). Moreover, the transcript abundance of most mRNAs (72%) were distributed in a range of values 2 to 3.5 (Fig. S1c). These results indicate that transcript abundance of most cortical lncRNAs are lower than those of mRNAs, which is consistent with previous reports [Citation32].
Figure 1. Differentially expressed lncRNAs in the mouse developing cortex. (a) MA plot shows the transcript abundance and the fold change of lncRNAs in E-stage and P-stage cortices. Log10 (baseMean) represents transcript abundance; log2FC(P/E) represents the fold change of lncRNA transcript abundance at P-stage compared to E-stage. log2FC(P/E) = 0, lncRNA transcript abundance was equal at two stages; log2FC(P/E) > 0, lncRNA transcript abundance was higher in P-stage than in E-stage cortices; log2FC(P/E) < 0, lncRNA transcript abundance was lower in P-stage than in E-stage cortices. Red dots, padj < 0.05; black dots, padj > 0.05. (b) The Venn diagram shows 326 and 378 significantly differentially expressed lncRNAs in E-stage and P-stage cortices, and 3555 lncRNAs with no significantly differential transcript abundance in both E- and P-stage cortices. (c) The volcano plot shows significantly differentially expressed lncRNAs at E-stage and P-stage. Red dots represent 326 significantly enriched lncRNAs at E-stage. Blue dots represent 378 significantly enriched lncRNAs at P-stage, grey dots represent lncRNAs with no significantly differential expression. The criteria for filtering significantly differentially expressed lncRNAs were padj < 0.05, log2FC (P/E-FPKM) > 1 or < −1. (d) The heatmap shows significantly differentially expressed 326 lncRNAs in E-stage and 378 lncRNAs in P-stage cortices. (e) Quantitative real-time reverse transcription PCR (qRT-PCR) validated relative transcript abundance of lncRNAs in developing cortices. padj: adjusted p-value; E: E-stage; P: P-stage; FC: fold change; FPKM: fragments per kilobase of transcript per million mapped reads. Data are presented as mean ± SEM; n = 3 for all qRT-PCR; p values are in relation to the other stage (**: p < 0.05, ***: p < 0.005)
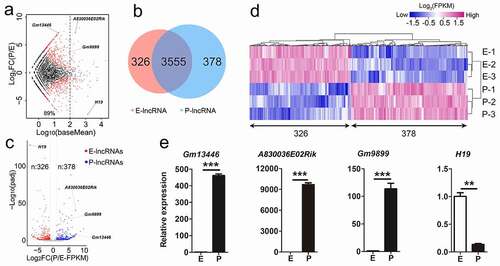
To examine progressive changes of lncRNA transcript abundance during cortical development, we compared transcript abundance values and fold change (FC) of lncRNAs in E- and P-stage cortices using criteria of log2 FC (P/E) >1 or < −1, and padj <0.05 [Citation33,Citation34]. We identified 326 and 378 lncRNAs significantly differentially expressed in E- and P-stage cortices, and termed them E-lncRNAs and P-lncRNAs, respectively (). Similarly, 2,779 E-mRNAs and 3,947 P-mRNAs out of 10,345 mRNAs were identified (Fig. S1d, e), indicating significantly differential expression of both lncRNAs and mRNAs in embryonic and postnatal cortices. Moreover, to validate transcript abundance, we performed quantitative real-time reverse transcription PCR (qRT-PCR) on 4 representative lncRNAs. All tested lncRNAs displayed either higher or lower transcript abundance in E- or P-stage cortices, which is consistent with the RNA-sequencing data ( c, e)).
Taken together, our RNA-seq analyses of lncRNAs reveal their differential and temporal expression in E- and P-stage cortices.
The classification of significantly differentially expressed lncRNAs
Studies have shown that lncRNAs can act on the neighbouring mRNAs and show a correlation with the expression of antisense coding genes [Citation32,Citation35]. The genomic distance between lncRNAs and their neighbouring mRNAs affects the expression correlation of lncRNAs and the neighbouring mRNAs [Citation36]. To clarify the positional relationship between lncRNAs and their closest mRNAs, we classified 704 (326 E-lncRNAs plus 378 P-lncRNAs in )) significantly differentially expressed lncRNAs relative to their nearest mRNAs into three classes based on their genomic locations: 1) genic lncRNAs: any region (exon, intron, and untranslated region) of a lncRNA that partially or completely overlaps with any part of the nearest mRNA; 2) separated lncRNAs: have a distance of less than 10kb in the genome from any part of the nearest mRNA; 3) intergenic lncRNAs: have a distance of more than 10kb in the genome from any part of the nearest mRNA ().
Figure 2. Classification of significantly differentially expressed lncRNAs according to their genomic location relative to the nearest mRNAs in E- and P-stage cortices. (a) The four subclasses of genic lncRNAs with part of or all gene overlapped with the nearest mRNA. (b) The three subclasses of separated lncRNAs with a distance of less than 10kb to the nearest mRNA. (c) The three subclasses of intergenic lncRNAs with a distance of more than 10kb to the nearest mRNA. The arrow covering genes represents the transcription direction. (d) Pie charts show the proportion of 326 and 378 significantly differentially expressed lncRNAs in each classification at E- and P-stage. (e) Pie charts show the proportion of pre-selected potential neural-lncRNAs in each subclass at E- and P-stage; the tables show the numbers of pre-selected potential neural-lncRNAs in each subclass at E- and P-stage
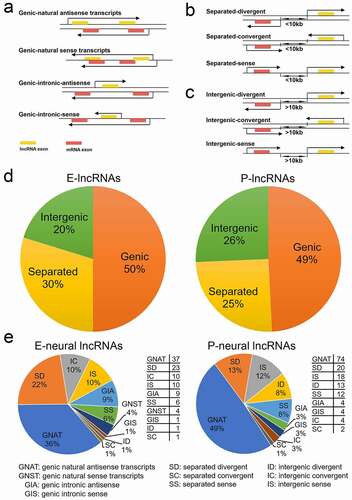
We further divided genic lncRNAs into four subclasses: 1) natural antisense and 2) intronic antisense transcripts refer to: a lncRNA that intersects any part of the nearest mRNA, or that lies within an intron of the nearest mRNA, and a lncRNA is transcribed from the opposite strand and orientation of the nearest mRNA; 3) natural sense and 4) intronic sense transcripts refer to: a lncRNA that overlaps with any part of the nearest mRNA, or that lies within an intron of the nearest mRNA, and a lncRNA is transcribed from the same strand and orientation of the mRNA ()).
Separated lncRNAs were classified into three subclasses: 1) divergent transcripts: a lncRNA is transcribed from the opposite strand and divergent orientation of the nearest mRNA; 2) convergent transcripts: a lncRNA is transcribed from the opposite strand and convergent orientation of the nearest mRNA; and 3) sense transcripts: a lncRNA is transcribed from the same strand and orientation of the nearest mRNA ()). Similarly, according to transcription direction and strand in the genome of lncRNA, we classified intergenic lncRNAs into three subclasses: divergent transcripts, convergent transcripts, and sense transcripts ()).
We next quantified numbers of 704 significantly differentially expressed lncRNAs in each class and subclass. Nearly half of lncRNAs were grouped into the genic lncRNA class in E-stage (50% of 326) and P-stage (49% of 378) cortices, suggesting that a majority of differentially expressed lncRNAs is genic genes ()). About one-third to one-fourth of lncRNAs were classified into separated lncRNAs: E-stage lncRNAs (30%) and P-stage lncRNAs (25%) ()). At the subclass level, genic natural antisense transcripts (GNAT) lncRNAs were the most prevalent subtype at two stages, other subtype lncRNA populations were diverse, with separated divergent (SD) and separated sense (SS) lncRNAs occupying a large proportion (Fig. S2a). Our classification analysis provides candidate lncRNAs with a short distance from the nearest mRNAs to further study functions of these lncRNAs.
Identification of neural lncRNAs
Studies have shown that antisense transcripts are widespread in mammalian transcriptomes [Citation9]. The noncoding antisense transcripts can alter the sense mRNA processing, transport, translation and degradation [Citation35,Citation37]. The lncRNAs that are overlapping with and in the antisense orientation to mRNAs have multiple functions in regulating the sense and nearby mRNAs, and play a role in neural development and under disease conditions [Citation14,Citation38–40]. Thus, through analysing the function of nearest mRNAs related to lncRNAs, we might predict the role of lncRNAs. We first selected nearest mRNAs that have been reported to function in neurogenesis, neuronal differentiation and synaptic signalling, defined as neural-mRNAs (Fig. S2b). We then searched 704 significantly differentially expressed lncRNAs, and identified 102 and 151 nearest lncRNAs related to neural-mRNAs in E- and P-stage cortices, respectively, named them neural-lncRNAs ()). We further analysed genomic locations of neural-lncRNAs and found that more than half of neural-lncRNAs also are genic in E-stage (50%) and P-stage (55%) cortices, in particular, genic antisense transcripts (GNAT and GIA) accounted for a large proportion ()). These results provide candidate lncRNAs that might interact with neural-mRNAs.
Features of m6A-methylation within lncRNAs
Recent studies have shown that epitranscriptomic regulations such as m6A-methylation play a crucial role in RNA modification and in cortical development [Citation5]. To uncover m6A-methylation features in lncRNAs expressed in E- and P-stage cortices, we conducted methylated RNA immunoprecipitation sequencing (MeRIP-seq). We found that m6A-methylation enrichment in mRNAs and lncRNAs is highly correlated and reproducible in three biological replicates at two developmental stages (Fig. S3a, b). A large number of RNAs with m6A peaks in E- and P-stages was consistent with previously reported m6A-methylated RNA data [Citation5,Citation41,Citation42] (Fig. S3c, d). We identified 579 and 552 m6A peaks associated with lncRNAs in E- and P-stage cortices, respectively. We found 298 lncRNAs modified by m6A-methylation, among them, 74 and 55 lncRNAs were only methylated in E- and P-stage cortices, respectively, and 169 lncRNAs were m6A-modified in cortices at both stages ()).
Figure 3. Features of m6A methylated lncRNAs in embryonic and postnatal mouse cortices. (a) Venn diagram shows the distribution of m6A peaks in lncRNAs at E- and P-stage. (b) The enriched consensus motif of m6A peaks in lncRNAs at E- and P-stage. (c) Density plot shows the closest distance between the m6A peak summit and the consensus motif (RRACU) in peak regions, and the closest distance between the consensus motif and the midpoint of the randomly selected sequence in the genome with equal length as peak regions in controls. (d) Density plot shows the exon length of m6A peaks enriched in lncRNAs at E- and P-stage. (e) Scatter plot shows the numbers of m6A peak in lncRNAs at E- and P-stage. Black horizontal lines among dots represent the mean number of m6A peak in lncRNAs at E- and P-stage. (f) Scatter plot shows the transcript abundance of m6A methylated lncRNAs at E- and P-stage. (g) Scatter plot shows the positive correlation between the numbers of m6A peaks and the m6A levels of lncRNAs at E- and P-stage (PCC > 0.25 and p < 0.05). (h) The top: pie charts represent the proportion of m6A peaks in the four regions of lncRNAs at E- and P-stage. The bottom: histogram represents the enrichment of m6A peaks in the four regions of lncRNAs at E- and P-stage. nt: nucleotide; FC: fold change; PCC: Pearson correlation coefficients; R2: the goodness-of-fit for the linear regression model
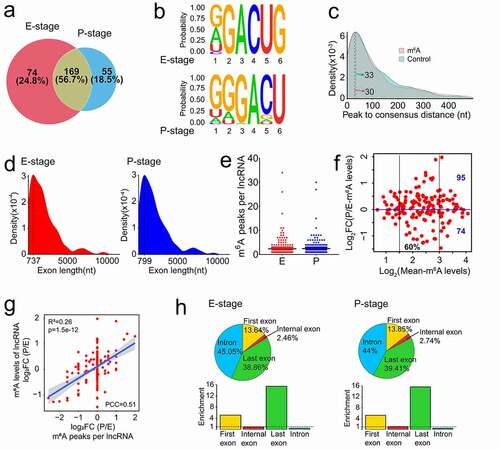
To identify whether m6A peaks share common sequence elements, we analysed m6A binding motifs using a tool of Homer. We detected a significantly enriched consensus motif GGACU within lncRNAs from E- and P-stage cortices ()), which is similar to the previous report in lincRNAs [Citation28]. And the motif matched the well-validated consensus m6A motif DRACH (where D = A, G or U; R = A or G; H = A, C or U) [Citation43]. The distance between the m6A peak summit and the nearest consensus motif RRACU in the peak regions were concentrated in 30 nucleotides (nt) in m6A modified lncRNAs of the two stages, compared to 33 nt between the nearest consensus motif to the midpoint of the randomly shuffled control regions in the genome ()). This identification suggests that RRACU motif distributes evenly and broadly in the genome with no specific region preference.
Previous study has reported that the median exon lengths were 149 base pair (bp) and 132 bp for lncRNAs and mRNAs, respectively [Citation32]. We found that m6A peaks tend to be located in lncRNA exons with 700 nt in length, while prefer to be in the mRNA exons with 400 nt in length () and S3e). These results indicate that m6A-methylation tends to occur within long exons, in line with the previous demonstration of most m6A peaks residing in mRNA exons longer than 400 nt [Citation23].
We next analysed the numbers of m6A peaks within lncRNAs, and identified a mean number of 2.4 m6A peaks per lncRNA ()). The m6A levels of lncRNAs were mainly in the range of 1.5–3 (log2 Mean-m6A levels, 60%) ()). A large number of lncRNAs displayed higher m6A levels in P-stage (95 m6A-methylated lncRNAs) than in E-stage (74 m6A-methylated lncRNAs), and the m6A levels of most m6A-methylated lncRNAs had the fold change of less than 2 times (−1 < log2FC <1) between E- and P-stage cortices ()).
Moreover, we found a positive correlation between m6A peak numbers and m6A levels of lncRNA in E- and P-stage cortices using Pearson correlation coefficients (PCC) with |PCC| >0.25 and p < 0.05 as a cut-off [Citation44] ()). Because lncRNAs usually have long introns and short exons (median length of 2280 bp and 132 bp, respectively) [Citation32], we found that more than half of m6A-methylated lncRNAs has no internal exons (Fig. S3f). We examined the distribution patterns of m6A peaks within lncRNAs and found that 45.05% and 44% of m6A peaks are located in introns in E- and P-stage lncRNAs, respectively, and very few peaks are located in internal exons (), pie charts). We then analysed the peak enrichment in each lncRNA. Interestingly, we foundthat m6A peaks are preferentially enriched in the last exon and first exon of lncRNAs expressed in E- and P-stage cortices (), histograms). Considering that m6Am modification occurs in the 5ʹ cap structure and m6A antibody cannot differentiate m6A and m6Am sites [Citation45], some of the methylated peaks enriched in the first exon of lncRNAs might be m6Am methylation. In summary, these results of m6A-methylation in lncRNAs are consistent with previous reports, in which m6A peaks are mostly enriched in the last exon [Citation41].
Status of m6A methylation in lncRNAs
We next analysed the correlation between lncRNA transcript abundance and m6A methylation, and identified 258 out of 298 m6A-modified lncRNAs with significant transcript abundance value (FPKM > 0.1). Because some lncRNAs had exons completely overlapped by the exons of another longer genes and were cut off in the process of quantifying gene transcript abundance values (FPKM) using the software featureCounts [Citation46], 40 m6A methylated lncRNAs were not detected effective transcript abundance values. Among 258 m6A-modified lncRNAs, we identified 59 and 55 m6A methylated lncRNAs significantly differentially expressed in E- and P-stage cortices, respectively; and 33 out of 59, and 37 out of 55 lncRNAs only methylated in E- and P-stage cortices, respectively, according to the criteria of padj <0.05 and |log2FC (P/E-FPKM)| >1 (, b)). These results indicate a temporal difference of m6A-methylation in lncRNAs differentially expressed in the cortex.
Figure 4. Expression features of m6A methylated lncRNAs at E- and P-stage. (a) Volcano diagram shows the expression patterns of m6A methylated lncRNAs in E- and P-stage cortices. Red dots and blue dots represent 59 and 55 significantly differentially expressed m6A methylated lncRNAs at E- and P-stage, respectively. Grey dots represent m6A methylated lncRNAs with no significantly differential expression at E- and P-stage. Criteria for filtering significantly differentially expressed m6A methylated lncRNAs were padj < 0.05, log2FC (P/E-FPKM) > 1 or < −1. (b) Volcano diagram shows the expression patterns of lncRNAs m6A methylated at only E- and P-stage. Red dots and blue dots represent 33 and 37 significantly differentially expressed lncRNAs only m6A methylated at E- and P-stage. Grey dots represent lncRNAs with no significantly differential expression and m6A methylated only at E- and P-stage. Criteria for filtering significantly differentially expressed m6A methylated lncRNAs were padj < 0.05, log2FC (P/E-FPKM) > 1 or < −1. (c) Scatter plot shows the positive correlation between m6A levels and transcript abundance of lncRNAs with no significantly differential expression at E- and P-stage (PCC > 0.25 and p < 0.05). Criteria for filtering significantly differentially expressed m6A methylated lncRNAs were padj < 0.05, log2FC (P/E-FPKM) > 1 or < −1. (d) Box plot represents the comparison of transcript abundance of m6A methylated lncRNAs and non-m6A methylated lncRNAs at E- and P-stage. p values were determined by unpaired student’s t-test, ***: p < 0.01. E: p= 2.003e-53; P: p = 5.705e-31. E: E-stage; P: P-stage; HE: highly enriched; FC: fold change; FPKM: fragments per kilobase of transcript per million mapped reads; PCC: Pearson correlation coefficients; R2: the goodness-of-fit for the linear regression model
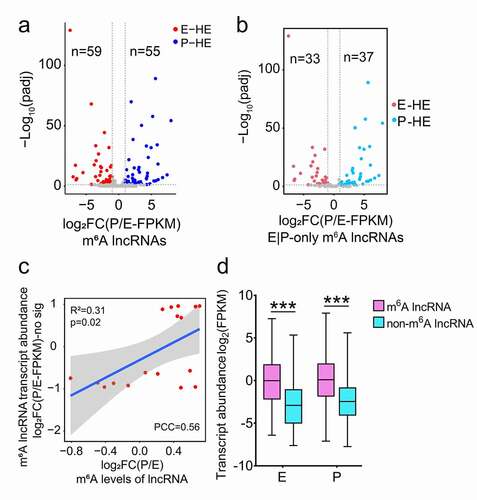
We then examined correlation of lncRNA transcript abundance with their m6A-methylation. We did not detect a correlation between transcript abundance and m6A levels of all m6A methylated lncRNAs in E- or P-stage cortices (Fig. S3g, h). Moreover, m6A levels did not show any correlation with transcript abundance of lncRNAs that were only m6A methylated in E- or P-stage cortices (74 and 55 lncRNAs, respectively), which is consistent with findings in a previous study [Citation5] () and S3i, j). For lncRNAs with no significant transcript abundance changes in E- and P-stage cortices, their m6A levels were positively correlated with their transcript abundance, when criteria of |log2FC(P/E-FPKM)| >1 and padj <0.05 were used ()). For lncRNAs with E-stage higher and P-stage lower transcript abundance, and for lncRNAs with E-stage lower and P-stage higher transcript abundance, there was no correlation detected between their m6A levels and transcript abundance (Fig. S3k, l). Interestingly, the median value of m6A methylated lncRNAs displayed higher transcript abundance than those with non-m6A methylation in both E- and P- stage cortices ()). Our analysis reveals that m6A methylation levels have a positive correlation with the transcript abundance of m6A lncRNAs with no significantly differential expression between E-and P-stages, and the m6A levels do not have a correlation with the transcript abundance of m6A lncRNAs that are significantly differentially expressed between two stages. These results highlight the importance of m6A methylation in cortical RNAs.
Temporal- and spatial-m6A-methylation in lncRNAs
To visualize exact m6A-methylation sites within lncRNAs and mRNAs, we identified the most enriched methylation peaks in lncRNAs using the Integrative Genomics Viewer (IGV). We found that E-m6A lncRNAs and P-m6A lncRNAs display temporal specific enriched m6A peaks, and their transcript abundance is enriched at E-stage and P-stage (, b)). Some m6A peaks were highly enriched in lncRNAs at both stages ()). We also found that some lncRNAs have their most enriched m6A peaks in intron regions in both E- and P-m6A lncRNAs ()).
Figure 5. Distribution pattern of m6A peaks in lncRNAs showed by Integrative Genomics Viewer (IGV). (a) The m6A peaks were specifically enriched in the exon of lncRNAs at E-stage. (b) The m6A peaks were specifically enriched in the exon of lncRNAs at P-stage. (c) The m6A peaks were co-enriched in the exon of lncRNAs at E- and P-stage. (d) The m6A peaks were co-enriched in the intron of lncRNAs at E- and P-stage. Red peaks: normalized IP read enrichment at E-stage; blue peaks: normalized IP read enrichment at P-stage; grey peaks: normalized input read enrichment. Blue bar: exon; blue thin line: intron. Arrow direction: the direction of gene transcription; arrow location: enriched m6A peaks overlap with the beginning, middle and end position of lncRNAs
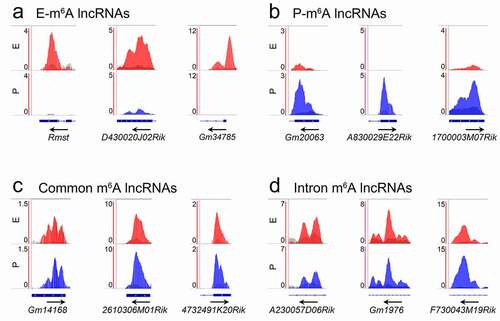
In addition, studies have shown functional interactions between lncRNAs and their nearest mRNAs [Citation47]. We found that many mRNAs nearest to m6A-methylated lncRNAs also are modified by m6A (Fig. S4a, blue bars). We thus examined whether m6A-enrichment patterns of the nearest mRNAs are correlated with lncRNAs. We found that most m6A peaks of mRNAs displayed similar patterns to those of their nearest m6A modified lncRNAs, as illustrated by the IGV ( and S4b-d). For example, the E-m6A lncRNA D430020J02Rik displayed enriched m6A peaks in E-stage cortices, its nearest gene Ncapg2 showed a similar pattern () and S4b). These IGV analyses confirm temporal and spatial m6A-methylation patterns in lncRNAs and their nearest mRNAs. Noticeably, some clear peaks in lncRNAs shown by IGV failed to be called by MACS (Fig. S5). 12 out of 74 E-m6A lncRNAs (16.22%) and 4 out of 55 P-m6A lncRNAs (7.27%), which had clear peaks shown by IGV, did not show m6A peak levels after peak calling by MACS (Fig. S5a, b). Moreover, 8 out of 169 common m6A lncRNAs (4.73%) had higher peaks at one stage than the other as shown by IGV displayed opposite peak levels after peak calling by MACS (Fig. S5c). These observations suggest a non-significant read enrichment between the IP peaks and the input peaks according to the parameters (q < 0.05) in the process of peak calling by MACS.
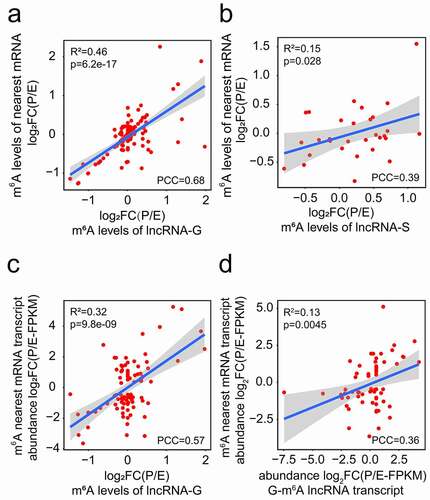
To further confirm the correlation of m6A-methylation patterns between lncRNAs and their nearest mRNAs, we performed Pearson correlation analysis. The m6A level changes of genic and separated lncRNAs and their nearest mRNAs had a positive correlation at E- and P-stage (, b)). No correlation was observed between the m6A level changes of intergenic lncRNAs and their nearest mRNAs at two stages (p > 0.05) (Fig. S4e). Moreover, a positive correlation was detected between the m6A level changes of genic lncRNAs and the transcript abundance changes of their nearest mRNAs at E- and P-stage ()), while no correlation was detected in separated lncRNAs, when criteria of FPKM > 0.1 and padj <0.05 were used (Fig. S4f). Moreover, we found that the transcript abundance changes of m6A genic lncRNAs and m6A nearest mRNAs are positively correlated ()), which is consistent with the previous study [Citation32]. These results indicate that m6A methylation levels and transcript abundance of genic lncRNAs are positively correlated with the transcript abundance of their nearest mRNAs.
Figure 6. Correlation analyses of m6A methylated lncRNAs and their nearest mRNAs at E- and P-stage. (a, b) The positive correlation of m6A levels of genic (a) and separated (b) lncRNAs with their nearest mRNAs at E- and P-stage. (c) The positive correlation between the m6A levels of genic lncRNAs and the transcript abundance of their nearest mRNAs. (d) The positive transcript abundance correlation between the genic m6A lncRNAs and the m6A methylated nearest mRNAs. FC: fold change; PCC: Pearson correlation coefficients; R2: the goodness-of-fit for the linear regression model; FPKM: fragments per kilobase of transcript per million mapped reads. The correlation criteria were PCC > 0.25 and p < 0.05
Functional prediction of significantly differentially expressed lncRNAs
Previous studies have reported that lncRNAs function in transcriptional regulation, epigenetics, and disease conditions [Citation8,Citation9,Citation48]. To find out lncRNAs related to neurological diseases, we retrieved 704 significantly differentially expressed lncRNAs in the database of the nervous system disease ncRNAome atlas (NSDNA) [Citation49]. We detected 23 lncRNAs, with 18 enriched in E-stage and 5 enriched in P-stage cortices, which have been experimentally examined to be associated with neurological diseases such as Alzheimer’s disease, Parkinson’s disease, chronic pain and glioma ()). These analyses suggest that significantly differentially expressed lncRNAs are likely involved in the process of brain development and disease conditions.
Figure 7. Function prediction and m6A methylation analysis of significantly differentially expressed lncRNAs. (a) The network shows a relationship of neurological diseases and significantly differentially expressed lncRNAs at E- and P-stage in the database of nervous system disease ncRNAome atlas (NSDNA). The lncRNAs labelled with m6A were m6A methylated lncRNAs. (b) The m6A peaks were highly enriched in the neurological disease-related P-lncRNAs (top) and E-lncRNAs (bottom) in the 3 biological replicates at E- and P-stage. (c) The 4 conserved m6A methylated sites in lncRNA Malat1 in mouse. Pink peaks: normalized IP read enrichment at E-stage; purple peaks: normalized IP read enrichment at P-stage; grey peaks: normalized input read enrichment. Blue bar: exon; blue thin line: intron; asterisk: the potential conserved m6A methylation site
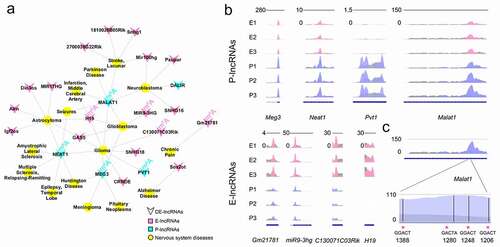
Studies have shown that m6A-methylation is associated with brain development and neurological diseases [Citation50]. We further examined m6A modification in these 23 lncRNAs, and found that 4 E-lncRNAs and 4 P-lncRNAs are modified by m6A methylation ()). Among them, the human lncRNA MALAT1 contained 4 m6A binding sites [Citation51,Citation52]. Because sequences of lncRNAs are usually poorly conserved among species [Citation53], we speculated whether m6A binding sites are conserved. Using Malat1 as an example, we aligned the sequences of human and mouse Malat1 in the Ensembl database and identified 78.9% conserved sequences between human and mouse Malat1. Moreover, we identified 4 m6A binding sites in E- and P-stage cortices, and found that the consensus sequence GGACT is conserved in 3 out of 4 sites in human and mouse Malat1 ()). A large proportion of conserved consensus sequences also was detected in other 22 lncRNAs between the human and mouse. The analyses suggest that m6A methylation appears conserved in some human and mouse lncRNAs.
Discussion
Proper cortical development is modified by both coding genes and noncoding RNAs. Taking advantage of the sequencing approach and gene annotation, a significant number of noncoding RNAs has been identified [Citation54]. Some lncRNAs have been shown to play crucial roles in brain development [Citation6,Citation55]. Here, we have identified lncRNAs that are differentially expressed in mouse embryonic and postnatal cortices. Moreover, we have uncovered m6A-methylation status in lncRNAs with temporal-specific expressions in the developing cortex. Our results highlight a potential role of m6A modified lncRNAs during cortical development.
The cerebral cortex consists of multiple cell types. Excitatory projection neurons, forming approximately 70–80% of neurons in the cortex, are derived from radial glial cells and intermediate progenitors in the mouse embryonic cortex [Citation56–58]. Subsequently, postmitotic neurons migrate and form a six layers structure in the postnatal cortex [Citation3]. Cortical inhibitory interneurons, accounting for 20–30% of total cortical neurons, set up local connections within the cortex to modulate activities of projection neurons [Citation3]. Functions of mRNAs in the process of cortical development have been extensively studied, and the role of noncoding RNAs also has been appreciated [Citation55]. Numerous studies have shown functions of microRNAs (miRNAs) in neural development, yet an examination of lncRNAs has only begun.
A large number of lncRNAs have been discovered in humans and other model organisms [Citation32,Citation48]. Unlike mRNAs, lncRNAs are poorly conserved at the primary sequence level [Citation53], and their biogenesis as well as regulation mechanisms are not yet fully understood [Citation59]. Recent studies have presented groupings of lncRNAs, from identifying lncRNAs by common features such as containing an enriched cytosine-rich motif for nuclear location [Citation60], to possessing protein binding motif k-mer profiles for functionally related lncRNAs [Citation59]. Interestingly, studies have pointed out that lncRNAs have pairwise correlations of expression with neighbouring mRNAs in the genome locus, and can regulate expression and function of neighbouring genes through cis- or trans- patterns [Citation36,Citation61]. In our study, we have systematically classified cortical lncRNAs according to the distance relationship of gene loci location between lncRNAs and their nearest mRNAs. We have found that nearly half of these lncRNAs are genic, suggesting that most lncRNAs may play a regulatory role in mRNA expression through a close range as the genic lncRNA Emx2os [Citation39]. Our analysis has provided candidate lncRNAs and mRNAs for further examination of gene regulation network in the cortex.
Furthermore, studies have shown that m6A is a ubiquitous modification in mRNAs, and plays a crucial role in regulating gene expression [Citation23]. Because m6A-methylation displays enriched bindings near the stop codon and in 3ʹUTRs of mRNAs, it may impact the affinity of RNA-binding proteins and miRNAs to their targets [Citation62]. In our study, we have found that m6A peaks are enriched prevailingly in the last exon of lncRNA transcripts, a similar region as the stop codon and 3ʹUTR in mRNAs. Future studies are to uncover why m6A peaks display location preference in the stop codon and 3ʹUTR, and what specific roles of m6A-methylation are in these regions in lncRNAs. In addition, we have found that lncRNAs and their nearest mRNAs appear to have similar m6A peak patterns in embryonic and postnatal cortices. The future work is to explore whether the correlation of m6A methylation pattern between lncRNAs and nearest mRNAs plays regulatory roles in cortical development.
Studies have shown poorly conserved primary sequences of many lncRNAs among different species [Citation53,Citation63]. We have found a high sequence conservation of lncRNAs associated with human diseases in the mouse and human. Because a broad m6A methylation occurs in the human foetal brain [Citation28], it will be informative to compare whether these lncRNAs also are conserved in the mouse, and to explore their potential functions in the brain. Moreover, studies have shown increased m6A levels into the adulthood [Citation62]. We also find that a large number of lncRNAs displays higher m6A levels in the P-stage cortex than E-stage. The future study is to reveal the role of increased m6A levels during brain development.
Noticeably, when preparing RNA samples for RNA-seq and MeRIP-seq, we used the poly-T oligo to purify RNAs. Therefore, the enrichment of m6A peaks in the last exon of lncRNAs is limited in poly-A selected lncRNAs [Citation41]. In addition, the m6A antibody in MeRIP-seq also can recognize the cap structure of m6Am, which is found at the first-transcribed nucleotide [Citation42,Citation45]. The methylated peaks enriched in the first exon region of lncRNAs might belong to m6Am methylation. And some lncRNAs transcripts with low expression abundance might not be detected and pulled down by the m6A antibody. New technologies and methods such as m6A individual-nucleotide-resolution cross-linking and immunoprecipitation (miCLIP) and adapted ultraviolet light-induced cross-linking and immunoprecipitation (UV-CLIP) have been developed to identify m6A and m6Am at a single nucleotide resolution [Citation51]. And deamination adjacent to RNA modification targets sequencing (DART-seq), an antibody-free method, also can detect and distinguish m6A from m6Am [Citation45].
Moreover, we used the non-strand specific library for RNA-seq and MeRIP-seq, which cannot determine the strand information of the sequencing reads. In the process of quantifying gene transcript abundance value using the software featureCounts in the RNA-seq analysis, reads mapped to overlapping exons of two or more RNA transcripts will be discarded, leading to a detection of lower transcript abundance values for these transcripts that belong to GNAT and GNST. The lncRNAs completely overlapped within an mRNA exon are cut off during the process of analyses. In addition, in the MeRIP-seq analysis, due to lack of the read-strand information, it is difficult to distinguish which RNA transcripts, in particular to those with overlapping strands, are specifically covered by m6A peaks. The future work is to confirm the m6A methylation on overlapping transcripts with available stand-specific libraries.
In summary, our study has revealed profiles of expression and m6A-methylation in lncRNAs that display temporal expressions in mouse-developing cortices. Our work indicates a molecular complexity of cortical development, which is orchestrated by mRNAs, lncRNAs, and m6A epitranscriptomic regulation.
Materials and methods
Mice
C57BL/6 J mice were used and purchased from Shanghai Lingchang biotech Laboratory Animal Co. Ltd (Shanghai, China) and Wushi company (Fujian, China). For staging of embryos, embryos were considered as embryonic day 0.5 (E0.5) in the morning when vaginal plugs were observed; pups were defined as postnatal day 0 (P0) in the first 24 hours afterbirth.
Animal usage was carried out following institutional guidelines, and the study was approved by the Animal Care and Use Committee of Shanghai Jiao Tong University and Huaqiao University. All efforts were made to minimize the number of animals used.
RNA-sequencing (RNA-seq) and data analysis
Total RNA was extracted from cortices of three embryonic days 12.5–13 (E12.5-E13) mice from one litter and of three postnatal days 14 (P14) male mice from one litter using RNAisoTM Plus Reagent (Takara). RNA-seq was performed as described in the previous report [Citation64]. Briefly, total RNA was purified using poly-T oligo-attached magnetic beads, then fragmentation was carried out using divalent cations under elevated temperature in NEBNext Magnesium RNA Fragmentation Module (E6150s). After reverse transcription, RNA-seq non-strand specific libraries were generated with the NEB Next Ultra RNA Library Prep Kit. PCR products were purified and were sequenced with Illumina HiSeq 4000. Library quality was assessed by the Agilent Bioanalyzer 2100 system.
RNA-seq was performed using Illumina HiSeq 4000 by Novogene Ltd. We mapped clean reads using HISAT2 to GRCm38/mm10 mouse reference genome with the Ensemble gene annotation (version 91). During this process, reads with unusual insertion and deletion or mapped to multiple sites were discarded. We obtained the unique mapped reads for subsequent analysis. RNA samples and sequencing data derived from each mouse at the embryonic and postnatal stage were processed separately as biological replicates. We quantified transcript abundance of fragments per kilobase of transcript per million mapped reads (FPKM) with unique mapped reads by the software of featureCounts. Reads mapping to the overlapping exons of more than one transcript were discarded. We used RNAs annotated with the gene types of lncRNAs and mRNAs to perform the subsequent analyses.
We then applied the DESeq2 software to filter out differentially expressed genes. We totally identified 4,259 lncRNAs and 17,164 mRNAs in the 6 samples by RNA-seq, and filtered out 758 and 10,345 differentially expressed lncRNAs and mRNAs from 4,259 to 17,164 genes with the standard of adjusted p-value <0.05. Furthermore, we screened out 704 significantly differentially expressed lncRNAs using the following criteria: log2 (FC) >1 or < −1 and adjusted p-value <0.05.
To classify the lncRNAs, we manually searched the genomic distance of 704 significantly differentially expressed lncRNAs and their nearest mRNAs with the Ensembl genomic browser.
To find out the neural related nearest mRNAs, we obtained the GO annotation clusters of nearest mRNAs at E- and P-stage in DAVID database, and identified the clusters of neural related with enrichment score >1, then we chose the neural nearest mRNAs in 21 and 14 neural related GO BP (Biological process) terms at E- and P-stage with FDR (false discovery rate) <0.05.
Datasets supporting the conclusions of this paper are available at NCBI GEO under an accession code GSE141938.
Methylated RNA immunoprecipitation sequencing (MeRIP-seq) and data analysis
Total RNA was extracted from cerebral cortices of three E12.5–13 mouse embryos in one litter, and of three individual P14 male mice from one litter. Total RNA was extracted with RNAisoTM Plus Reagent (Takara).
The MeRIP-seq was performed as previously described [Citation65]. Briefly, total RNA was fragmented to 100–200 nt. A portion of fragmented RNAs was served as input controls. The rest fragmented RNAs were incubated with anti-m6A antibody (Synaptic Systems, cat. No. 202,003), and Immobilized Recombinant Protein A (Repligen, cat. No. IPA300). Immunoprecipitated RNA with m6A nucleotide was eluted by ethanol precipitation. IgG (Sigma-Aldrich, cat. No. I8765) was used as a negative control of the immunoprecipitated reaction.
Purified RNA fragments for making MeRIP-seq non-strand specific libraries were generated with the NEB Next Ultra RNA Library Prep Kit and were sequenced with Illumina HiSeq 4000. The m6A-seq data were analysed according to the previous standardized pipeline [Citation65]. Briefly, m6A-seq raw data were cleaned by trimming the adapter with trim galore, and the cleaned data were aligned to the house mouse (M. musculus) genome GRCm38/mm10 in Ensemble by BWA with default parameters, then the data were converted as bam files by samtools. The m6A peaks were detected by MACS (Version 1.4.0rc 2) with parameters: -format = ‘BAM’ – gsize = 282,000,000 – tsize = 101 – nomodel – shiftsize = 150 – q 0.05 – to-large False -w -S. The RNAs and data from each mouse at the embryonic and postnatal stages were processed separately as biological replicates. The genes that are overlapped with the m6A peak summits are defined as the m6A methylated genes.
We used the mean value of m6A peak levels from three biological replicates as the m6A level of the peak in a transcript. Reads per million mapped reads (RPM) were calculated by the unique mapped read counts in a peak in the sample. We used the RPM values of each peak in input and IP sample for one biological replicate. The m6A level of one peak was quantified as the ratio of RPM-IP-E1/RPM-input-E1 in the sample [Citation66].
The peak enrichment of lncRNAs in four specific regions (first exon, internal exon, last exon, and intron) was calculated using the following method: (the numbers of peak summit in the certain one of four regions/the total numbers of peak summit in the four regions)/(the sequence length of the certain one region/the total sequence length of the four regions). The peak summit is the centre of m6A peaks with the highest read pileup and is predicted as the precise binding site [Citation67]. The numbers of peak summit represent the numbers of m6A peaks in the region.
To discover sequence consensus, 579 and 552 m6A peaks overlapping with lncRNAs in E-stage and P-stage were used for de novo motif analysis using HOMER (version 4.9.1) [Citation68].
To find out the distance between the m6A peaks to the nearest consensus motif, we searched the consensus sequence by identifying the midpoint of the m6A peak regions and then adding 500 bp upstream and downstream sequences. We then randomly selected regions of the same length as m6A peak regions in the genome as controls.
The integrative genomics viewer (IGV) was used to visualize m6A peaks along with gene transcripts [Citation69]. We imported the input and IP data in bw format and identified the most enriched m6A methylation site in genes. For RNA-seq data, we imported the data in bam format. The genome and annotation documents are the same as those used in pre-processing.
Datasets supporting the conclusions of this paper are available at NCBI GEO under the accession code GSE141938. Data of m6A-methylated RNAs for E13.5 mouse forebrain (GSE99017), postnatal day 2 mouse brain (GSE71154) and 7-week mouse cerebrum (GSA: CRA001962) were downloaded and used for analysis in this study.
Quantitative real-time reverse transcription PCR (qRT-PCR)
RNA samples used for qRT-PCR were the same as for RNA-seq. Reverse transcription was performed using a PrimeScript RT reagent Kit with gDNA Eraser (Takara). The RT-PCR was performed using SYBR Premix Ex Taq (Takara) and CFX Connect Real-time System (Bio-Rad) according to the manufacturer’s instructions. Gapdh mRNA was used as a relative expression control.
Statistical analysis
MA plot was drawn using the R function plot and Heatmap was drawn using the R package of pheatmap. Bubble plot, Volcano plot, Density plot were drawn using the R package of ggplot2. Pearson correlation analysis was performed using the R package of ggplot2 and ggpubr with |Pearson correlation coefficients (PCC)| >0.25 and p < 0.05 as the cut-off [Citation44]. R2 represents the goodness-of-fit for the linear regression model. For qRT-PCR, each sample was tested in triplicates, and the CT values were analysed using 2−∆∆CT. All data were presented as mean ± SEM. Two group comparisons were done by two-tailed, unpaired Student’s t-test by SPSS 23 (IBM Software) and the histogram plot was drawn by GraphPad Prism 5 (GraphPad Software). p < 0.05 was considered statistically significant.
Supplemental Material
Download Zip (39.4 MB)Acknowledgements
We thank members of the Sun laboratory for their valuable discussions and advice. We would like to thank the Core Facility and Technical Service Center of SLSB Shanghai Jiao Tong University for providing equipment support. We appreciate the assistance of Prof. Ji Wu for data analysis.
Disclosure statement
No potential conflict of interest was reported by the authors.
Supplementary material
Supplemental data for this article can be accessed here.
Additional information
Funding
Related Research Data
References
- Belgard TG, Marques AC, Oliver PL, et al. A transcriptomic atlas of mouse neocortical layers. Neuron. 2011;71:605–616.
- Haubensak W, Attardo A, Denk W, et al. Neurons arise in the basal neuroepithelium of the early mammalian telencephalon: a major site of neurogenesis. Proc Natl Acad Sci U S A. 2004;101:3196–3201.
- Lodato S, Arlotta P. Generating neuronal diversity in the mammalian cerebral cortex. Annu Rev Cell Dev Biol. 2015;31:699–720.
- Leone DP, Heavner WE, Ferenczi EA, et al. Satb2 regulates the differentiation of both callosal and subcerebral projection neurons in the developing cerebral cortex. Cereb Cortex. 2015;25:3406–3419.
- Yoon KJ, Ringeling FR, Vissers C, et al. Temporal control of mammalian cortical neurogenesis by m(6)A methylation. Cell. 2017;171:877–89 e17.
- Aprea J, Prenninger S, Dori M, et al. Transcriptome sequencing during mouse brain development identifies long non-coding RNAs functionally involved in neurogenic commitment. Embo J. 2013;32:3145–3160.
- Kapranov P, Cheng J, Dike S, et al. RNA maps reveal new RNA classes and a possible function for pervasive transcription. Science. 2007;316:1484–1488.
- Mercer TR, Dinger ME, Mattick JS. Long non-coding RNAs: insights into functions. Nat Rev Genet. 2009;10:155–159.
- Carninci P, Kasukawa T, Katayama S, et al. The transcriptional landscape of the mammalian genome. Science. 2005;309:1559–1563.
- Bian S, Sun T. Noncoding RNAs in neural stem cell development. Neural Stem Cells Ther. 2012;12:239–256.
- Clemson CM, McNeil JA, Willard HF, et al. XIST RNA paints the inactive X chromosome at interphase: evidence for a novel RNA involved in nuclear/chromosome structure. J Cell Biol. 1996;132:259–275.
- van Heesch S, van Iterson M, Jacobi J, et al. Extensive localization of long noncoding RNAs to the cytosol and mono- and polyribosomal complexes. Genome Biol. 2014;15:R6.
- Rutenberg-Schoenberg M, Sexton AN, Simon MD. The Properties of Long Noncoding RNAs That Regulate Chromatin. Annu Rev Genomics Hum Genet. 2016;17:69–94.
- Knauss JL, Sun T. Regulatory mechanisms of long noncoding RNAs in vertebrate central nervous system development and function. Neuroscience. 2013;235:200–214.
- Ramos AD, Attenello FJ, Lim DA. Uncovering the roles of long noncoding RNAs in neural development and glioma progression. Neurosci Lett. 2016;625:70–79.
- Ramos AD, Andersen RE, Liu SJ, et al. The long noncoding RNA Pnky regulates neuronal differentiation of embryonic and postnatal neural stem cells. Cell Stem Cell. 2015;16:439–447.
- Frye M, Harada BT, Behm M, et al. RNA modifications modulate gene expression during development. Science. 2018;361:1346–1349.
- Wang X, Lu Z, Gomez A, et al. N6-methyladenosine-dependent regulation of messenger RNA stability. Nature. 2014;505:117–120.
- Liu N, Dai Q, Zheng G, et al. N(6)-methyladenosine-dependent RNA structural switches regulate RNA-protein interactions. Nature. 2015;518:560–564.
- Zheng G, Dahl JA, Niu Y, et al. ALKBH5 is a mammalian RNA demethylase that impacts RNA metabolism and mouse fertility. Mol Cell. 2013;49:18–29.
- Li J, Yang X, Qi Z, et al. The role of mRNA m(6)A methylation in the nervous system. Cell Biosci. 2019;9:66.
- Brocard M, Ruggieri A, Locker N. m6A RNA methylation, a new hallmark in virus-host interactions. J Gen Virol. 2017;98:2207–2214.
- Dominissini D, Moshitch-Moshkovitz S, Schwartz S, et al. Topology of the human and mouse m6A RNA methylomes revealed by m6A-seq. Nature. 2012;485:201–206.
- Boccaletto P, Machnicka MA, Purta E, et al. MODOMICS: a database of RNA modification pathways. 2017 update. Nucleic Acids Res. 2018;46:D303–D7.
- Schwartz S, Agarwala SD, Mumbach MR, et al. High-resolution mapping reveals a conserved, widespread, dynamic mRNA methylation program in yeast meiosis. Cell. 2013;155:1409–1421.
- Lence T, Akhtar J, Bayer M, et al. m(6)A modulates neuronal functions and sex determination in drosophila. Nature. 2016;540:242–247.
- Luo G-Z, MacQueen A, Zheng G, et al. Unique features of the m6A methylome in Arabidopsis thaliana. Nat Commun. 2014;5:5630.
- Xiao S, Cao S, Huang Q, et al. The RNA N(6)-methyladenosine modification landscape of human fetal tissues. Nat Cell Biol. 2019;21:651–661.
- Kroon T, van Hugte E, van Linge L, et al. Early postnatal development of pyramidal neurons across layers of the mouse medial prefrontal cortex. Sci Rep-Uk. 2019;9:5037.
- Tarazona S, Garcia-Alcalde F, Dopazo J, et al. Differential expression in RNA-seq: A matter of depth. Genome Res. 2011;21:2213–2223.
- Guo CJ, Ma XK, Xing YH, et al. Distinct processing of lncRNAs contributes to non-conserved functions in stem cells. Cell. 2020;181:621–36 e22.
- Derrien T, Johnson R, Bussotti G, et al. The GENCODE v7 catalog of human long noncoding RNAs: analysis of their gene structure, evolution, and expression. Genome Res. 2012;22:1775–1789.
- Anders S, Huber W. Differential expression analysis for sequence count data. Genome Biol. 2010;11:R106.
- Love MI, Huber W, Anders S. Moderated estimation of fold change and dispersion for RNA-seq data with DESeq2. Genome Biol. 2014;15:550.
- Katayama S, Tomaru Y, Kasukawa T, et al. Antisense transcription in the mammalian transcriptome. Science. 2005;309:1564–1566.
- Engreitz JM, Haines JE, Perez EM, et al. Local regulation of gene expression by lncRNA promoters, transcription and splicing. Nature. 2016;539:452–455.
- Knee R, Murphy PR. Regulation of gene expression by natural antisense RNA transcripts. Neurochem Int. 1997;31:379–392.
- Faghihi MA, Zhang M, Huang J, et al. Evidence for natural antisense transcript-mediated inhibition of microRNA function. Genome Biol. 2010;11:R56.
- Spigoni G, Gedressi C, Mallamaci A. Regulation of Emx2 expression by antisense transcripts in murine cortico-cerebral precursors. PLoS One. 2010;5:e8658.
- Bond AM, Vangompel MJ, Sametsky EA, et al. Balanced gene regulation by an embryonic brain ncRNA is critical for adult hippocampal GABA circuitry. Nat Neurosci. 2009;12:1020–1027.
- Ke S, Alemu EA, Mertens C, et al. A majority of m6A residues are in the last exons, allowing the potential for 3ʹ UTR regulation. Genes Dev. 2015;29:2037–2053.
- Liu J, Li K, Cai J, et al. Landscape and regulation of m(6)A and m(6)Am methylome across human and mouse tissues. Mol Cell. 2020;77:426–40 e6.
- Spitale RC, Flynn RA, Zhang QC, et al. Structural imprints in vivo decode RNA regulatory mechanisms. Nature. 2015;519:486–490.
- Li H, Gao C, Liu L, et al. 7-lncRNA assessment model for monitoring and prognosis of breast cancer patients: based on cox regression and co-expression analysis. Front Oncol. 2019;9:1348.
- Meyer KD. DART-seq: an antibody-free method for global m(6)A detection. Nat Methods. 2019;16:1275–1280.
- Liao Y, Smyth GK, Shi W. featureCounts: an efficient general purpose program for assigning sequence reads to genomic features. Bioinformatics. 2014;30:923–930.
- Cabili MN, Trapnell C, Goff L, et al. Integrative annotation of human large intergenic noncoding RNAs reveals global properties and specific subclasses. Genes Dev. 2011;25:1915–1927.
- Pauli A, Valen E, Lin MF, et al. Systematic identification of long noncoding RNAs expressed during zebrafish embryogenesis. Genome Res. 2012;22:577–591.
- Wang J, Cao Y, Zhang H, et al. NSDNA: a manually curated database of experimentally supported ncRNAs associated with nervous system diseases. Nucleic Acids Res. 2017;45:D902–D7.
- Wang CX, Cui GS, Liu X, et al. METTL3-mediated m6A modification is required for cerebellar development. PLoS Biol. 2018;16:e2004880.
- Linder B, Grozhik AV, Olarerin-George AO, et al. Single-nucleotide-resolution mapping of m6A and m6Am throughout the transcriptome. Nat Methods. 2015;12:767–772.
- Coker H, Wei G, Brockdorff N. m6A modification of non-coding RNA and the control of mammalian gene expression. Biochim Biophys Acta Gene Regul Mech. 2019;1862:310–318.
- Hezroni H, Koppstein D, Schwartz MG, et al. Principles of long noncoding RNA evolution derived from direct comparison of transcriptomes in 17 species. Cell Rep. 2015;11:1110–1122.
- Okazaki Y, Furuno M, Kasukawa T, et al. Analysis of the mouse transcriptome based on functional annotation of 60,770 full-length cDNAs. Nature. 2002;420:563–573.
- Knauss JL, Miao N, Kim SN, et al. Long noncoding RNA Sox2ot and transcription factor YY1 co-regulate the differentiation of cortical neural progenitors by repressing Sox2. Cell Death Dis. 2018;9:799.
- Greig LC, Woodworth MB, Galazo MJ, et al. Molecular logic of neocortical projection neuron specification, development and diversity. Nat Rev Neurosci. 2013;14:755–769.
- Kwan KY, Sestan N, Anton ES. Transcriptional co-regulation of neuronal migration and laminar identity in the neocortex. Development. 2012;139:1535–1546.
- Anderson SA, Kaznowski CE, Horn C, et al. Distinct origins of neocortical projection neurons and interneurons in vivo. Cereb Cortex. 2002;12:702–709.
- Kirk JM, Kim SO, Inoue K, et al. Functional classification of long non-coding RNAs by k-mer content. Nat Genet. 2018;50:1474–1482.
- Shukla CJ, McCorkindale AL, Gerhardinger C, et al. High-throughput identification of RNA nuclear enrichment sequences. Embo J. 2018;37:e98452.
- Groff AF, Sanchez-Gomez DB, Soruco MML, et al. In vivo characterization of linc-p21 reveals functional cis-regulatory DNA elements. Cell Rep. 2016;16:2178–2186.
- Meyer KD, Saletore Y, Zumbo P, et al. Comprehensive analysis of mRNA methylation reveals enrichment in 3ʹ UTRs and near stop codons. Cell. 2012;149:1635–1646.
- Sarropoulos I, Marin R, Cardoso-Moreira M, et al. Developmental dynamics of lncRNAs across mammalian organs and species. Nature. 2019;571:510–514.
- Wang Z, Gerstein M, Snyder M. RNA-Seq: a revolutionary tool for transcriptomics. Nat Rev Genet. 2009;10:57–63.
- Dominissini D, Moshitch-Moshkovitz S, Amariglio N, et al. Transcriptome-wide mapping of N(6)-methyladenosine by m(6)A-Seq. Methods Enzymol. 2015;560:131–147.
- Liu J, Dou X, Chen C, et al. N6-methyladenosine of chromosome-associated regulatory RNA regulates chromatin state and transcription. Science. 2020;367:580-586.
- Zhang Y, Liu T, Meyer CA, et al. Model-based analysis of ChIP-Seq (MACS). Genome Biol. 2008;9:R137.
- Heinz S, Benner C, Spann N, et al. Simple combinations of lineage-determining transcription factors prime cis-regulatory elements required for macrophage and B cell identities. Mol Cell. 2010;38:576–589.
- Thorvaldsdottir H, Robinson JT, Mesirov JP. Integrative genomics viewer (IGV): high-performance genomics data visualization and exploration. Brief Bioinform. 2013;14:178–192.