
ABSTRACT
IgA nephropathy (IgAN) is the most common primary glomerular disease in China and worldwide. The proliferation of B cells is known to be associated with both risk and prognosis of IgAN, but the epigenetic mechanism underlying this association is unknown. In this study we carried out the first Epigenome-wide Association Study (EWAS) by using the latest Infinium Methylation EPIC BeadChip on 184 B cell-specific samples (92 case/control pairs) for Chinese IgAN population. After rigorous data normalization and residual batch effect correction, linear mixed effect model was used to detect methylation CpG sites associated with IgAN adjusting for age, gender and smoking. False discovery rate (FDR) less than 10% was used to account for multiple testing. Weighted gene co-methylation networks were generated to identify gene modules highly correlated with IgAN. A permutation test was performed to account for the potential effect of overfitting. After adjusting clinical covariates and potential technical batch effects, three CpGs corresponding to PCDH17, TERT, WDR82 genes and three in the intergenic regions passed the genome-wide significant threshold. Methylation network analysis identified an additional IgAN associated gene module, containing 72 significant CpGs including GALNT6, IQSEC1, CDC16 and SYS1, involved in the pathway related to tubular atrophy/interstitial fibrosis of IgAN. These results suggested important DNA methylation and gene targets in CD19+ B cells for the pathogenesis of IgAN.
Introduction:
IgA nephropathy (IgAN) is the most common primary glomerular disease in Asia and worldwide. It is recognized that 20%–50%of IgAN patients might end up with the end-stage renal disease (ESRD) within 20 years of follow-up [Citation1,Citation2], which causes a great burden for patients and society. The diagnosis of IgAN requires records by kidney biopsy presenting proliferation of the glomerular mesangium with deposition of IgA-containing immune complexes predominantly composed of immunoglobulin and complement C3 proteins. [Citation3–5]
However, the aetiology and pathogenesis of IgAN are still unclear. It is suggested that genetic factors and environmental factors are both involved in the pathogenesis of IgAN [Citation6]. Previous genome-wide association studies (GWAS) of IgAN found multiple susceptibility loci associated with IgAN, providing an essential basis to explain the pathologic process of IgAN, including activation of mucosal IgA production and nuclear factor κB (NF-κB) signalling etc., suggesting immunity response, inflammation and mucosal immunity might involve in the pathogenesis of IgAN [Citation7–11].HLA locus was claimed to have the strongest association with IgAN, as well as the relationship with other autoimmune and inflammatory disorders [Citation12,Citation13].However, a total of 11 susceptibility loci found by GWAS only explained 5.5% of the heritability of IgAN [Citation14].
Epigenetic modifications, for instance, CpG methylation, is associated with gene silencing and the patterning of gene expression that characterizes cell types and functions [Citation15].Accumulated evidences noted that it might play a significant role in gene regulation and disease susceptibility, especially in kidney function [Citation16]. However, cell type heterogeneity [Citation17]might be an essential confounding factor when interpreting the results [Citation18]. A recent study suggested that galactose-deficient IgA1 (GD-IgA1)-producing B cells may travel from mucosal site to systemic organs, such as bone marrow, lymph nodes and tonsils, and then produce the nephritogenic IgA [Citation19]. Previous studies have also confirmed that mucosal immune dysregulation was involved in the pathogenesis of IgAN and the GD-IgA1 immune complex was a determinant event to the development of IgAN [Citation20,Citation21].Taken together, as B cells are able to produce GD-IgA1 leading to IgAN pathogenesis [Citation22], we carried out the first epigenome-wide association study (EWAS) investigated the relationship between genome-wide B cells DNA methylation variation and IgAN, using the latest high-throughput DNA methylation array interrogating 850,000 CpG sites at single-nucleotide resolution, which covers a wide range of functional categories on the genome with a dynamic range of methylation variation [Citation23].We examined the association with IgAN at individual CpGs and identified co-methylation network modules that explained larger disease association.
Results
Epigenome-wide association study (EWAS)
The panel contained 184 subjects (118 female, 92 IgAN cases and 92 healthy controls) with a mean age in adults of 33.83 years (19 to 59 years) (). After adjustment of estimated B cell purity, covariates and residual batch effects estimated by smart SVA [Citation24], the genomic control factor (λGC) was 1.12, indicating little residual confounding. A total of 47,192 CpGs were nominally differentially methylated (P < 0.05) prior to FDR correction; six individual CpGs remained significant after multiple test correction with FDR<0.1 (, Table S1). Three CpGs were annotated to a known gene name using UCSC gene reference.
Table 1. Demographic characteristics of 184 participants in the current study
Figure 1. Overall study design flowchart
Figure 2. Association with IgA nephropathy (a). Manhattan plot for the association with IgA nephropathy. The blue line corresponds to the threshold of epigenome-wide significance (FDR = 0.1) (b). QQ plot for the EWAS of IgA nephropathy, lambda = 1.12
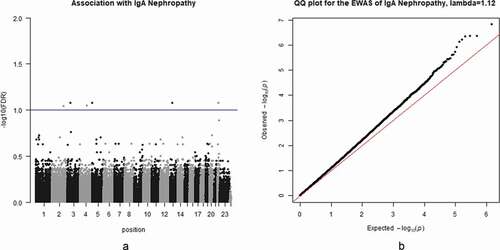
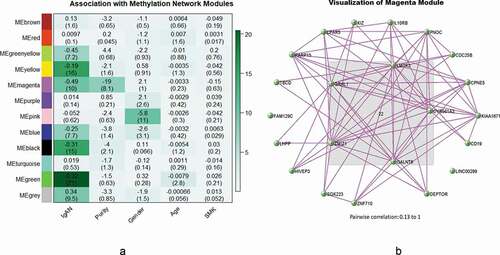
Figure 3. (a) Heatmap of association with methylation network modules: correlation coefficient of linear mix model between module eigengene(ME) and IgAN status (IgAN), cell purity (Purity), gender and smoking status(SMK) is reported with the -log10(p-value) given inside the bracket; the degree of -log10(p-value) is illustrated with the colour legend. (b) Visualization of Magenta Module: genes in the centre are the hub genes, pairwise correlation: 0.13 to 1
The most significant CpG was cg14427009 (P = 1.51 × 10⁻⁷, FDR = 0.08), which is annotated to PCDH17 encoding a protein that plays a role in the establishment and function of specific cell-cell connections [Citation25].The second most significant CpG was cg23250191 (P = 4.25 × 10⁻⁷, FDR = 0.08), annotated to TERT which encoded a catalytic-protein subunit of telomerase enzyme and plays a critical role in DNA replication and chromosomal stability [Citation26].The third most significant CpG was cg04104820 (P = 4.56 × 10⁻⁷, FDR = 0.08), annotated to WDR82 which encoded a C-terminal domain-binding protein that recruits the Setd1A Histone H3-Lys4 methyltransferase complex to transcription start sites of transcribed human genes [Citation27]. Besides, other three CpGs without annotations were located in 22q12.3, 4q25 and 2q32.1, and the closest genes were LARGE, RP11-380D23.2 and CACYBPP2, respectively.
Weighted gene co-methylation network
Construction of co-methylation network modules
WGCNA was performed based on normalized DNA methylation data. A total of 12 modules were identified. We used linear mixed model to test the association between module eigengene and IgAN status (, Table S2, Figure S1-S4). After Bonferroni correction, six modules were significantly and positively correlated with IgAN (P < 0.05/12, ). The significant CpGs in each module (module-specific FDR< 0.01, accounting for all CpGs in the module) were listed in and Table S1. The total are 218 CpGs.
Table 2. Significant probes (FDR<0.01) in all the significant modules
The top significant module is the green module (P = 8.92 × 10⁻²¹), which contained 1,258 CpGs, and the top significant CpG was at gene LOC493754 (module-specific FDR = 2.99 × 10⁻³) associated with a pseudogene, RAB Guanine Nucleotide Exchange Factor (GEF) 1 Pseudogene.
The second significant module is the yellow module (P = 3.45 × 10⁻¹⁵), which contained 1,280 CpGs, and the top CpG was at gene PCDH17 (module-specific FDR = 1.93 × 10⁻⁴) which is also the top gene in the EWAS for individual CpGs. Further, HLA-J was also found significant in the yellow module (module-specific FDR = 2.73 × 10⁻³) which was a major histocompatibility complex gene represented a transcribed pseudogene, possibly derived from HLA-A [Citation28].
The third significant module is the black module (P = 1.17 × 10⁻¹⁴) and the top CpG was at CDC42BPB (module-specific FDR = 5.03 × 10⁻³), which encoded a member of the serine/threonine protein kinase family [Citation29].The fourth significant module is the magenta module (P = 8.86 × 10⁻¹⁰), and the top CpG was at SYS1(module-specific FDR = 6.01 × 10⁻⁴), which formed a complex with ADP-ribosylation factor-related protein involved in protein trafficking [Citation30].The fifth significant module is the blue module (P = 2.40 × 10⁻⁷), and the top CpG was at LINC00341(module-specific FDR = 5.53 × 10⁻³), which constitute along with intergenic non-protein coding RNA with the function of anti-inflammatory effect [Citation31]. Finally, the sixth significant module is the green-yellow module (P = 8.35 × 10⁻⁷), but the top CpG, at MAML3, was only marginal significant (module-specific FDR = 1.85 × 10⁻²).The other 5 significant CpGs discovered by single CpG analysis were found in red and turquoise modules and both were non-significant modules.
Detection of association of modules/significant CpGs to the clinical phenotype
When using the module eigengenes to detect the association with different clinical characteristics in IgAN patients individually, no module was significantly associated with IgAN comorbidities, blood/urine lab test and pathological examinations. (P > 0.05/12, Figure S6-S19). However, the marginal significance of association was found between the magenta module and tubular atrophy/interstitial fibrosis (P = 5 × 10⁻³, Figure S19, Table S3), which is a pathological hallmark of IgAN with a worse prognosis. [Citation32,Citation33]
Similarly, we used the 223 significant CpGs (218 in WGCNA and 6 in EWAS with 1 overlapped) to test our association between individual CpG and the same clinical characteristics. Only cg27566485 in the magenta module was found significant, neighbouring IQSEC1 (P = 2.05 × 10⁻⁴, FDR = 4.6 × 10⁻², Table S4) and it was also associated with tubular atrophy/interstitial fibrosis. This gene encoded a protein that involved in the regulation of cell adhesion and actin cytoskeleton changes [Citation34–36]
Visualization of all the significant modules
The WGCNA network connections within each module were depicted by using VisANT 5.0 [Citation37]. Hub genes in each module were defined as genes that have most connections with other genes with the threshold chosen to maximize the visibility of the hub genes (Table S5-S10, , Figure S20-S24).Among all the hub genes in different modules, GALNT6 in the magenta module, was found significantly associated with IgAN (, module-specific FDR = 2.02 × 10⁻³). It encoded a kind of enzymes which was capable of glycosylating fibronectin peptide [Citation38].
Gene enrichment
We carried out gene enrichment analysis for all the significant IgAN CpGs (Table S11-S12). After multiple correction, no significance was found in KEGG Pathway analysis as well as Biology Process (BP) and Molecular Function (MF) in Gene Ontology analysis. We only found centrosome significant for Cellular Component (CC) function (FDR = 0.019). However, marginal significance was found in cytoskeleton organization (P = 8.6 × 10⁻³), cytoskeletal adaptor activity (P = 2.43 × 10⁻⁴) and protein binding (P = 2.68 × 10⁻³).
Correlations with the Expressions of Annotated Genes
We further examined whether methylation levels at the 223 IgAN related CpGs were correlated with the expression levels of annotated genes in an independent set of 144 healthy participants on Illumina HumanMethylation450 Bead Chip, published by Li et al. [Citation39]After overlapping the significant IgAN CpGs with CpG probes available in the 144 healthy participants based on the Illumina HumanMethylation450 array, a total of 89 CpGs were found available for the methylation-expression analysis. We then excluded 18 CpGs without gene expression. Of the remaining 71 CpGs (123 CpG-expression probe pairs), methylation levels at 10 CpGs (12 CpG-expression probe pairs) were significantly correlated with the expression levels of their annotated genes, after adjusting for age, gender, smoking status, drinking status and different blood cell compositions, including the proposition of neutrophils, lymphocytes, monocytes, eosinophils and basophils (FDR <0.05 for 2 pairs, P < 0.05 for 12 pairs, Table S13).
Specifically, both two significant pairs were in the green module. Of the total of 10 marginal significant annotated genes (12 CpG-expression probe pairs), 6 genes (7 CpG-expression probe pairs) were in the green module; 4 genes (5 CpG-expression probe pairs) were in the magenta module. Top significant CpG with expression (also in the green module) is annotated to CSF3R (Pexpression = 1.30 × 10⁻⁶, FDRexpression = 1.6 × 10⁻⁴), which encoded a protein, which is a member of the family of cytokine receptors functioning in some cell surface adhesion or recognition processes. [Citation40]Second top significant CpG with expression was annotated to GHRL (Pexpression = 9.30 × 10⁻⁶, FDRexpression = 5.7 × 10⁻⁴), which annotated to a protein that participates in regulating the complex process of energy homoeostasis. [Citation41]And top significant CpG with expression in magenta module annotated to CDC16 (Pexpression = 1.8 × 10⁻²), which encoded a protein that regulated cell proliferation or differentiation. [Citation42]
Discussions
To our knowledge, the present study is the first and largest EWAS study using CD19 + B-cell samples from IgAN patients and controls from the Chinese population using the high-throughput DNA methylation array for 850,000 CpG sites. We comprehensively assessed genome-wide methylation associated with IgAN, identified gene network modules enriched with IgAN association and found the gene expression association. CpG EWAS analysis suggested that three CpGs corresponding to PCDH17, TERT, WDR82 genes might play a role for IgAN. Network analysis and gene expression analysis not only validated EWAS results, but also notably identified a discovered module, containing 72 significant CpGs, might involve in the pathway expression and pathological progression of IgAN at GALNT6, IQSEC1, CDC16 and SYS1 genes.
We identified the top significant CpG annotated to PCDH17 in both EWAS and the yellow module from WGCNA. It belongs to the protocadherin gene family. Numerous studies indicated that PCDH17 functions as a tumour suppressor, which is frequently inactivated by aberrant promoter DNA methylation in a variety of tumours, such as renal cell carcinoma and B cell precursor acute lymphoblastic leukaemia [Citation43,Citation44]. The mechanism of the tumour suppressor functionality may be due to the inhibition of EMT and tumour cell migration. [Citation45,Citation46]Although no previous study found its correlation with IgAN, studies found PCDH17 were associated with elevated early antibody production [Citation47], which suggested a potential role in immune responses in the inflammation of IgAN.
In addition, WDR82 was found significant in EWAS, as well as identified significant in gene expression analysis. It was reported to be involved in transcriptional activation and found to promote the activity of NF-κB signalling and its induction of genes encoding chemokine in the immune environment [Citation27,Citation48]which is consistent to a previous GWAS study by Kiryluk et al. [Citation9], claiming that NF-κB signalling pathway indicated critical steps in the pathogenesis of IgAN.
As for TERT, it was also found significant in the EWAS. The encoding protein telomerase was found to have nominal associations with lupus nephritis, which has a similar pathological presentation of IgAN [Citation49]. It was detected to enhance the function of lymphocytes in immune responses [Citation50]. And the telomerase activity was significantly increased in CD19+ B cells from patients with SLE, which might also suggest a potentially similar pattern in IgAN [Citation51].
Another notable observation is that we found magenta module may play an essential role in the expression of pathogenesis pathway and pathological progression, based on the weighted gene co-methylation network of IgAN. Firstly, visualization of hub genes in magenta module suggested that GALNT6 was a potential candidate gene for IgAN pathogenesis pathway. It encodes protein involving in the development of glycosylation [Citation52], whose abnormalities would result in IgAN with poor pathological consequences, such as glomerular fibrosis and renal failure [Citation53]. These results further supported our previous finding that glycosylation-deficient IgA1 contributed to IgAN pathogenesis [Citation22]. As IgA1 was mainly produced by the B cells, we highlighted gene GALNT6 for its potentiality to be a key role for IgAN.
Secondly, methylation-gene expression analysis showed almost half of CpG-expression probe pairs (five genes in the magenta module) had marginal significant correlations with gene expressions. Both methylation-associated upregulation and downregulation trend of the key genes expression in this module could help understand the pathogenesis of gene pathways. The top significant gene was CDC16 and the encoded protein has been reported to be an important component of the Anaphase Promoting Complex/Cyclosome (APC/C). Since APC/C might govern cell cycle progression [Citation54], it was suggested that CDC16 protein may play pivotal roles in the progress of IgAN in maintaining genomic integrity and cellular metabolism of B cells. Further, some studies suggested that CDC16 gene may participate in renal carcinogenesis [Citation55]and its expression level was altered in the pancreas and adipose tissue in pre-diabetic status (49). Meanwhile, it is important to address that we cannot exclude the reverse causation, since the CpG of CDC16 could also be the outcome of the progression of IgAN.
Thirdly, the magenta module also showed marginal significant association with IgAN pathological progression. Not only the module analysis but also individual CpG association indicated that tubular atrophy/interstitial fibrosis, one of the pathological presentations, was found to associate with IQSEC1 significantly (P = 2.05 × 10⁻⁴, FDR = 4.6 × 10⁻², Table S4).This result was strongly validated by many previous studies. [Citation34–36] Furthermore, the magenta module was also significantly correlated with cell purity (P = 7.67 × 10⁻⁹, , Table S2). The reason may be that it contained the CD19 gene which was the most reliable surface biomarker for B cells.
We also expected originally that there might be an association of methylated genes and the serum IgA levels, according to the clinical presentations, but no significant results were found. The reason may be other genes directly related to the increase of serum IgA, instead of methylation genes [Citation56].
Moreover, the green module was also identified significant in both network analysis and gene expression analysis, which also indicated a potential signalling pathway gene network of IgAN. Other than green module-owned genes, namely CSF3R, GHRL and LOC493754, significant genes discovered by our study also included SYS1, LINC00341 and CDC42BPB. They were all found involved in immune response or auto-immune diseases [Citation31,Citation57–60], which might be potentially related to the immune mechanism of IgAN.
Further, previous GWAS reported that HLA complex family was among the strongest association to IgAN, including HLA-DQ, HLA-DR and HLA-B [Citation12,Citation61].Our results also highlighted the potential important role for the HLA family, and suggested that methylation at this locus, even the psydogene of HLA, HLA-J, was of significance in the pathogenesis of IgAN.
We also acknowledge the limitations in this study. First of all, our study has a limited sample size and lack of independent cohort for replication. Since the proportion of our target cells, CD19+ B cells, were low in peripheral blood cells, a relatively large amount of blood was required. And the requirement for a kidney biopsy for diagnosing IgAN is also a major obstacle and a limiting step for large case groups, as all the patients were only recruited from one single centre. Secondly, potential influence from residual confounding might exist. However, we used smartSVA [Citation24] and mixed model analysis to adjust significant random batch effect, the potential inflation due to unadjusted confounding effect is small as indicated by λGC value, ensure the robustness of our results. Thirdly, only whole blood sample on Illumina HumanMethylation450 BeadChip in healthy individuals was available to investigate the relation between DNA methylation and gene expression, therefore heterogeneity of cell type and CpG number should be considered when interpreting the results.
Despite the above limitations, this first EWAS for IgAN has many strengths. Firstly, our study is still the largest EWAS about IgAN targeting tissue-specific samples, though restricted by sample size considering the low proportion of B cells and the biopsy step for diagnosis. Secondly, since the proliferation of B cell is associated with the pathogenesis of IgAN [Citation19–21], we focused on B cells to avoid the heterogeneity from whole blood cells. Thirdly, our network analysis increases the power for association analysis and reduces the burden of multiple hypothesis testing to strengthens the findings, to provide more evidence for the functional impact of DNA methylation levels. Therefore, our genome-scale result might allow the possibility of unbiased search for important genes and provide insight for future locus-specific studies.
Overall, these findings suggested that DNA methylation variation might involve in the pathogenesis of IgAN, which may provide targets for future investigation of the epigenetic component for IgAN. They could be considered as a potential for diagnosis and future therapy targets for IgAN.
Methods
Data collection
Overall study design flowchart is provided in detail in . The study population included 92 IgAN patients (cases) and 92 healthy subjects (controls), matched by age (±5 years old) and gender, from The First Affiliated Hospital of Sun Yat-sen University in 2016. The inclusion criteria for IgAN patients were as follows: (1) IgAN patients diagnosed by renal biopsy following the WHO criteria; (2) age≥18 years; (3) had never received glucocorticoid or immunosuppressant treatment, or withdrawal for more than 3 months. The exclusion criteria were: (1) secondary IgA nephropathy such as purpura nephritis, hepatitis B-associated glomerulonephritis and lupus nephritis; (2) patients with infectious diseases, severe infection or other chronic diseases such as diabetes. Clinical information was collected including age, gender, smoking status, hypertension, oedema, blood and urinary routine test results, 24-hour proteinuria, blood urea nitrogen (BUN), serum creatinine (Scr), estimate glomerular filtration rate (eGFR) (calculated using the MDRD formula), serum IgA level, serum C3 level, Lee’s pathological grade and Oxford classification. Healthy volunteers with a normal urine test and renal function were included and clinical information such as age, gender, smoking status, blood and urinary routine test results, Scr, BUN and eGFR was also collected. About 15 ml of whole peripheral blood was collected in sodium heparin tubes from IgAN patients and controls, and processed within 2 hours after the blood draw. Peripheral blood mononuclear cells (PBMC) were isolated using the Ficoll-density gradient method, and then wash the PBMCs in PBS to decrease the debris or platelet in samples, stained with anti-human CD19 PE (affymetrix eBioscience), CD19+ B cells were isolated by flow cytometry and genomic DNA was extracted with QIAGEN DNA easy kits. DNA methylation level was measured using the Infinium Methylation EPIC BeadChip, which interrogates ~850,000 CpG sites. The study was approved by the Institutional Review Board at The First Affiliated Hospital of Sun Yat-sen University. Informed consent was obtained from all of the participants.
To explore the relation between blood DNA methylation and gene expression in healthy individuals, we utilized the methylation-expression association results based on 144 healthy participants who attended health examinations at the Health Examination Center of Dongfeng Central Hospital (Dongfeng Motor Corporation and Hubei University of Medicine) in Shiyan, Hubei, China, generated by Li et al 2017 [Citation39].
Preprocessing of DNA methylation microarray
All the data were preprocessed using an established pipeline from minfi package, and analysed in R version 3.4.4 using packages available in Bioconductor, including preprocess Noob, minfiQC, plotSex, plotQC [Citation62,Citation63].Probes were excluded if they: 1) Assay SNPs rather than CpGs(drop 59 probes), 2) overlap with 1000 Genomes Project 20,130,502 release for EAS population with minor allele frequency (MAF) > 0.05 at (1) target CpG sites; (2) single base extension sites of Type I probes; and (3) overlapping the probe body; 3) CpG probes possibly cross-hybridized to other genomic locations (drop 113,863 probes); 4) Missing rate > 20% across samples (missing is defined as for a probe of a certain sample, detection P value >0.01) (drop 1,282 probes). Samples were removed if they: 1) minimum discernible signal (MDS) outliers; 2) Gender mix-up samples; 3) Missing rate > 0.05 across probes (no sample excluded). A total of 740,039 CpGs passed the preprocessing and quality control (QC) pipeline; all participants (n = 184) passed the QC metrics. No outliers were detected after isoMDS [Citation64]. Residual batch effects were adjusted using the smart surrogate variable analysis (smartSVA) [Citation24].
Methylation association analysis with IgAN
We used the generalized linear mixed model to examine the association between IgAN case-control status and methylation level at individual CpGs, which was used as the outcome in the regression model. The association model was adjusted for potential confounders, including cell purity, age, sex and smoking as fixed effect and chip ID as a random effect. We estimated the B cell purity using fuction ‘estimateCellCounts’ from minfi package. The false discovery rate (FDR) was estimated using the Benjamini-Hochberg approach [Citation65]with p. adjust package [Citation64]. We use FDR less than 10% to determine genome-wide significant CpGs in relation to IgAN. The relationship between DNA methylation and gene was obtained based on official EPIC array data annotation file [Citation66].
Weighted gene co-methylation network analysis
In order to identify potential methylation pathway or network substructure among genes related to IgAN, weighted gene co-methylation networks were generated for top 20,000 IgAN CpGs using the R package WGCNA [Citation67,Citation68]. Automatic network construction was used with the function ‘block wise Modules’ with minimum module size set to 30 CpGs. Modules were ultimately created and merged using the default setting for merge Cut Height 0.25. Each newly created module, named by colour code, was then correlated with the presence or absence of IgAN, using the module eigengene (the first principal component of all CpGs assigned to the module). In the generalized linear mixed model, we also adjusted for the same set of covariates and surrogate variables as in the individual CpG association analysis. We highlighted network modules that were associated with IgAN after Bonferroni correction for the number of modules (P < 0.05/number of modules). Within a significant module, we determined the significant CpGs in modules after Benjamini-Hochberg FDR accounting for the number of CpGs within the module (module-specific FDR < 0.01). After that, since most of the clinical characteristics (comorbidities, blood/urine test and pathological examinations) were collected only in the case group, we explored the association of the individual clinical phenotype to the same modules in IgAN patients group (Bonferroni correction P < 0.05/number of modules).
In order to depict the connection among the annotated genes, the visualization of network modules and their hub genes were performed by VisANT 5.0 (http://visant.bu.edu/) [Citation37) [Citation37]. Because each module is rather large, the connection between top 30 hub genes were defined based on different pairwise correlations threshold chosen to maximize the visibility of network topological structure.
Permutation test to confirm the validity of WGCNA
In order to examine whether exist of potential overfitting of a network module with IgAN due to the fact that top 20,000 CpGs in EWAS were selected to build the network to overcome computation burden. We shuffled all the cases and control group and re-performed EWAS. Then the newly generated top 20,000 CpGs were applied in the WGCNA to detect the network modules and subsequently tested for association with IgAN. We found no inflated false positive due to the selection of top 20,000 CpGs (Figure S5, Table S14).
Gene Enrichment Analysis and Gene Expression Analysis
For all the significant IgAN CpGs, we performed gene enrichment analysis using their annotated genes (DAVID, https://david.ncifcrf.gov/) [Citation69, Citation70]. Besides, we also analysed the methylation-expression correlations among 144 healthy individuals’ whole blood samples from our co-author Dr. Li’s previous research [Citation39]on Illumina HumanMethylation450 BeadChip (450 K) and Illumina HumanHT-12 v4 BeadChip. Since CpGs in 450 K chip are not completely included in EPIC chip, we merged matched data with significant IgAN CpGs using R function ‘merge’. We then fitted linear regressions where normalized and inverse normal transformed expression values were included as dependent variables, normalized methylation values as indicators, and age, gender, smoking status, drinking status and different blood cell compositions as covariates. The statistical significance threshold was FDR<0.05.
Author contributions
LL and XY design the study. PY, YP, ML and JL collect the data, perform experiment, etc., supervised by XY. YL, ZZ and PY performed the statistical analysis, supervised by LL. YL and ZZ wrote the first draft of the article; YP and ML interpreted results and participated in developing the manuscript. All authors contributed to revising the manuscript critically for important intellectual content and gave their final approval for the version of the manuscript being published.
Supplemental Material
Download Zip (96.1 MB)Acknowledgements
This research was funded in part by the National Key Research and Development Project, China (No. 2016YFC0906101), the Operational Grant of Guangdong Provincial Key Laboratory, China (No. 2017B030314019), Key Laboratory of Nephrology, Guangdong Province, Guangzhou, China (No. 2002B60118), the Guangdong Provincial Program of Science and Technology, China (No. 2017A050503003; No. 2017B020227006), the Guangzhou Municipal Program of Science and Technology, China (No. 201704020167). We thank all of the subjects and healthy volunteers who participated in this work. We also thank the staff of The First Affiliated Hospital of Sun Yat-sen University for help with the sample preparation.
Disclosure statement
No potential conflict of interest was reported by the authors.
Supplementary material
Supplemental data for this article can be accessed here.
Additional information
Funding
Related Research Data
References
- Wyatt RJ, Julian BA. IgA nephropathy. N Engl J Med. 2013;368(25):2402–2414.
- Kiryluk K, Li Y, Sanna-Cherchi S, et al. Geographic differences in genetic susceptibility to IgA nephropathy: GWAS replication study and geospatial risk analysis. PLoS Genet. 2012;8:e1002765.
- Donadio JV, Grande JP. IgA nephropathy. N Engl J Med. 2002;347:738–748.
- D’Amico G. The commonest glomerulonephritis in the world: igA nephropathy. Q J Med. 1987;64:709–727.
- Barratt J, Feehally J. IgA nephropathy. J Am Soc Nephrol. 2005;16:2088–2097.
- Lai KN. Pathogenesis of IgA nephropathy. Nat Rev Nephrol. 2012;8:275–283.
- Yu XQ, Li M, Zhang H, et al. A genome-wide association study in Han Chinese identifies multiple susceptibility loci for IgA nephropathy. Nat Genet. 2011;44:178–182.
- Li M, Foo JN, Wang JQ, et al. Identification of new susceptibility loci for IgA nephropathy in Han Chinese. Nat Commun. 2015;6:7270.
- Kiryluk K, Li Y, Scolari F, et al. Discovery of new risk loci for IgA nephropathy implicates genes involved in immunity against intestinal pathogens. Nat Genet. 2014;46:1187–1196.
- Gharavi AG, Kiryluk K, Choi M, et al. Genome-wide association study identifies susceptibility loci for IgA nephropathy. Nat Genet. 2011;43:321–327.
- Saka S, Hirawa N, Oka A, et al. Genome-wide association study of IgA nephropathy using 23 465 microsatellite markers in a Japanese population. J Hum Genet. 2015;60:573–580.
- Feehally J, Farrall M, Boland A, et al. HLA has strongest association with IgA nephropathy in genome-wide analysis. J Am Soc Nephrol. 2010;21:1791–1797.
- Zhu Z, Lee PH, Chaffin MD, et al. A genome-wide cross-trait analysis from UK Biobank highlights the shared genetic architecture of asthma and allergic diseases. Nat Genet. 2018;50:857–864.
- Foo JN, Liu J, Yu XQ. GWAS reveal novel IgA nephropathy risk loci. Oncotarget. 2015;6:15738–15739.
- Deaton AM, Webb S, Kerr AR, et al. Cell type-specific DNA methylation at intragenic CpG islands in the immune system. Genome Res. 2011;21:1074–1086.
- Chu AY, Tin A, Schlosser P, et al. Epigenome-wide association studies identify DNA methylation associated with kidney function. Nat Commun. 2017;8:1286.
- Jaffe AE, Irizarry RA. Accounting for cellular heterogeneity is critical in epigenome-wide association studies. Genome Biol. 2014;15:R31.
- Susztak K. Understanding the epigenetic syntax for the genetic alphabet in the kidney. J Am Soc Nephrol. 2014;25:10–17.
- Muto M, Manfroi B, Suzuki H, et al. Toll-Like Receptor 9 Stimulation Induces Aberrant Expression of a Proliferation-Inducing Ligand by Tonsillar Germinal Center B Cells in IgA Nephropathy. J Am Soc Nephrol. 2017;28:1227–1238.
- Soares MF. An update on pathology of IgA nephropathy. Jornal Brasileiro De Nefrologia Orgao Oficial De Sociedades Brasileira E Latino-Americana De Nefrologia. 2016;38:435–440.
- Gan L, Zhou Q, Li X, et al. Intrinsic renal cells induce lymphocytosis of Th22 cells from IgA nephropathy patients through B7-CTLA-4 and CCL-CCR pathways. Mol Cell Biochem. 2018;441:191–199.
- Gale DP, Molyneux K, Wimbury D, et al. Galactosylation of IgA1 Is associated with common variation in C1GALT1. J Am Soc Nephrol. 2017;28:2158–2166.
- Illumina. Infinium MethylationEPIC Kit. 2019.
- Chen J, Behnam E, Huang J, et al. Fast and robust adjustment of cell mixtures in epigenome-wide association studies with SmartSVA. BMC Genomics. 2017;18:413.
- Nollet F, Kools P, van Roy F. Phylogenetic analysis of the cadherin superfamily allows identification of six major subfamilies besides several solitary members. J Mol Biol. 2000;299:551–572.
- Weinrich SL, Pruzan R, Ma L, et al. Reconstitution of human telomerase with the template RNA component hTR and the catalytic protein subunit hTRT. Nat Genet. 1997;17:498–502.
- Wu M, Wang PF, Lee JS, et al. Molecular regulation of H3K4 trimethylation by Wdr82, a component of human Set1/COMPASS. Mol Cell Biol. 2008;28:7337–7344.
- Messer G, Zemmour J, Orr HT, et al. HLA-J, a second inactivated class I HLA gene related to HLA-G and HLA-A. Implications for the evolution of the HLA-A-related genes. J Iimmunol. 1992;148:4043–4053.
- Kim YJ, Kim NY, Lee MK, et al. Overexpression and unique rearrangement of VH2 transcripts in immunoglobulin variable heavy chain genes in ankylosing spondylitis patients. Exp Mol Med. 2010;42:319–326.
- Behnia R, Panic B, Whyte JR, et al. Targeting of the Arf-like GTPase Arl3p to the Golgi requires N-terminal acetylation and the membrane protein Sys1p. Nat Cell Biol. 2004;6:405–413.
- Huang TS, Wang KC, Quon S, et al. LINC00341 exerts an anti-inflammatory effect on endothelial cells by repressing VCAM1. Physiol Genomics. 2017;49:339–345.
- Schelling JR. Tubular atrophy in the pathogenesis of chronic kidney disease progression. Pediatr Nephrol. 2016;31:693–706.
- Lusco MA, Fogo AB, Najafian B, et al. AJKD atlas of renal pathology: tubular atrophy. Am J Kidney Dis. 2016;67:e33–34.
- Wing MR, Ramezani A, Gill HS, et al. Epigenetics of progression of chronic kidney disease: fact or fantasy? Semin Nephrol. 2013;33:363–374.
- Wing MR, Devaney JM, Joffe MM, et al. S. Chronic Renal Insufficiency Cohort, DNA methylation profile associated with rapid decline in kidney function: findings from the CRIC study. Nephrol Dialysis Trans. 2014;29:864–872.
- Rodriguez-Romo R, Berman N, Gomez A, et al. Epigenetic regulation in the acute kidney injury to chronic kidney disease transition. Nephrology. 2015;20:736–743.
- Hu Z, Snitkin ES, DeLisi C. VisANT: an integrative framework for networks in systems biology. Brief Bioinform. 2008;9:317–325.
- Liesche F, Kolbl AC, Ilmer M, et al. Role of N-acetylgalactosaminyltransferase 6 in early tumorigenesis and formation of metastasis. Mol Med Rep. 2016;13:4309–4314.
- Li J, Zhu X, Yu K, et al. Genome-wide analysis of DNA methylation and acute coronary syndrome. Circ Res. 2017;120:1754–1767.
- Zhang H, Coblentz C, Watanabe-Smith K, et al. Gain-of-function mutations in granulocyte colony-stimulating factor receptor (CSF3R) reveal distinct mechanisms of CSF3R activation. J Biol Chem. 2018;293:7387–7396.
- Folgueira C, Seoane LM, Casanueva FF. The brain-stomach connection. Front Horm Res. 2014;42:83–92.
- Hu X, Kim H, Raj T, et al. Regulation of gene expression in autoimmune disease loci and the genetic basis of proliferation in CD4+ effector memory T cells. PLoS Genet. 2014;10:e1004404.
- Uyen TN, Sakashita K, Al-Kzayer LF, et al. Aberrant methylation of protocadherin 17 and its prognostic value in pediatric acute lymphoblastic leukemia. Pediatr Blood Cancer. 2017;64. DOI:https://doi.org/10.1002/pbc.26259
- Lin YL, Wang YP, Li HZ, et al. Aberrant promoter methylation of PCDH17 (Protocadherin 17) in serum and its clinical significance in renal cell carcinoma. Med Sci Monit. 2017;23:3318–3323.
- Yin X, Xiang T, Mu J, et al. Protocadherin 17 functions as a tumor suppressor suppressing Wnt/beta-catenin signaling and cell metastasis and is frequently methylated in breast cancer. Oncotarget. 2016;7:51720–51732.
- Hu X, Sui X, Li L, et al. Protocadherin 17 acts as a tumour suppressor inducing tumour cell apoptosis and autophagy, and is frequently methylated in gastric and colorectal cancers. J Pathol. 2013;229:62–73.
- Falola MI, Wiener HW, Wineinger NE, et al. Genomic copy number variants: evidence for association with antibody response to anthrax vaccine adsorbed. PloS One. 2013;8:e64813.
- Serrels B, McGivern N, Canel M, et al. IL-33 and ST2 mediate FAK-dependent antitumor immune evasion through transcriptional networks. Sci Signal. 2017;10. DOI:https://doi.org/10.1126/scisignal.aan8355
- Zhou XJ, Nath SK, Qi YY, et al. Novel identified associations of RGS1 and RASGRP1 variants in IgA Nephropathy. Sci Rep. 2016;6:35781.
- Hathcock KS, Jeffrey Chiang Y, Hodes RJ. In vivo regulation of telomerase activity and telomere length. Immunol Rev. 2005;205:104–113.
- Klapper W, Moosig F, Sotnikova A, et al. Telomerase activity in B and T lymphocytes of patients with systemic lupus erythematosus. Ann Rheum Dis. 2004;63:1681–1683.
- Lin J, Chung S, Ueda K, et al. GALNT6 stabilizes GRP78 protein by o-glycosylation and enhances its activity to suppress apoptosis under stress condition. Neoplasia. 2017;19:43–53.
- Stuchlova Horynova M, Raska M, Clausen H, et al. Aberrant O-glycosylation and anti-glycan antibodies in an autoimmune disease IgA nephropathy and breast adenocarcinoma. Cell Mol Life Sci. 2013;70:829–839.
- Zhang J, Wan L, Dai X, et al. Functional characterization of anaphase promoting complex/cyclosome (APC/C) E3 ubiquitin ligases in tumorigenesis. Biochim Biophys Acta. 2014;1845:277–293.
- Gotoh M, Ichikawa H, Arai E, et al. Comprehensive exploration of novel chimeric transcripts in clear cell renal cell carcinomas using whole transcriptome analysis. Genes Chromosomes Cancer. 2014;53:1018–1032.
- Kiryluk K, Julian BA, Wyatt RJ, et al. Genetic studies of IgA nephropathy: past, Present, and Future. Pediatr Nephrol. 2010;25:2257–2268.
- Parikh SV, Malvar A, Song H, et al. Molecular imaging of the kidney in lupus nephritis to characterize response to treatment. Transl Res. 2017;182:1–13.
- Li C, Zhang G, Li X, et al. A systematic method for mapping multiple loci: an application to construct a genetic network for rheumatoid arthritis. Gene. 2008;408:104–111.
- Kumar V, Matsuo K, Takahashi A, et al. Common variants on 14q32 and 13q12 are associated with DLBCL susceptibility. J Hum Genet. 2011;56:436–439.
- Gabrielsen IS, Amundsen SS, Helgeland H, et al. Genetic risk variants for autoimmune diseases that influence gene expression in thymus. Hum Mol Genet. 2016;25:3117–3124.
- Gillies CE, Putler R, Menon R, et al. N. Nephrotic Syndrome Study, N. Hacohen, K. Kiryluk, M. Kretzler, X. Wen, M.G. Sampson, An eQTL Landscape of Kidney Tissue in Human Nephrotic Syndrome. Am J Hum Genet. 2018;103:232–244.
- Huber W, Carey VJ, Gentleman R, et al. Orchestrating high-throughput genomic analysis with Bioconductor. Nat Methods. 2015;12:115–121.
- Fortin JP, Triche TJ Jr., Hansen KD. Preprocessing, normalization and integration of the Illumina HumanMethylationEPIC array with minfi. Bioinformatics. 2017;33:558–560.
- Team RC. R: A Language and Environment for Statistical Computing. 2019.
- Benjamini Y, Hochberg Y. Controlling the false discovery rate: a practical and powerful approach to multiple testing. J R Stat Soc Series B Stat Methodol. 1995;289–300. DOI:https://doi.org/10.1111/j.2517-6161.1995.tb02031.x
- Illumina. Infinium MethylationEPIC Product Files. 2017.
- Zhang B, Horvath S. A general framework for weighted gene co-expression network analysis. Stat Appl Genet Mol Biol. 2005;4:Article 17.
- Langfelder P, Horvath S. WGCNA: an R package for weighted correlation network analysis. BMC Bioinformatics. 2008;9:559.
- Huang da W, Sherman BT, Lempicki RA. Bioinformatics enrichment tools: paths toward the comprehensive functional analysis of large gene lists. Nucleic Acids Res. 2009;37:1–13.
- Huang da W, Sherman BT, Lempicki RA. Systematic and integrative analysis of large gene lists using DAVID bioinformatics resources. Nat Protoc. 2009;4:44–57.