
ABSTRACT
Neuromedin U (NMU) is a neuropeptide involved in gut-brain axis, energy balance and immune response. We aimed at analysing the association between NMU epigenetic variability and metabolic indices and the potential mediating role of low-grade inflammation in a general population of Italian adults.
NMU Blood DNA methylation levels at two CpG islands (NMU76 and NMU32) were analysed using pyrosequencing in a randomly selected sub-cohort of 1,160 subjects from the Moli-sani study (≥35years; 49.20% men). Multivariable regressions adjusted for age, sex, smoking, alcohol and vegetable consumption were performed to estimate the associations between methylation and metabolic phenotypes (BMI, waist-to-hip ratio, blood pressure, glucose, HOMA-IR, lipids, lipoprotein(a) and apolipoproteins). Mediation analysis was performed to identify the influence of low-grade inflammation in the association using a composite index based on C reactive protein, granulocyte-to-lymphocyte ratio (GLR), platelet and white blood cell counts (INFLA-score).
Using principal component analysis four methylation factors were identified: NMU76-F1, NMU76-F2, NMU32-F1 and NMU32-F2. NMU76-F1 was FDR significantly associated with total cholesterol (for 1 SD increase: β = 4.5 ± 1.4 mg/dL of, R2 = 10.8%, p = 0.001), ApoB (0.03 ± 0.01 g/L, 12.2%, p = 0.0004), with INFLA-score (1.05 ± 0.22, p = 2.7E-6) and GLR (-0.27 ± 0.03, 30.4%, p = 1.3E-20). GLR and lymphocyte numbers mediate the association of NMU76-F1 with cholesterol (24.0% of total effect, Sobel p = 0.013) and ApoB (42.6%, p = 9E-7), respectively.
These findings suggest that NMU promoter methylation patterns could mark a pathway linking lipids with haematopoiesis and systemic inflammation.
Introduction
Metabolic disturbances include a set of interconnected characteristics such as dyslipidaemia, elevation of arterial blood pressure (BP), unbalanced glucose homeostasis, insulin resistance and abdominal obesity that directly increase the risk of cardiovascular diseases (CVD). More recently, other abnormalities such as chronic low-grade inflammation and a prothrombotic state have also been associated with metabolic alterations [Citation1]. All these conditions often occur together in the so-called metabolic syndrome and interact to increase cardiovascular risk. However, the underlying mechanisms are not yet known. Chronic low-grade inflammation, in particular, has been proposed as one of the main factors involved both in the onset of metabolic features and in their pathophysiological consequences [Citation2].
Neuromedin U (NMU) is a multifunctional hypothalamic neuropeptide widely expressed in several body districts [Citation3] which exerts its function through two G-protein-coupled receptors: Neuromedin U Receptor 1 (NMUR1), mainly present in peripheral organs, and Neuromedin U Receptor 2 (NMUR2), preferentially expressed in the central nervous system [Citation4]. Besides playing a role in various metabolic functions, numerous studies performed using murine models points to the importance of this neuropeptide in both inflammation and metabolic factors. NMU has been found to be involved in inflammatory and immune responses [Citation5], as it is expressed in human mast cells, monocytes and dendritic cells [Citation6]. The NMU–NMUR1 neuronal signalling circuit provides a selective mechanism through which the enteric nervous system and the innate immune system are integrated to promote rapid type 2 cytokine responses that can induce anti-microbial, inflammatory and tissue-protective type 2 responses at mucosal sites [Citation7]. Our group reported that NMU can potentiate platelet activation induced by weak agonists through interaction with NMUR1 [Citation8]. These data also suggest a previously unrecognized role for NMU as a regulator of (platelet assisted) inflammatory processes. A significant association of NMU genetic variants with overweight and obesity in adults and children has been found [Citation9] and we have described NMU haplotype and polymorphism variability to be associated with obesity [Citation10], food preferences [Citation11], and bone health in a population of European children [Citation12].
Epigenetic modifications have been recognized as underlying phenomena to the onset of metabolic diseases and inflammation [Citation13]. Exposure to a prenatal famine environment has been associated with a persistent decrease in DNA methylation of genes closely linked to growth, nutrient metabolism, cardiovascular function and inflammation [Citation14]. Furthermore, an association between peripheral white blood cell DNA methylation and waist circumference was found in specific CpG sites of several genes mainly related to inflammation, obesity, diabetes and atherosclerosis [Citation15].
The identification of specific pathways, as well as of their markers, underlying the development of inflammatory-mediated metabolic disturbances could be crucial to suggest new targets for preventive interventions and new biomarkers for risk assessment. We aimed at investigating the possible association of NMU DNA methylation levels with metabolic indices and the potential mediating role of low-grade inflammation.
Materials and methods
Study population
The study population was composed of subjects of the Moli-sani study (N = 24,325; 49.20% men; ≥ 35 years) randomly recruited from the general population of Molise Region, in 2005–2010 [Citation16]. For this study we used data from a randomly selected sub-cohort of 1,160 subjects, with the exclusion of subjects with unreliable questionnaires or with missing values in core variables (N = 1,015). The analysed sub-cohort and the whole Moli-sani population showed similar values in all variables considered for this study (Table S1). The Moli-sani study complies with the Declaration of Helsinki and was approved by the Ethical Committee of the Catholic University in Rome, Italy. All participants provided written informed consent.
Data collection
Detailed, structured questionnaires on medical history and lifestyle were administered to all subjects. A full description of collected data is reported elsewhere [Citation17]. Physical activity during leisure time was assessed by a structured questionnaire and expressed as daily energy expenditure in metabolic equivalent task-hours (MET-h/day). Food intake during the year before enrolment was assessed by the validated Italian EPIC food frequency questionnaire [Citation18]. Adherence to the Mediterranean diet was defined according to the Mediterranean Diet Score [Citation19]. Hypertension was defined as systolic blood pressure ≥140 mm Hg or diastolic blood pressure ≥90 mm Hg or treatment for hypertension. Hypercholesterolemia was defined if total cholesterol ≥240 mg/dL or by use of specific medication. Diabetes was defined as fasting blood glucose ≥126 mg/dL, or on the basis of specific pharmacological treatment. Metabolic syndrome (MetS) was defined according to the Adult Treatment Panel III criteria [Citation20]. Body weight and height were measured on a standard beam balance scale with an attached ruler with subjects wearing no shoes and only light indoor clothing. BMI was calculated as weight(kg)/height(m)2. Waist and hip circumferences were measured according to the National Institutes of Health, Heart, Lung, and Blood Guidelines [Citation21].
Biochemical analyses in the Moli-sani cohort
Blood samples were obtained between 07:00 and 09:00 from participants who had fasted overnight and had refrained from smoking for at least 6 h. Hemochromocytometric analyses were performed on freshly collected blood by a cell counter (Coulter HMX, Beckman Coulter, IL, Milan, Italy) within 3 hours from venipuncture. High sensitivity C-reactive protein (hs-CRP) was measured in freshly prepared serum samples by a particle-enhanced immunoturbidimetric assay (IL 350 Instrumentation Laboratory, Milan, Italy). Quality control for hs-CRP was maintained using in-house serum pool and internal laboratory standard; inter- and intra-day CV for hs-CRP were 5.5% and 4.2%, respectively. Serum lipids and glucose were assayed by enzymatic reaction methods using an automatic analyser (ILab 350, Instrumentation Laboratory, Milan, Italy). The concentration of low-density lipoprotein (LDL) cholesterol was calculated using Friedewald’s formula. These analyses were performed in the centralized Moli-sani laboratory. Insulin, apolipoprotein A and B and Lp(a) measurements were performed using automated immunoassay on samples frozen under liquid nitrogen and subsequently transferred to the BiomarCaRE project centralized laboratory [Citation22]. HOMA-IR (Homoeostatic Model Assessment of Insulin Resistance) were calculated as insulin(mU/L)*glucose(mg/dL)/405 [Citation23].
To assess overall low-grade inflammation condition, we used the INFLA-score index [Citation24–26], a composite score built up by combining deciles of hs-CRP, white blood cells (WBC), platelet count (PLT) and granulocyte-to-lymphocyte ratio (GLR). For all four components, the condition of being in the lowest deciles (1 to 4) was negatively scored from −4 to −1, being in the mid-deciles (5 or 6) was assigned a score of zero (0), being in the highest deciles (7 to 10) was scored from +1 to +4. The INFLA-score ranged between −16 and 16. An increase in this score indicates an increase in the global low-grade inflammation condition.
DNA methylation analysis
NMU methylation analysis was performed on white blood cell DNA using the Pyrosequencer Q48 Autoprep (QIAGEN) platform. Buffy coats of peripheral blood cells were freshly isolated from whole blood samples collected in sodium citrate EDTA by centrifugation at 3000 rpm for 20 min at RT and frozen under liquid nitrogen. DNA was subsequently extracted using a silica matrix-based method as previously described [Citation27]. We selected two regions in NMU (chr4:55,595,229–55,636,698, GRCh38/hg38, ) for the methylation study: the CpG island 76 (CGI76, chr4:55,635,746–55,636,498), in the promoter and the CpG island 32 (CGI32, chr4:55,619,358–55,619,556), in intron 2. For both CpG islands studied (NMU76: chr4:55,635,769–55,636,032 and NMU32: chr4:55,619,257–55,619,498, GRCh38/hg38 Assembly), amplicons covering 11 CpG sites for each island were designed using Pyromark Assay Design software (NMU76: Forward primer, 5`-TGGAAATTTAGAGGATGAGGGAATTTTA-3`, Reverse primer, 5`- biotinACCCTCTTTCTCTCACCTTTAC-3`; Sequencing primer, 5`-AGGGAATTTTATTAGTTTTTATTTA-3`; NMU32: Forward primer, 5`-GGTTTATTTTATTAGGGAGTGTTAGATAG-3`, Reverse primer, 5`-biotinAACCCTCTAAACCAAATATAAAATATAATC-3`, Sequencing primer, 5`-GTAGGGAGAGGTATTGTTT-3`). After discarding CpG values that did not pass our quality control check as described in the method section, 10 and 7 CpG sites, belonging to NMU76 and NMU32, respectively, were included in further analysis. To exclude possible intra-plate differences, a sample of HUVECs was carried on in each plate as an internal control. Bisulphite treatment was conducted on 1 μg of genomic DNA using the EZ-96 DNA methylation kit (ZYMO RESEARCH) according to the manufacturer’s instructions, except for the incubation protocol during the conversion, performed for 16 hours as described [Citation28]. All PCR amplifications were performed in duplicate. The 2 assays were tested using fully methylated and unmethylated controls (EpiTect PCR Control DNA Set, QIAGEN).
Figure 1. Genomic location of the NMU regions used for the methylation study
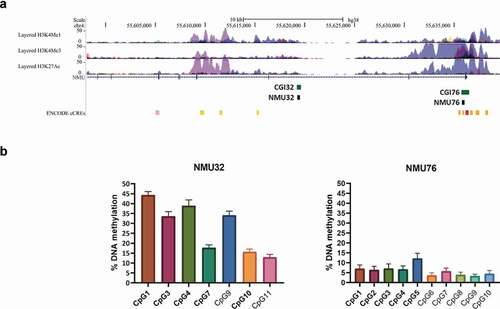
For the CpG-specific analysis, data were discarded when the duplicate measurements had a standard deviation (SD) ≥ 5% for the NMU76 (sample range of methylation levels 4–12%) and a SD ≥ 10% for the NMU32 (sample range 15–45%).
Statistical analysis
All analyses were performed using SAS/STAT software (Version 9.4 for Windows©2009. SAS Institute Inc. and SAS are registered trademarks of SAS Institute Inc., Cary, NC, USA). Mean and SD were computed for continuous variables and frequencies for categorical variables. All continuous variables, including methylation data, were also transformed to z-scores (mean = 0; SD = 1). Because NMU CpG sites methylation showed significant inter-correlations (Table S2) within each region, we used principal component analysis (PCA) on the correlation matrix of the NMU CpG sites to identify common underlying factors (patterns) that explain the largest variation in NMU methylation [Citation29,Citation30]. Only the subjects having all the CpG sites successfully measured for each CpG island were included in the analysis: 1022 for NMU76 and 1016 subjects for NMU32, respectively. Criteria for factor selection were eigenvalue > 0.7 as revealed by the scree test and the interpretability of the final solution. The finally selected factors were transformed by the orthogonal varimax rotation to keep independent latent variables for subsequent analysis, and then standardized. Each subject received a factor score, calculated by summing the observed methylation site values, each weighted by factor loadings [Citation31].
We first analysed the associations between the identified patterns and lifestyles, to identify potential confounders for the subsequent analyses. Then, we studied the association between NMU methylation factors and metabolic features in linear and logistic regression models. We included anthropometric variables (BMI, waist, waist-to-hip ratio), hypertension (systolic and diastolic blood pressure), glucose (blood glucose, insulin levels and HOMA-IR) and lipid indices (total-, LDL- and HDL-cholesterol, lipoprotein(a), apolipoprotein A and B), and the related categorical variables (overweight or obesity, hypertension, diabetes and hypercholesterolemia). Similarly, linear regression models were used to assess the association between NMU DNA methylation patterns and inflammatory parameters, represented by INFLA-score and its components hs-CRP, WBC, PLT and GLR, as well as the WBC subpopulations. Age, sex, smoking (current- vs previous- vs ever-smokers), and lifestyles associated with any methylation factor and with any outcome at p < 0.05 were used as covariates. A Benjamini-Hochberg false discovery rate (FDR) method was used to adjust p values for multiple testing considering all analyses performed for each methylation region. A FDR p value (pFDR) <0.05 was considered statistically significant. Using the same models, a mediation analysis was conducted to analyse the proportion of the associations between factors (predictor) and metabolic parameters (dependent variable) explained by the effect of inflammatory variables (mediator). The direct (independent of mediator) and indirect (mediated) effects of predictor on dependent variable were evaluated assessing changes in the regression coefficient with and without including the mediator in the model. The Sobel test was used to assess whether the indirect effect through the mediator on the relationship was significantly different from zero [Citation32]. The analysis was conducted considering only predictor, mediator and dependent variables showing statistically significant associations among them in previous analyses.
Prediction of NMU DNA binding factors
To detect potential regulatory effects of methylation at the CpG sites investigated, we searched for putative binding sites by using the PROMO software [Citation33]. The full CpG island regions analysed in the methylation study were used as DNA sequence bait in the search. The prediction was made by focusing only on the human species and transcription factors, setting the minimum sequence similarity threshold for transcription factor binding detection to 85%.
Results
NMU DNA methylation factor identification
Characteristics of the Moli-sani sub-cohort included in this analysis are reported in . NMU76 had a mean and SD methylation range across its CpG sites of 6.03 ± 2.58 while NMU32 showed on average higher methylation levels compared to NMU76 of 28.16 ± 12.48. Population mean and SD for each of the NMU CpG sites studied (10 in the NMU76 and 7 in the NMU32) are reported in and Table S3. PCA identified two main methylation factors for both NMU76 and NMU32: NMU76-F1, NMU76-F2, NMU32-F1 and NMU32-F2. Factor loadings of individual CpG sites obtained after varimax rotation are reported in Table S4. NMU76-F1, that explains 83.0% of NMU76 variance, is characterized by high positive loadings of CpGs 1–5 ( and Table S4) while NMU32-F1, explaining 81.2% of methylation variance at NMU32, is mainly characterized by positive loadings of CpGs 1,3,4,7 and 10 ( and Table S4).
Table 1. Association between CpG factors and potential confounders
NMU DNA methylation and metabolic indices
We first analysed the potential confounders testing the associations between lifestyle variables and methylation factors (). Beyond age and sex, we found smoking habit, vegetables and alcohol consumption to be associated with methylation factors. These variables were included in the subsequent models as covariates.
We analysed the associations between metabolic indices and methylation patterns (N = 1022, ) or single sites (N = 1160, Table S3). We found that NMU76-F1 was significantly associated with total cholesterol (β = 4.5 ± 1.4 mg/dl for increase of 1 SD of Factor1, pFDR = 0.024) and ApoB (0.03 ± 0.01 g/L, pFDR = 0.021). Nominally significant (positive) associations were also observed for NMU76-F1 with LDL-cholesterol and triglycerides, which, however, did not survive FDR correction (). Considering single CpG sites, NMU76 CpG 4 resulted associated with ApoB levels (0.03 ± 0.01 g/L, p = 2E-5; pFDR = 0.004) after appropriate FDR adjustment (Table S3); a stepwise multivariate analysis including all NMU76 sites (backward elimination for sites with p > 0.05) confirmed the association between ApoB and CpG 4 (0.04 ± 0.01 g/L, p = 0.0002) and showed a nominally significant association for CpG 9 (−0.02 ± 0.01 g/L, p = 0.026). As for total cholesterol, NMU76 CpG 3, 4 and 5 resulted associated, although with only nominal statistical significance (Table S3). As for NMU32, we found nominally significant, positive associations of NMU32-F1 with ApoB levels and MetS, and of NMU32-F2 with diabetes mellitus and hypercholesterolemia; however, they were no more significant after FDR correction (). Similarly, we did not find FDR-significant associations considering single NMU32 CpG sites (Table S3).
Table 2. Association between metabolic phenotypes and CpG factors
NMU DNA methylation and inflammation
Since inflammation is tightly linked to the development of metabolic features, we investigated the associations between NMU methylation and low-grade inflammation markers (). NMU76-F1 methylation was significantly associated with INFLAscore (−1.05 ± 0.22, p = 2.7E-6) and, among the four components of the INFLA-score, with GLR (−0.27 ± 0.03, p = 1.3E-20). Moreover, we identified an inverse relationship between NMU76-F1 and granulocyte numbers (−0.19 ± 0.04 109cells/L) and a positive one with lymphocyte numbers (0.18 ± 0.02 109cells/L), which remained significant after FDR correction (pFDR<0.0001; ). Considering single CpG site analysis, several sites – especially those loading on NMU76-F1 – were FDR-significantly associated with INFLA-score, GLR and lymphocyte number (Table S5); a multivariate analysis including all NMU76 sites confirmed this result, while did not reveal strong leading effects from specific CpG sites (data not shown). As for NMU32 region, no associations were found between its methylation patterns and inflammation related parameters. As for NMU32 region, no significant association was found between its methylation patterns and inflammation related parameters.
Table 3. Association between CpG factors and inflammatory indices
Transcription factor analysis using PROMO/TRANSFAC
We studied the prediction of transcription factor binding sites of the genomic regions encompassing the most significantly associated (surviving FDR correction) CpG sites with either the metabolic or the inflammation-related markers namely: CpG 2, CpG 3, CpG 4, CpG7 and CpG8, all belonging to NMU76. NMU76 CpG 4 co-localizes with a putative binding site for EBF (), while
Figure 2. PROMO/TRANSFAC transcription factor prediction analysis of NMU76 (chr4:55,635,809–55,635,902, GRCh38/hg38 assembly)
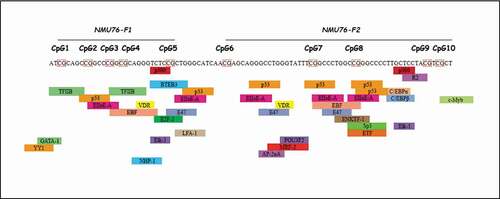
CpG 2, CpG 3, CpG 7 and CpG 8 all contain binding sites for p53 and EIIaE-A (adenovirus E2a-inducible early promoter – element A) transcription factors ().
Mediation analysis
Since NMU76-F1 was associated with both lipid-related variables and inflammation markers, we investigated a potential link among all these variables. GLR was inversely associated with both total cholesterol (−5.4 ± 1.4 mg/dl, p = 0.00014) and ApoB (−0.04 ± 0.01 g/L, p = 2.3E-6) levels, and lymphocyte numbers with higher ApoB levels (0.02 ± 0.01 g/L, p = 5.0E-5; Table S5). We thus tested the associations of both metabolic and inflammatory variables with NMU76 methylation in the same model, to estimate the extent of the overlaps between the effects of the above mentioned variables. As shown in Supplementary Figure 1, NMU76-F1 explained 10.9% of cholesterol and 12.3% of ApoB variance, independently on inflammation. When inflammatory variables were added to the model, these effects were reduced up to 8.3% (for cholesterol, adjusted for GLR) and 7.1% (for ApoB, adjusting for lymphocyte count), respectively. These reductions were statistically significant (for GLR on cholesterol, 24.0% of total effect, Sobel p = 0.013; for lymphocyte count on ApoB, 42.6%, p = 9E-7). Conversely, considering the association with inflammatory variables, NMU76-F1 explained 30.4% of GLR and 25.6% of lymphocyte count, independently on metabolic parameters. In this case, the effect of metabolic parameters was limited (cholesterol on GLR, 0.9% of total effect, p = 0.04; ApoB on lymphocyte number, 2.4%, p = 0.001).
Discussion
We herein report the DNA methylation levels of two NMU CpG islands measured in blood samples belonging to a general population of Italian adults. Our study shows for the first time that NMU promoter DNA methylation is associated with increased lipid indices (levels of total cholesterol and of lipoprotein containing ApoB) and low-grade inflammation markers (mainly decreased GLR, with reduced granulocyte and increased lymphocyte number). Moreover, we found a significant overlap between these associations, suggesting potential common regulatory mechanisms for these two pathways influenced by NMU.
NMU is a neuropeptide with several functions involved in gut-brain axis, energy balance and immune response as reported in a large number of studies conducted in mouse models [Citation3]. In humans, mainly in children, a possible link of NMU with overweight and obesity [Citation9,Citation10], food preferences [Citation11] and bone health [Citation12], all phenotypes related with metabolic parameters, has been reported.
We found a significant link between NMU DNA methylation variability and total cholesterol and ApoB levels, but not with HDL-cholesterol or ApoAI and Lp(a). Our results suggest an effect on pathways linked to the turn-over regulation of ApoB-containing lipoproteins, such as chylomicrons, VLDL and LDL, whose alteration has been consistently associated with cardiovascular risk [Citation34]. These data support the rationale for NMU pathway to be a potential treatment target for dyslipidemia. A growing interest for NMU investigation in relation to human health has recently inspired research towards the development of NMU analogues for the treatment of metabolic disturbances [Citation35–37].
We also found a robust negative association with INFLA-score, a marker of circulating low-grade inflammation, both for the main NMU76 methylation factor and for several individual CpG sites of the same promoter region. The association was mainly and negatively driven by GLR and, in particular, by a decreasing effect on granulocyte number and an increasing effect on lymphocyte number, with no net effect on total WBC numbers. This could suggest a role for NMU in influencing haematopoiesis. The latter is strongly supported by previous studies on myeloid [Citation38] and erythroid [Citation39] lineages indicating NMU as an autocrine growth factor regulated by c-myb. A role in the activation and consumption as well as in the proliferation of selected WBC subpopulations, following an inflammatory stimulus, cannot be excluded. In numerous studies using animal models, NMU has been involved in inflammatory processes at different levels, especially through its binding with NMUR1 on different types of white blood cells. Indeed, NMU was implicated in stimulation of cytokine production by T cells, mast cell-mediated inflammation [Citation40], eosinophil infiltration into inflammatory sites by directly activating eosinophils [Citation5], LPS-induced IL-6 expression in macrophages [Citation41], IL-5 expression in lung lymphocytes co-stimulated with CGRP IL-33 [Citation42], and anti-microbial and inflammatory type 2 responses at mucosal sites [Citation7]. Data from the BLUEPRINT consortium (https://blueprint.haem.cam.ac.uk/bloodatlas/) showed that NMU and NMUR1 are differentially expressed in several inflammatory human cells. In particular, NMU is highly expressed in HUVECs, whereas WBCs mostly express NMUR1.
We observed that part of the effect of the main NMU promoter methylation pattern on GLR and lipid indices was shared between these two pathways. The causal direction of these associations (NMU methylation affecting inflammation or lipids or the latter affecting NMU methylation) cannot be determined in our cross-sectional study. However, beside the known regulatory role of epigenetics in influencing both the onset of metabolic-related diseases [Citation43] and of inflammatory states, in particular low-grade inflammation [Citation44–46], other longitudinal studies are available on this topic. Some of them showed a longitudinal association between DNA methylation age measure [Citation47] and biomarkers of inflammation or BMI and adoposity [Citation48], suggesting that methylation could be the first exposure. Other studies, on the contrary, demonstrated that DNA methylation is the effect of certain metabolic conditions, including adiposity, over time [Citation48–52]. From this perspective, NMU methylation could regulate (or simply mark an unknown pathway regulating) both blood cell numbers and lipids, or it could be the result of the cumulative effect of certain metabolic and inflammatory patterns over time. As for the first hypothesis, previous studies showed a link between leukocyte colony stimulating factors, able to change granulocyte-to-lymphocyte ratio, and both reduced expression of VLDL receptors and increased hepatic cholesterol biosynthesis [Citation53]. As for the second hypothesis, lifestyles associated with metabolic disturbances could also change methylation levels [Citation54]. In our analyses, however, we tested several lifestyle variables as potential covariates, finding significant associations with age, sex and smoking, while dietary variables as alcohol and vegetables intake were associated at lower statistical significance.
The most associated methylation factor with the analysed parameters tagged NMU76 where 1. the putative NMU promoter is located and where 2. we identified a region rich in potential binding sites for transcription factors. DNA methylation dependent gene expression can be regulated by both these mechanisms [Citation55]. Putative search for specific transcription factor binding sites in the NMU76 identified binding sites for EBF (lipids associated CpG4, ), p53 and EIIaE-A (GLR and low-grade inflammation associated CpGs 2, 3, 7 and 8, ). Interestingly, EBF is a known transcription factor regulating adipogenesis [Citation56]; p53 controls cell-cycle arrest, an important step for the finalization of myelopoiesis [Citation57,Citation58] and EIIaE-A has been described to be important in haematopoiesis [Citation59,Citation60].
Major strengths of this study are the relatively large sample size and the methodology applied to investigate NMU methylation associations with the metabolic and inflammatory phenotypes studied. This approach, recently validated for other two genes by our group in a smaller population [Citation29,Citation30], allowed us to reduce the number of tests to carry out and the statistical burden of correction for multiple testing, identifying few factors characterized by close CpG sites in specific NMU genomic regions. Moreover, the main factors identified in both regions explained a large part of gene methylation variance, suggesting that these factors properly mark the methylation variability of the regions they belong to.
This study also has some limitations. First, the cross-sectional design of the study has different implications. The mediation analysis lies on the hypothesis that DNA methylation is the causal factor, that occurred before metabolic and inflammatory changes and that inflammation mediates the relationship between methylation and lipids. Indeed, while inflammation explains a large portion of the association between methylation levels and lipid- related variables, these latters only marginally affect the association between methylation and inflammation. A further limitation is the availability of a single cohort, without replication. However, the latter limitation is overcome by the availability of methylation measurements for multiple CpG sites in the same gene and in a large general population, by the very high level of statistical significance reached in several analyses and by the large portion of variance explained in clinically useful parameters (11% of cholesterol content and 26% of lymphocyte number variability). Caution is necessary in extending these results to larger population contexts, since data were collected in a single Italian region. However, the main characteristics of our population sample are comparable to those of the Italian Cardiovascular Epidemiology Observatory [Citation61]. For this reason, our sample could be considered representative of at least the Italian population.
Our study opens up to future investigations to understand the epigenetic regulation of NMU in different tissues and cell types. This will help to clarify how methylation changes are responsible for altered NMU expression levels in health and disease. Overall, the findings reported here – linking NMU methylation patterns with both lipid- and inflammation-related markers - identify NMU, and more specifically the ApoB associated CpG 4, as a potential novel biomarker of circulating inflammation, lipid homoeostasis and cardiovascular risk assessment.
Data availability statement
The data that support the findings of this study are available from the corrisponding author, L.I., upon reasonable request. Mail to: [email protected]
Authors’ contributions
AM, BI and FG designed the study and wrote the manuscript. AM performed the methylation experiments; FG performed statistical analyses; BI designed and supervised the methylation experiments; FN designed and performed the methylation experiments; RP and AT performed the sample DNA extraction; AG and AdC provided statistical support; SC managed the databases and provided statistical support; CC, MBD, GdG and LI were at the origin of the conception of the Moli-sani cohort and participated in the design of the study; all authors critically reviewed and approved the manuscript.
Supplemental Material
Download MS Excel (373.6 KB)Disclosure statement
No potential conflict of interest was reported by the authors
Supplementary material
Supplemental data for this article can be accessed here.
Additional information
Funding
Related Research Data
References
- Kassi E, Pervanidou P, Kaltsas G, et al. Metabolic syndrome: definitions and controversies. BMC Med. 2011;9:48.
- Hotamisligil GS. Inflammation and metabolic disorders. Nature. 2006;444:860–867.
- Martinez VG, O’Driscoll L. Neuromedin U: a multifunctional neuropeptide with pleiotropic roles. Clin Chem. 2015;61:471–482.
- Gajjar S, Patel BM. Neuromedin: an insight into its types, receptors and therapeutic opportunities. Pharmacol Rep. 2017;69:438–447.
- Moriyama M, Fukuyama S, Inoue H, et al. The neuropeptide neuromedin U activates eosinophils and is involved in allergen-induced eosinophilia. Am J Physiol Lung Cell Mol Physiol. 2006;290:L971–977.
- Hedrick JA, Morse K, Shan L, et al. Identification of a human gastrointestinal tract and immune system receptor for the peptide neuromedin U. Mol Pharmacol. 2000;58:870–875.
- Klose CSN, Mahlakoiv T, Moeller JB, et al. The neuropeptide neuromedin U stimulates innate lymphoid cells and type 2 inflammation. Nature. 2017;549:282–286.
- Grippi C, Izzi B, Gianfagna F, et al. Neuromedin U potentiates ADP- and epinephrine-induced human platelet activation. Thromb Res. 2017;159:100–108.
- Hainerova I, Torekov SS, Ek J, et al. Association between neuromedin U gene variants and overweight and obesity. J Clin Endocrinol Metab. 2006;91:5057–5063.
- Gianfagna F, Grippi C, Ahrens W, et al. The role of neuromedin U in adiposity regulation. Haplotype analysis in European children from the IDEFICS Cohort. PLoS One. 2017;12:e0172698.
- Grippi C, Ahrens W, Buchecker K, et al. Association between variants of neuromedin U gene and taste thresholds and food preferences in European children: results from the IDEFICS study. Appetite. 2019;142:104376.
- Gianfagna F, Cugino D, Ahrens W, et al. Understanding the links among neuromedin U gene, beta2-adrenoceptor gene and bone health: an observational study in European children. PLoS One. 2013;8(8):e70632. .
- Carson C, Lawson HA. Epigenetics of metabolic syndrome. Physiol Genomics. 2018;50:947–955.
- Tobi EW, Lumey LH, Talens RP, et al. DNA methylation differences after exposure to prenatal famine are common and timing- and sex-specific. Hum Mol Genet. 2009;18:4046–4053.
- Arpon A, Milagro FI, Ramos-Lopez O, et al. Methylome-wide association study in peripheral white blood cells focusing on central obesity and inflammation. Genes (Basel). 2019;10(6):444. .
- Di Castelnuovo A, de Curtis A, Costanzo S, et al. Association of D-dimer levels with all-cause mortality in a healthy adult population: findings from the MOLI-SANI study. Haematologica. 2013;98:1476–1480.
- Di Castelnuovo A, Costanzo S, Persichillo M, et al. Distribution of short and lifetime risks for cardiovascular disease in Italians. Eur J Prev Cardiol. 2012;19:723–730.
- Pisani P, Faggiano F, Krogh V, et al. Relative validity and reproducibility of a food frequency dietary questionnaire for use in the Italian EPIC centres. Int J Epidemiol. 1997;26(Suppl 1):S152–160.
- Trichopoulou A, Costacou T, Bamia C, et al. Adherence to a mediterranean diet and survival in a Greek population. N Engl J Med. 2003;348:2599–2608.
- Bener A, Zirie M, Musallam M, et al. Prevalence of metabolic syndrome according to adult treatment panel III and international diabetes federation criteria: a population-based study. Metab Syndr Relat Disord. 2009;7:221–229.
- National Institutes of Health. Clinical guidelines on the identification, evaluation, and treatment of overweight and obesity in adults–The evidence report. Obes Res. 1998;6(Suppl 2):51S–209S.
- Zeller T, Hughes M, Tuovinen T, et al. BiomarCaRE: rationale and design of the European BiomarCaRE project including 300,000 participants from 13 European countries. Eur J Epidemiol. 2014;29:777–790.
- Matthews DR, Hosker JP, Rudenski AS, et al. Homeostasis model assessment: insulin resistance and beta-cell function from fasting plasma glucose and insulin concentrations in man. Diabetologia. 1985;28:412–419.
- Pounis G, Bonaccio M, Di Castelnuovo A, et al. Polyphenol intake is associated with low-grade inflammation, using a novel data analysis from the Moli-sani study. Thromb Haemost. 2016;2115:344–352.
- Gialluisi A, Bonaccio M, Di Castelnuovo A, et al. Lifestyle and biological factors influence the relationship between mental health and low-grade inflammation. Brain Behav Immun. 2020;85:4–13.
- Bonaccio M, Di Castelnuovo A, Pounis G, et al. A score of low-grade inflammation and risk of mortality: prospective findings from the Moli-sani study. Haematologica. 2016;101:1434–1441.
- Malferrari G, Monferini E, DeBlasio P, et al. High-quality genomic DNA from human whole blood and mononuclear cells. Biotechniques. 2002;33:1228–1230.
- Izzi B, Binder AM, Michels KB. Pyrosequencing evaluation of widely available bisulfite conversion methods: considerations for application. Med Epigenet. 2014;2:28–36.
- Noro F, Gianfagna F, Gialluisi A, et al. ZBTB12 DNA methylation is associated with coagulation- and inflammation-related blood cell parameters: findings from the Moli-family cohort. Clin Epigenetics. 2019;11(1):74. .
- Izzi B, Gianfagna F, Yang WY, et al. Variation of PEAR1 DNA methylation influences platelet and leukocyte function. Clin Epigenetics. 2019;11:151.
- Kim JOMC. Factor analysis: statistical method and practical issues. Thousand Oaks, CA: Sage Publications; 1978.
- Preacher KJ, Hayes AF. SPSS and SAS procedures for estimating indirect effects in simple mediation models. Behav Res Methods Instrum Comput. 2004;36:717–731.
- Messeguer X, Escudero R, Farre D, et al. PROMO: detection of known transcription regulatory elements using species-tailored searches. Bioinformatics. 2002;18:333–334.
- Sniderman AD, Thanassoulis G, Glavinovic T, et al. Apolipoprotein B particles and cardiovascular disease: a narrative review. JAMA Cardiol. 2019;4:1287–1295.
- Ingallinella P, Peier AM, Pocai A, et al. PEGylation of neuromedin U yields a promising candidate for the treatment of obesity and diabetes. Bioorg Med Chem. 2012;20:4751–4759.
- Ma ML, Li M, Gou JJ, et al. Design, synthesis and biological activity of flavonoid derivatives as selective agonists for neuromedin U 2 receptor. Bioorg Med Chem. 2014;22(21):6117–6123.
- De Prins A, Van Eeckhaut A, Smolders I, et al. Neuromedin U and structural analogs: an overview of their structure, function and selectivity. Curr Med Chem. 2020;27(39):6744-6768.
- Shetzline SE, Rallapalli R, Dowd KJ, et al. Neuromedin U: a Myb-regulated autocrine growth factor for human myeloid leukemias. Blood. 2004;104:1833–1840.
- Gambone JE, Dusaban SS, Loperena R, et al. The c-Myb target gene neuromedin U functions as a novel cofactor during the early stages of erythropoiesis. Blood. 2011;117:5733–5743.
- Moriyama M, Sato T, Inoue H, et al. The neuropeptide neuromedin U promotes inflammation by direct activation of mast cells. J Exp Med. 2005;202:217–224.
- Moriyama M, Matsukawa A, Kudoh S, et al. The neuropeptide neuromedin U promotes IL-6 production from macrophages and endotoxin shock. Biochem Biophys Res Commun. 2006;341:1149–1154.
- Nagashima H, Mahlakoiv T, Shih HY, et al. Neuropeptide CGRP limits Group 2 innate lymphoid cell responses and constrains type 2 inflammation. Immunity. 2019;51:682–695 e686.
- Stols-Goncalves D, Tristao LS, Henneman P, et al. Epigenetic markers and microbiota/metabolite-induced epigenetic modifications in the pathogenesis of obesity, metabolic syndrome, Type 2 diabetes, and non-alcoholic fatty liver disease. Curr Diab Rep. 2019;19:31.
- Ligthart S, Marzi C, Aslibekyan S, et al. DNA methylation signatures of chronic low-grade inflammation are associated with complex diseases. Genome Biol. 2016;17:255.
- Marzi C, Holdt LM, Fiorito G, et al. Epigenetic signatures at AQP3 and SOCS3 engage in low-grade inflammation across different tissues. PLoS One. 2016;11:e0166015.
- Izzi B, Noro F, Cludts K, et al. Cell-specific PEAR1 methylation studies reveal a locus that coordinates expression of multiple genes. Int J Mol Sci. 2018;19(4):1069.
- Morrison FG, Logue MW, Guetta R, et al. Investigation of bidirectional longitudinal associations between advanced epigenetic age and peripheral biomarkers of inflammation and metabolic syndrome. Aging (Albany NY). 2019;11:3487–3504.
- Wahl S, Drong A, Lehne B, et al. Epigenome-wide association study of body mass index, and the adverse outcomes of adiposity. Nature. 2017;541:81–86.
- Dick KJ, Nelson CP, Tsaprouni L, et al. DNA methylation and body-mass index: a genome-wide analysis. Lancet. 2014;383:1990–1998.
- Feinberg AP, Irizarry RA, Fradin D, et al. Personalized epigenomic signatures that are stable over time and covary with body mass index. Sci Transl Med. 2010;2:49ra67.
- Xu X, Su S, Barnes VA, et al. A genome-wide methylation study on obesity: differential variability and differential methylation. Epigenetics. 2013;8:522–533.
- Demerath EW, Guan W, Grove ML, et al. Epigenome-wide association study (EWAS) of BMI, BMI change and waist circumference in African American adults identifies multiple replicated loci. Hum Mol Genet. 2015;24:4464–4479.
- Singhal A, Subramanian M. Colony stimulating factors (CSFs): complex roles in atherosclerosis. Cytokine. 2019;122:154190.
- Quach A, Levine ME, Tanaka T, et al. Epigenetic clock analysis of diet, exercise, education, and lifestyle factors. Aging (Albany NY). 2017;9:419–446.
- Moore LD, Le T, Fan G. DNA methylation and its basic function. Neuropsychopharmacology. 2013;38:23–38.
- Jimenez MA, Akerblad P, Sigvardsson M, et al. Critical role for Ebf1 and Ebf2 in the adipogenic transcriptional cascade. Mol Cell Biol. 2007;27:743–757. .
- Friedman AD. Transcriptional regulation of granulocyte and monocyte development. Oncogene. 2002;21:3377–3390.
- Friedman AD. Transcriptional regulation of myelopoiesis. Int J Hematol. 2002;75:466–472.
- Jalinot P, Devaux B, Kedinger C. The abundance and in vitro DNA binding of three cellular proteins interacting with the adenovirus EIIa early promoter are not modified by the EIa gene products. Mol Cell Biol. 1987;7:3806–3817.
- Ginsberg D, Vairo G, Chittenden T, et al. E2F-4, a new member of the E2F transcription factor family, interacts with p107. Genes Dev. 1994;8:2665–2679.
- Laurendi G, Donfrancesco C, Palmieri L, et al. Association of lifestyle and cardiovascular risk factors with lung function in a sample of the adult Italian population: a cross-sectional survey. Respiration. 2015;89:33–40.
Appendix
Moli-sani Study Investigators
The enrolment phase of the Moli-sani Study was conducted at the Research Laboratories of the Catholic University in Campobasso (Italy), the follow up of the Moli-sani cohort is being conducted at the Department of Epidemiology and Prevention of the IRCCS Neuromed, Pozzilli, Italy.
Steering Committee: Licia Iacoviello*°(Chairperson), Giovanni de Gaetano* and Maria Benedetta Donati*.
Scientific secretariat: Marialaura Bonaccio*, Americo Bonanni*, Chiara Cerletti*, Simona Costanzo*, Amalia De Curtis*, Augusto Di Castelnuovo§, Francesco Gianfagna°§, Mariarosaria Persichillo*, Teresa Di Prospero* (Secretary).
Safety and Ethical Committee: Jos Vermylen (Catholic Univesity, Leuven, Belgio) (Chairperson), Ignacio De Paula Carrasco (Accademia Pontificia Pro Vita, Roma, Italy), Antonio Spagnuolo (Catholic University, Roma, Italy).
External Event adjudicating Committee: Deodato Assanelli (Brescia, Italy), Vincenzo Centritto (Campobasso, Italy).
Baseline and Follow-up data management: Simona Costanzo* (Coordinator), Marco Olivieri (Associazione Cuore Sano, Campobasso, Italy), Teresa Panzera*.
Data Analysis: Augusto Di Castelnuovo§ (Coordinator), Marialaura Bonaccio*, Simona Costanzo*, Simona Esposito*, Alessandro Gialluisi*, Francesco Gianfagna°§, Emilia Ruggiero*.
Biobank and biochemical laboratory: Amalia De Curtis* (Coordinator), Sara Magnacca§.
Genetic laboratory: Benedetta Izzi* (Coordinator), Annalisa Marotta*, Fabrizia Noro*, Roberta Parisi*, Alfonsina Tirozzi*.
Recruitment staff: Mariarosaria Persichillo* (Coordinator), Francesca Bracone*, Francesca De Lucia (Associazione Cuore Sano, Campobasso, Italy), Cristiana Mignogna*, Teresa Panzera*, Livia Rago*.
Communication and Press Office: Americo Bonanni*.
Regional Health Institutions: Direzione Generale per la Salute – Regione Molise; Azienda Sanitaria Regionale del Molise (ASReM, Italy); Molise Dati Spa (Campobasso, Italy); Offices of vital statistics of the Molise region.
Hospitals: Presidi Ospedalieri ASReM: Ospedale A. Cardarelli – Campobasso, Ospedale F. Veneziale – Isernia, Ospedale San Timoteo – Termoli (CB), Ospedale Ss. Rosario – Venafro (IS), Ospedale Vietri – Larino (CB), Ospedale San Francesco Caracciolo – Agnone (IS); Casa di Cura Villa Maria – Campobasso; Ospedale Gemelli Molise – Campobasso; IRCCS Neuromed – Pozzilli (IS).
*Department of Epidemiology and Prevention, IRCCS Neuromed, Pozzilli, Italy
°Department of Medicine and Surgery, University of Insubria, Varese, Italy
§Mediterranea Cardiocentro, Napoli, Italy
Baseline Recruitment staff is available at https://www.moli-sani.org/?page_id=173