
ABSTRACT
Differentially methylated regions (DMR) are genomic regions with different methylation status. The aim of this research was to identify DMRs in subjects with obesity that predict the response to a weight-loss dietary intervention and its association with metabolic variables. Based on the change in body mass index (BMI), 201 subjects with overweight and obesity were categorized in tertiles according to their response to a hypocaloric diet: Responders (R; n = 64) and Non-Responders (NR; n = 63). The R group lost 4.55 ± 0.91 BMI units (kg/m2) and the NR group lost 1.95 ± 0.73 kg/m2 (p < 0.001). DNA methylation was analysed in buffy coat through a methylation array at baseline. DMRs were analysed using a function of ChAMP (Chip Analysis Methylation Pipeline) in R software. Baseline DNA methylation analysis between R and NR exhibited a DMR located at paraoxonase 3 gene (PON3) consisting of 13 CpG sites, eleven of them significantly hypermethylated in R. To analyse the implication of these 11 CpGs on weight loss, a z-score was performed as a measure of DMR methylation. This analysis showed a correlation between PON3 DNA methylation and BMI loss. This z-score negatively correlated with PON3 protein serum levels. Total paraoxonase activity in serum was not different between groups, but PON enzymatic activity positively correlated with oxidized LDL levels. The present study identified a DMR within PON3 gene that is related to PON3 protein levels in serum, and that could be used as a potential biomarker to predict the response to weight-loss dietary interventions.
Introduction
The increasing incidence of obesity in the recent years suggests that treatments and prevention of obesity have mostly been ineffective, and there is a concern about the high rates of obesity and the resulting healthcare costs [Citation1]. For this reason, new strategies have emerged to prevent obesity and personalize the treatment. Body mass index (BMI) is a complex phenotype determined by lifestyle, environmental and genetic factors [Citation2,Citation3]. Recent evidence indicates that changes in gene expression are regulated not only by genetic polymorphisms but also by a variety of mechanisms including epigenetic modifications [Citation4–6].
Epigenetics represents a cross-talk between the genome and the environment, and epigenetic changes are typically reversible and refer to chemical modifications to histones and DNA [Citation7]. The main epigenetic modifications are DNA methylation (DNAmet), histone modifications, chromatin remodelling, and non-coding RNAs [Citation8]. DNAmet status can be measured in easily accessible tissues, such as peripheral blood cells (PBCs), commonly used as a surrogate measure of methylation changes at less accessible target-sites, appearing as potential biomarkers [Citation9,Citation10]. DNAmet involves the reversible and heritable addition of a methyl group directly onto DNA residues, mainly cytosine but also adenine. The most common form of DNAmet occurs at the 5`carbon of cytosine in CpG dinucleotides, creating 5-methylcytosine [Citation11]. CpG dinucleotides are often located in CpG islands within the promoter region or first exon of the genes, mainly associated with gene silencing, and this regulation can be mediated by a single CpG or by a group of them closely located each other [Citation12]. Differentially Methylated Regions (DMRs) are extended segments of the genome that show a quantitative alteration in DNAmet between groups. The identification of DMRs among multiple tissues allows to describe regions involved in gene transcriptional regulation. Moreover, these continuous regions differ between phenotypes in a wide range of disorders, such as cancer, diabetes, obesity among others [Citation13,Citation14].
Factors such as nutrition, inflammation, oxidative stress, hypoxia, and sex can modulate DNAmet patterns [Citation15]. Interestingly, a number of studies have reported a direct evidence of epigenetic changes in the methylation status in several genes including obesity-associated genes, in association not only with BMI, adiposity, and obesity but also with weight-loss interventions [Citation16–18]. It has to be considered that changes in the methylation of these genes may be associated with the metabolic remodelling during weight loss. In this context, one of the major challenges associated with successful dietary weight management includes the identification of responsive individuals to a specific intervention. Several intervention studies have shown that, at baseline, gene expression profiling could be different between responders and non-responders subjects, and also the epigenetic profile has the potential to differentiate between good and poor responders to a caloric restriction intervention [Citation19]. Although several studies have suggested a few candidate genes as epigenetic biomarkers, the heterogeneity of the studies leads to a poor reproducibility between them [Citation20]. The use of DMRs exhibits consistently different DNAmet levels, which increases statistical power and reduces the effects of genetic variants [Citation21].
Considering that DNAmet has the potential to differentiate the response to a nutritional intervention, the main objective of this study was to identify DMRs in subjects with obesity that predict the response to a hypocaloric dietary intervention, and its association with metabolic variables.
Materials and methods
Study population
The sample included 305 subjects with overweight (BMI: 25.0–29.9) and type I or type II obesity (BMI: 30–40 kg/m2) who were randomly assigned to two hypocaloric diets with an energy restriction of 30% of kcal/day: a moderately high-protein diet (MHP) and a low-fat diet (LF) as described elsewhere [Citation22]. Obesity was classified following the World Health Organization guidelines according to BMI [Citation23]. All volunteers (the Obekit cohort) were enrolled from October 2015 to February 2016 in the Metabolic Unit of the Centre for Nutrition Research of the University of Navarra, Spain. Major exclusion criteria were type 1 diabetes mellitus, pregnant or breastfeeding women, cardiovascular disease, cancer, eating and cognitive disorders. This study followed the ethical principles for medical research in humans from the Declaration of Helsinki, 2013. Furthermore, the research protocol was approved by the Research Ethics Committee of the University of Navarra (ref. 132/2015) and registered at clinicaltrials.gov (reg. no. NCT02737267). A written informed consent of each participant was obtained prior to enrolment in the study.
Study design
The study lasted for 10 months, divided into two periods: intervention and maintenance, however, this study was focused on the weight-loss intervention period. The intervention period lasted 4 months and included four visits. In visit 1 – recruitment visit – questionnaires were fulfilled for screening and included a physical examination, medical history and a food frequency questionnaire. In visit 2 (baseline), anthropometric measurements and blood pressure were recorded. Also, blood, oral smears, urine, and faecal samples were collected. In visit 3 (follow-up), a 72-hour dietary recall, visual analogue scale (VAS) questionnaire, and anthropometric data were collected. In visit 4 (after intervention), the volunteers completed the aforementioned questionnaires, and anthropometric measurements and biological samples were collected.
A total of 305 participants were recruited at the beginning of the study. For the analysis, subjects had to complete visit 2 (baseline), visit 4 (after intervention) and have an adherence to the diet higher than 0.25 in a scale from 1 to 3, which was evaluated by a registered dietitian. Finally, a total of 232 subjects completed the intervention; however, 31 volunteers presented a poor adherence to the diet and were excluded from the analysis. Thereafter, a total of 201 volunteers were divided between Responders (R) and Non-Responders (NR) according to their response to the diet (change of BMI as the main variable). Subjects were split into tertiles, where the individuals within the tertile that lost more BMI were classified as R and the ones which presented lower BMI changes were classified as NR. After excluding the intermediate tertile from further analysis, 64 subjects were classified as R and 63 as NR.
Dietary intervention
The participants were randomly distributed to an MHP diet and an LF diet, using a specific algorithm in the MATLAB software (http://www.mathworks.com). Both strategies had a calorie restriction of 30% kcal/day in order to foster weight loss due to a negative energy balance. Diet 1 was an MHP diet with 40% of energy from carbohydrates, 30% from proteins, and 30% from fat. Diet 2 was an LF diet with 60% of total energy from carbohydrates, 22% from fat, and 18% from proteins [Citation22]. After the dietary intervention, both dietary groups (MHP and LF) were merged due to no differences were found in weight-loss response to each diet.
Clinical measurements
All volunteers underwent standardized procedures to measure body weight, height, waist, and hip circumference. Body composition was estimated by bioimpedance (Tanita SC-330, Tanita Corp, Japan) and by dual-energy X-ray absorptiometry (Lunar Prodigy, General Electric, MA, USA). Blood samples were extracted after 12 hours of fasting to obtain serum and plasma samples for biochemical determinations at baseline and after the intervention. Serum glucose, total cholesterol (TC), low-density lipoprotein cholesterol (LDL-C), high-density lipoprotein cholesterol (HDL-C) and triglycerides (TG), uric acid, and transaminases were evaluated using an automatic analyser (Pentra C200, HORIBA Medical). Insulin, leptin, adiponectin, C-reactive protein (CRP), and TNFα levels were quantified using commercial ELISA kits (Insulin and leptin Mercodia, Biovendor Human adiponectin ELISA, CRP and TNFα R&D systems). Insulin resistance was estimated by the homoeostatic model assessment‐insulin resistance (HOMA‐IR) index according to the following formula: fasting insulin (mU/L) × plasma glucose (mmol/L)/22.5. Serum levels of oxidized LDL (oxLDL) were measured by a competitive solid phase two-site ELISA (Mercodia AB, Uppsala, Sweden). Atherogenic index in plasma (AIP) was calculated using the base 10 logarithm of the ratio of the concentration of TG to HDL-cholesterol, where each concentration is expressed in mmol/L [Citation24].
PON concentration and activity
PON3 protein concentrations were determined in serum by a commercially available ELISA (MyBioSource, San Diego, CA). PON activity in serum was determined using the Arylesterase/Paraoxonase Assay Kit according to the manufacturer’s instructions (Zeptometrix Corporation, Buffalo, NY). In brief, arylesterase/paraoxonase catalyzes the cleavage of phenyl acetate resulting in phenol formation. The rate of formation of phenol is measured by monitoring the increase in absorbance at 270 nm at 25°C.
DNA methylation studies at baseline
DNA isolation and bisulphite conversion
Blood samples were collected at baseline and were centrifuged at 4°C for 15 minutes to obtain plasma and isolate the buffy coat fraction. DNA extraction was performed in buffy coat using MasterPure DNA purification Kit for blood version II (Epicentre Biotechnologies, WI, USA), quantified using a spectrophotometer (Nanodrop, Thermo Scientific, DE, USA) and stored at −80°C. In a second step, 500 ng of DNA were treated with sodium bisulphite using the EZ-96 DNA Methylation Kit (Zymo Research Corporation, CA, USA), to convert unmethylated cytosine residues into uracil, where methylated cytosines remain unaltered.
Microarray analysis
DNAmet levels were assessed using the Infinium MethylationEPIC BeadChip Kit (Illumina, CA, USA), which can interrogate over 850,000 methylation sites, according to the manufacturer’s instructions. Samples were scanned with an Illumina HiScanSQ system and the image intensities were extracted with the GenomeStudio Methylation Software v1.9 (Illumina, CA, USA) and were analysed as previously reported [Citation25]. Briefly, raw intensity data files were processed using the methylation Pipeline package for R software (version 1.11.0). Then, probes were filtered according to these criteria: p-values >0.01 in at least one sample, beadcounts <3 in minimum 5% of samples, presence of single nucleotide polymorphisms, alignment to multiple locations, or located on X and Y chromosomes. Subset-quantile Within Array Normalization method (SWAN) was used to improve the results obtained from the platform which reduces the technical variation within and between arrays and ComBat method was used to adjust for batch effects and eliminate technical variation [Citation26,Citation27]. Also, DNAmet was corrected by cell composition (granulocytes, monocytes, B cells, CD8+ cytotoxic cells, CD4+ helper T cells and natural killer cells) using the Houseman algorithm [Citation28]. In order to identify differentially methylated probes (DMP), limma package for the R statistical software was used to compute a linear regression (for quantitative outcome) or moderated F-statistic (for qualitative outcome). Moreover, the criteria for CpG selection were a raw p-value <0.05, deltaBeta ≥ |5%| and B ≥ 0. On the other hand, the analysis for differentially methylated regions (DMR), which are extended segments of the genome with differential methylation, was performed using a function of ChAMP (Chip Analysis Methylation Pipeline) in R software, to show a quantitative difference in DNA methylation levels between Responders and Non-Responders. DNAmet for each CpG site was represented by beta values ranging from 0 to 1, corresponding to fully unmethylated and fully methylated, respectively.
Statistical analyses
Quantitative and qualitative variables were expressed as means ± standard error of the mean (SEM). After pre-processing of the methylation data, linear regression adjusted for potential confounding factors (age, sex, study cohorts, and DNAmet chips) was carried out with the LIMMA package for R software (v. 3.3.2). A False Discovery Rate (FDR) cut-off of 0.05 and LIMMA B-statistics values above 0 in the outcome-related analyses were used as statistically significant thresholds. The LIMMA B-statistic is the log-odds of differential methylation, where B-values >0 imply that the CpG is more likely to be differentially methylated than not to be differentially methylated. This cut-off value (B > 0) gives a feasible balance between false positives and false negatives. FDR values (p < 0.0001) were used to select those CpGs whose methylation levels strongly correlated with BMI. The standard scores (z-score) were calculated as the sum of individual z-score for each CpG site (beta values) using this formula: z = x – μ/σ, where x (sample value), μ (sample mean), and σ (sample standard deviation). Linear regression results were expressed as raw regression (r) and r-squared (r2) coefficients. Data were considered significant at p-values <0.05. The p-value associated with DMRs was analysed with the Shapiro–Wilk test of normality. Pearson or Spearman correlations were performed in the whole group (R and NR; n = 127) according to its normality. Statistical analyses were performed using IBM SPSS software, version 20 (IBM Inc., Armonk, NY, USA) and plots were created using GraphPad Prism® software, version 6.0 C (La Jolla, CA, USA).
Results
Clinical characteristics before and after the intervention
Clinical data at baseline and after the intervention period are shown in . Participants were categorized into R and NR according to their BMI loss during the intervention period, where R group lost 4.55 ± 0.91 kg/m2 and NR group lost 1.95 ± 0.73 kg/m2 (p < 0.001). At baseline, none of the anthropometric and metabolic parameters was different between groups, except for HDL-C, which was lower in the NR group (p = 0.048). BMI loss in the R group was accompanied by a significant reduction in TC (32.3 ± 3.0 mg/dL; p < 0.001), LDL-C (20.9 ± 2.3 mg/dL; p < 0.001), triglycerides (28.9 ± 5.1 mg/dL; p < 0.001), ALT (4.18 ± 0.27 U/L; p < 0.001), and uric acid levels (0.34 ± 0.02 mg/dL; p < 0.001). Also, in the R group, this weight loss was associated with an increase in adiponectin levels (0.8 ± 0.1 ng/mL; p < 0.05) and a reduction in the AIP, a marker of cardiovascular risk ().
Table 1. Anthropometric and metabolic parameters before and after the intervention period in non-responders and responders
Epigenetic profiling at baseline
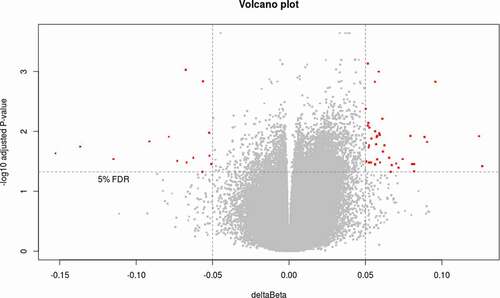
In order to analyse the DNAmet patterns between R and NR group, a methylation array was performed and a total of 749,018 CpG sites were analysed. To identify differentially methylated loci between groups, a first analysis was performed using a B-Limma >0 and deltaBeta ≥│5│% to select differentially methylated probes (DMP). In a second step, Benjamini–Hochberg procedure was applied to control the FDR with an adjusted p-value < 0.05, to reach statistical significance. A total of 63 CpG sites were identified between R and NR, where 45 CpG sites were hypermethylated and 18 CpG sites were hypomethylated (). These CpG sites were ascribed to 38 genes and genomic data as described in Supplementary Table 1.
Figure 1. Volcano plot showing the differential methylation probes (DMP) between responders and non-responders. Volcano plot for DMP with raw p-value < 0.05, deltaBeta ≥ |5|% and B-Limma ≥ 0. Effect size is displayed along X-axis, highlighting deltaBeta ≥ |5|%. On the Y-axis is displayed the negative logarithm of the association (adjusted p-value) for each CpG site. Points below the horizontal grey line are not statistically significant according to B-Limma and FDR 0.05. The red dots represent the 63 CpGs significant after filtering by B-Limma ≥ 0, and deltaBeta ≥ |5|% (adjustment 1).
Identification of differentially methylated regions
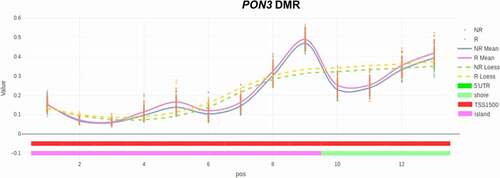
A DMR is an extended segment in the genome that shows a quantitative alteration in DNAmet between two groups. Using a function of ChAMP and FDR<0.05, a DMR was found between R and NR at PON3 gene with 13 CpG sites (TSS1500, chromosome 7) (). Due to the potential impact of PON3 gene on metabolic outcomes, we decided to carry out a more comprehensive analysis with this DMR. The beta values of each CpG showed a significant hypermethylation in 11 out of 13 sites in the R group respect to the NR group. Genomic data of the CpGs located at PON3 gene are described in .
Table 2. Genomic data of CpG sites in a DMR located at PON3 gene at baseline. Methylation levels (beta values) of CpG sites located at PON3 gene in non-responders and responders
Figure 2. Differentially methylated regions (DMRs) identification. Plot representing the comparison (between responders and non-responders) of the methylation levels of the individual CpGs included in the DMR identified in PON3 gene. Solid lines represent mean values and dashed lines represent the Loess line, where a hypermethylation is observed in the responders group (pink solid line). TSS1500: Transcription Start Site that covers 200 to 1500 nucleotides upstream of TSS.
PON3 methylation and weight loss
To analyse the implication of these 13 CpGs on weight loss, a z-score was performed as a measure of DMR methylation at baseline. We found a positive correlation between PON3 DMR methylation (z-score) at baseline with BMI loss (). In an attempt to validate the methylation patterns, PON3 protein levels were quantified in serum (Supplementary Figure 1). Even though PON3 protein levels were not different between groups, PON3 DMR methylation showed a negative correlation with PON3 serum levels (), which supports the idea that DNA hypermethylation is associated with gene repression.
Figure 3. BMI loss and DNA methylation. (a) Correlation between DNA methylation levels (z-score) in PON3 DMR and BMI loss and (b) correlation between DNA methylation levels (z-score) in PON3 DMR and PON3 protein levels in serum.
PON3 methylation and metabolic consequences
PON3 is a secreted protein associated with HDL that can inhibit the oxidation of LDL. We did not find a significant difference in oxLDL levels between R group and NR group at baseline (). In a second step, we decided to evaluate the arylesterase/paraoxonase activity as a measure of total PON activity in serum samples at baseline. We did not find differences in PON activity between R group and NR group (Supplementary Figure 2), but we found a positive correlation between PON activity and oxLDL levels (). On the other hand, we decided to evaluate the association between PON3 DMR methylation (z-score) and glucose metabolism. This analysis showed a negative correlation between PON3 DMR methylation with insulin and HOMA index at baseline ().
Figure 4. Oxidized LDL and paraoxonase activity. (a) Oxidized LDL levels (oxLDL) in Non-Responders and Responders at baseline. (b) Correlation between oxLDL levels and paraoxonase (PON) activity in serum. ns: non-significant.
Figure 5. Z-score and glucose metabolism. Relation between z-scores of PON3 DMR methylation and glucose metabolism parameters. Values reflect the significant change in z-scores from DMR methylation (11 CpG sites) according to insulin (a) or HOMA-IR at baseline (b).
Discussion
Obesity is mainly due to unhealthy lifestyle and nutrition and is the main modifiable risk factor implicated in impairing health status and reducing life expectancy [Citation29]. An imbalanced diet can lead to epigenetic reprogramming, which has been associated with increased obesity incidence [Citation20]. Other factors that have been suggested to induce epigenetic changes in humans are stress, physical exercise, disruption of the circadian rhythm, endocrine disruptors, gut microbiota dysbiosis, inflammation, and pollutants, among others [Citation18]. In this regard, epigenetic biomarkers offer novel opportunities to prevent and treat obesity [Citation30]. DNAmet plays a key role in epigenetic gene regulation and is the most well-studied epigenetic factor [Citation31].
The main objective of the present study was to identify DMRs in subjects with obesity at baseline and evaluate if this methylation pattern could predict the response to a hypocaloric dietary intervention. Our group previously reported that the response to weight-loss interventions could be predicted by analysing the methylation levels of several genes at baseline, but the study of DMRs is particularly relevant since they are more likely to affect the expression of genes than individual CpGs [Citation19].
In the present study, we found that subjects following an energy-restricted diet exhibited a variable response in terms of weight loss. For this study, subjects were categorized according to their response to diet, and the higher weight loss in the R group was associated with a reduction in many parameters related to metabolic syndrome. DNAmet analyses between both groups identified a DMR located at PON3 gene.
PON3 is a member of the paraoxonase family and lies in a cluster on chromosome 7 with the other two family members (PON1 and PON2) [Citation32]. PON3 was the last member of the PON family of proteins to be described and is the least characterized. The encoded protein is a 40-kDa glycoprotein mainly synthesized by the liver and at lower levels by the kidney [Citation33]. PON3 is found in circulation associated with HDL and can inhibit the oxidation of LDL, a function that is believed to slow the initiation and progression of atherosclerosis [Citation34]. PON3 is overexpressed in chronic liver disease, HIV-infection and coronary and peripheral artery disease [Citation35–37]. In animal models, paraoxonase-3 knockout mice fed with a high-fat diet exhibited a 37% increased body weight compared to the wild-type mice [Citation38]. Moreover, PON3 deficiency resulted in increased mitochondrial superoxide levels, increased hepatic expression of inflammatory genes and hepatotoxicity markers, which suggests a protective role for PON3 against obesity [Citation38].
As mentioned before, a more complete analysis was carried out with the PON3 DMR. In this study, PON3 DMR (z-score) was significantly hypermethylated in the R group respect to the NR group. Baseline DNAmet in PON3 DMR was positively associated with BMI loss, insulin levels, and HOMA-IR. In our study, PON3 DMR methylation showed a negative correlation with PON3 protein levels in serum. The findings of this study are in line with the existing literature, where a previous study found a positive correlation between serum PON3, insulin levels, and HOMA index in patients with peripheral artery disease (PAD) [Citation37]. In a recent study, in subjects with overweight and type 2 diabetes undergoing a 6-week caloric restriction diet, the drop of BMI was associated with a reduction of PON1 and PON3 protein levels [Citation39]. A previous study also reported a reduction of PON1 levels in serum after the weight loss that could be associated with the reduction of pro-inflammatory factors, and this reduction in PON1 might be indicative of the improvement in the overall oxidative environment [Citation40]. Nevertheless, other studies have not found differences in PON protein levels or activity after weight loss [Citation41,Citation42]. However, we are the first to associate the methylation of PON3 with body weight regulation.
PON1 and PON3 are known to protect LDL from oxidation [Citation32,Citation34]. In our sample we did not find differences in oxLDL levels between groups at baseline; however, a decrease was observed in the R group after the intervention. Weight loss usually induces a reduction in LDL oxidation and a decreased need for PON to protect LDL against oxidation[Citation30]. Moreover, in our study, PON activity was positively associated with oxLDL levels, which suggests a regulatory mechanism; nevertheless, it must be emphasized that the measurement of PON activity comprises the enzymatic activity of PON1, 2 and 3 isoforms, where a compensatory mechanism may be covered. Finally, it has been suggested that PON3 may contribute to protect against a variety of oxidative stress-related diseases, and it has been reported that PON3 is upregulated in human tumours and different cell lines [Citation43].
Limitations
It is important to highlight that this study has two main limitations. First, the sample type used for methylation studies. Many studies use blood cells for DNAmet analysis because of their accessibility [Citation44]. Obesity and T2D-associated DNAmet changes in metabolically active tissues (pancreatic β-cells, adipose tissue, liver, and muscle) have been reported to be quite often reflected in the blood-borne cells. For example, a broad signature of hepatocellular carcinoma has been revealed in PBMC DNAmet, which discriminates the disease progression, suggesting that blood samples might be used as a surrogate of major metabolic organs [Citation44,Citation45]; however, as epigenetic marks are tissue-specific, we cannot extrapolate the methylation results in other tissues. Second, the lack of PON3 gene expression quantification. PON3 is expressed in liver and kidney to encode a secreted protein; for this reason, we were not able to evaluate PON3 mRNA levels in the buffy coat cells.
Conclusions
Epigenetic features may represent potential biomarkers predicting individual risks or the response to dietary and pharmaceutical interventions. Above all, the present study has identified a DMR within PON3 gene that could be used as a potential analytical biomarker to predict the weight-loss response to a hypocaloric diet and may be useful to personalize obesity treatment.
Supplemental Material
Download MS Word (164.8 KB)Acknowledgments
Authors thank Marta García Granero for statistical advice, Maria Luisa Mansego for bioinformatic counselling, Ana Lorente for laboratory support, Clara Camí for technical help, and Iosune Zubieta and Laura Olazaran for recruitment, data collection, and nutritional assistance.
Disclosure statement
The authors report no conflict of interest.
Supplementary material
Supplemental data for this article can be accessed here.
Additional information
Funding
Related Research Data
References
- Kopelman PG. Obesity as a medical problem. Nature. 2000;404(6778):635–643.
- Qasim A, Turcotte M, de Souza RJ, et al. On the origin of obesity: identifying the biological, environmental and cultural drivers of genetic risk among human populations. Obes Rev. 2018;19(2):121–149.
- Meldrum DR, Morris MA, Gambone JC. Obesity pandemic: causes, consequences, and solutions—but do we have the will? Fertil Steril. 2017;107(4):833–839.
- Loh M, Zhou L, Ng HK, et al. Epigenetic disturbances in obesity and diabetes: epidemiological and functional insights. Mol Metab. 2019;27:S33–S41.
- Othman Smail H. The epigenetics of diabetes, obesity, overweight and cardiovascular disease. AIMS Genet. 2019;6(3):36–45.
- Loos RJ. The genetics of adiposity. Curr Opin Genet Dev. 2018;50:86–95.
- Egger G, Liang G, Aparicio A, et al. Epigenetics in human disease and prospects for epigenetic therapy. Nature. 2004;429(6990):457–463.
- Skvortsova K, Iovino N, Bogdanović O. Functions and mechanisms of epigenetic inheritance in animals. Nat Rev Mol Cell Biol. 2018;19(12):774–790.
- Crujeiras AB, Diaz-Lagares A, Sandoval J, et al. DNA methylation map in circulating leukocytes mirrors subcutaneous adipose tissue methylation pattern: a genome-wide analysis from non-obese and obese patients. Sci Rep. 2017;7(1):41903.
- Crujeiras AB, Morcillo S, Diaz-Lagares A, et al. Identification of an episignature of human colorectal cancer associated with obesity by genome-wide DNA methylation analysis. Int J Obes. 2019;43(1):176–188.
- Moore LD, Le T, Fan G. DNA methylation and its basic function. Neuropsychopharmacology. 2013;38(1):23–38.
- Greenberg MVC, Bourc’his D. The diverse roles of DNA methylation in mammalian development and disease. Nat Rev Mol Cell Biol. 2019;20(10):590–607.
- Tahara T, Tahara S, Horiguchi N, et al. Methylation status of IGF2 DMR and LINE1 in leukocyte DNA provides distinct clinicopathological features of gastric cancer patients. Clin Exp Med. 2018;18(2):215–220.
- Mikeska T, Craig JM. DNA methylation biomarkers: cancer and beyond. Genes (Basel). 2014;5(3):821–864.
- Milagro FI, Mansego ML, De Miguel C, et al. Dietary factors, epigenetic modifications and obesity outcomes: progresses and perspectives. Mol Aspects Med. 2013;34(4):782–812.
- Garcia-Lacarte M, Milagro FI, Zulet MA, et al. LINE-1 methylation levels, a biomarker of weight loss in obese subjects, are influenced by dietary antioxidant capacity. Redox Rep. 2016;21(2):67–74.
- Edillor CR, Parks BW, Mehrabian M, et al. DNA methylation changes more slowly than physiological states in response to weight loss in genetically diverse mouse strains. Front Endocrinol (Lausanne). 2019;10. DOI:https://doi.org/10.3389/fendo.2019.00882.
- Samblas M, Milagro FI, Martínez A. DNA methylation markers in obesity, metabolic syndrome, and weight loss. Epigenetics. 2019;14(5):421–444.
- Moleres A, Campión J, Milagro FI, et al. Differential DNA methylation patterns between high and low responders to a weight loss intervention in overweight or obese adolescents: the EVASYON study. Faseb J. 2013;27(6):2504–2512.
- van Dijk SJ, Tellam RL, Morrison JL, et al. Recent developments on the role of epigenetics in obesity and metabolic disease. Clin Epigenetics. 2015;7(1). DOI:https://doi.org/10.1186/s13148-015-0101-5
- Bock C. Analysing and interpreting DNA methylation data. Nat Rev Genet. 2012;13(10):705–719.
- Ramos-Lopez O, Cuervo M, Goni L, et al. Modeling of an integrative prototype based on genetic, phenotypic, and environmental information for personalized prescription of energy-restricted diets in overweight/obese subjects. Am J Clin Nutr. 2020;111(2):459–470.
- Obesity and overweight. Available from: https://www.who.int/news-room/fact-sheets/detail/obesity-and-overweight.
- Dobiášová M. Atherogenic index of plasma [log(triglycerides/HDL-cholesterol)]: theoretical and practical implications. Clin Chem. 2004;50(7):1113–1115.
- Salas-Pérez F, Ramos-Lopez O, Mansego ML, et al. DNA methylation in genes of longevity-regulating pathways: association with obesity and metabolic complications. Aging (Albany NY). 2019;11(6):1874–1899.
- Maksimovic J, Gordon L, Oshlack A. SWAN: subset-quantile within array normalization for illumina infinium humanmethylation450 beadchips. Genome Biol. 2012;13(6):R44.
- Müller C, Schillert A, Röthemeier C, et al. Removing batch effects from longitudinal gene expression - quantile normalization plus combat as best approach for microarray transcriptome data. PLoS One. 2016;11(6):e0156594. 10.
- Houseman E, Accomando WP, Koestler DC, et al. DNA methylation arrays as surrogate measures of cell mixture distribution. BMC Bioinformatics. 2012;13(1):86.
- Hruby A, Hu FB. The epidemiology of obesity: a big picture. Pharmacoeconomics. 2015;33(7):673–689.
- Zeisel SH. Precision (personalized) nutrition: understanding metabolic heterogeneity. Annu Rev Food Sci Technol. 2020;11(1):71–92.
- Martin EM, Fry RC. Environmental influences on the epigenome: exposure- associated DNA methylation in human populations. Annu Rev Public Health. 2018;39(1):309–333.
- Furlong CE, Marsillach J, Jarvik GP, et al. Paraoxonases-1, −2 and −3: what are their functions? Chem Biol Interact. 2016;259(Pt B):51–62.
- Reddy ST, Wadleigh DJ, Grijalva V, et al. Human paraoxonase-3 is an HDL-associated enzyme with biological activity similar to paraoxonase-1 protein but is not regulated by oxidized lipids. Arterioscler Thromb Vasc Biol. 2001;21(4):542–547.
- Draganov DI, Stetson PL, Watson CE, et al. Rabbit serum paraoxonase 3 (PON3) is a high density lipoprotein-associated lactonase and protects low density lipoprotein against oxidation. J Biol Chem. 2000;275(43):33435–33442.
- García-Heredia A, Marsillach J, Aragonès G, et al. Serum paraoxonase-3 concentration is associated with the severity of hepatic impairment in patients with chronic liver disease. Clin Biochem. 2011;44(16):1320–1324.
- Aragonès G, García-Heredia A, Guardiola M, et al. Serum paraoxonase-3 concentration in HIV-infected patients. Evidence for a protective role against oxidation. J Lipid Res. 2012;53(1):168–174.
- Rull A, García R, Fernández-Sender L, et al. Serum paraoxonase-3 concentration is associated with insulin sensitivity in peripheral artery disease and with inflammation in coronary artery disease. Atherosclerosis. 2012;220(2):545–551.
- Shih DM, Yu JM, Vergnes L, et al. PON3 knockout mice are susceptible to obesity, gallstone formation, and atherosclerosis. Faseb J. 2015;29(4):1185–1197.
- Moradi M, Mahmoudi M, Saedisomeolia A, et al. Study of the relationship between APOA-II −265T>C polymorphism and HDL function in response to weight loss in overweight and obese type 2 diabetic patients. Clin Nutr. 2018;37(3):965–969.
- Rector RS, Warner SO, Liu Y, et al. Exercise and diet induced weight loss improves measures of oxidative stress and insulin sensitivity in adults with characteristics of the metabolic syndrome. Am J Physiol - Endocrinol Metab. 2007;293(2):E500.
- Roberts CK, Ng C, Hama S, et al. Effect of a short-term diet and exercise intervention on inflammatory/antiinflammatory properties of HDL in overweight/obese men with cardiovascular risk factors. J Appl Physiol. 2006;101(6):1727–1732.
- Aicher BO, Haser EK, Freeman LA, et al. Diet-induced weight loss in overweight or obese women and changes in high-density lipoprotein levels and function. Obesity. 2012;20(10):2057–2062.
- Schweikert EM, Devarajan A, Witte I, et al. PON3 is upregulated in cancer tissues and protects against mitochondrial superoxide-mediated cell death. Cell Death Differ. 2012;19(9):1549–1560.
- Willmer T, Johnson R, Louw J, et al. Blood-based DNA methylation biomarkers for type 2 diabetes: potential for clinical applications. Front Endocrinol (Lausanne). 2018;9. DOI:https://doi.org/10.3389/fendo.2018.00744.
- Zhang Y, Petropoulos S, Liu J, et al. The signature of liver cancer in immune cells DNA methylation. Clin Epigenetics. 2018;10(1):8.