
ABSTRACT
Epigenetics links perinatal influences with later obesity. We identifed differentially methylated CpG (dmCpG) loci measured at 17 years associated with concurrent adiposity measures and examined whether these were associated with hsCRP, adipokines, and early life environmental factors. Genome-wide DNA methylation from 1192 Raine Study participants at 17 years, identified 29 dmCpGs (Bonferroni corrected p < 1.06E-07) associated with body mass index (BMI), 10 with waist circumference (WC) and 9 with subcutaneous fat thickness. DmCpGs within Ras Association (RalGDS/AF-6), Pleckstrin Homology Domains 1 (RAPH1), Musashi RNA-Binding Protein 2 (MSI2), and solute carrier family 25 member 10 (SLC25A10) are associated with both BMI and WC. Validation by pyrosequencing confirmed these associations and showed that MSI2 , SLC25A10 , and RAPH1 methylation was positively associated with serum leptin. These were also associated with the early environment; MSI2 methylation (β = 0.81, p = 0.0004) was associated with pregnancy maternal smoking, SLC25A10 (CpG2 β = 0.12, p = 0.002) with pre- and early pregnancy BMI, and RAPH1 (β = −1.49, p = 0.036) with gestational weight gain. Adjusting for perinatal factors, methylation of the dmCpGs within MSI2, RAPH1, and SLC25A10 independently predicted BMI, accounting for 24% of variance. MSI2 methylation was additionally associated with BMI over time (17 years old β = 0.026, p = 0.0025; 20 years old β = 0.027, p = 0.0029) and between generations (mother β = 0.044, p = 7.5e-04). Overall findings suggest that DNA methylation in MSI2, RAPH1, and SLC25A10 in blood may be robust markers, mediating through early life factors.
Introduction
Studies suggest that susceptibility to obesity in later life may be influenced by the early life environment. In animal models, variations in maternal body composition and diet can induce persistent changes in metabolism and body composition in the offspring [Citation1], while in humans, higher maternal BMI and excessive gestational weight gain (GWG) independently increase obesity risk in the offspring [Citation2].
Mechanisms by which the environment influences adiposity are suggested to involve the epigenetic regulation of genes. In animal models, variations in maternal diet induced changes in the methylation of key metabolic genes, which often persist through the lifecourse, accompanied by changes in gene expression and the metabolic proceses they control [Citation3]. Human studies also suggest a role for epigenetics in mediating the effects of the early life environment on later disease risk. For example, maternal carbohydrate intake and offspring adiposity have been associated with differential methylation of the promoter of the RXRA gene in the umbilical cord [Citation4], while perinatal methylation of CpGs within the promoter of the long non-coding RNA ANRIL is associated with antenatal growth faltering and higher adiposity at age 6 years [Citation5]. Although initial studies suggest that the epigenome is most susceptible to environmental factors in early life, there is increasing evidence that the epigenome retains a degree of plasticity throughout life [Citation6]. Thus, modulation of the epigenome may represent a key mechanism by which the environment influences disease risk across the lifecourse.
Epigenome-wide DNA methylation association studies (EWAS) have identified differentially methylated CpG (dmCpG) loci in blood that are associated with concurrent adiposity [Citation3,Citation7–18] and related measures of inflammation [Citation19,Citation20]. Most studies have been carried out during adulthood, rather than in adolescence/childhood [Citation3,Citation16–18] when the influences of early life exposures and plasticity of the epigenome may be stronger. Few studies have explored the longitudinal nature of these associations or the associations across generations. Here, we have undertaken EWAS on whole blood from 1192 participants of the Raine Study (www.rainestudy.org.au) at age 17 years (generation 2), to identify dmCpGs associated with concurrent measures of adiposity in adolescence, and their relationship with early life environmental factors. Subsequent pyrosequencing of the adiposity-associated dmCpGs at 17 and 20 years of age, and in matched mother–child pairs, was undertaken in order to determine whether variation in CpG methylation levels was associated with multiple measures of adiposity, serum levels of the adipokine leptin and adiponectin, and C-reactive protein as a marker of inflammation. We also assessed whether the associations between DNA methylation levels and anthropometry remain stable over a 3-year time period in the same individuals and consistent between mother and offspring. Further, we assessed stability with adjustments for genetic and early life factors.
Methods
The Raine study
The Raine Study (www.rainestudy.org.au) recruited pregnant women between 1989 and 1991 (N = 2,900) in Perth, Australia. Women were invited if they were between 16 and 20 weeks pregnant, had sufficient proficiency in English, were expected to deliver at the hospital, and intended to remain in the jurisdiction [Citation21]. There were 2868 live births (including 2 742 singletons, 60 sets of twins, and 2 sets of triplets.) By the 17-year follow-up, there had been attrition (36 deaths, 480 withdrawn, 598 lost or deferred) [Citation22].
Maternal (Gen1) data
Maternal weight was obtained from medical records at mean 16.5 ± 2.2 and mean 34.1 ± 1.5 weeks’ gestation. GWG was defined as the weight gained from 16 to 34 weeks. Maternal smoking during pregnancy was assessed from questionnaires (yes/no) (validated against serum cotinine) [Citation23], and a stress score ascertained using the 11-item questionnaire derived from the Life Stress Inventory at 18 and 34 week gestation. Total life event index scores were calculated throughout pregnancy from the sum of events [Citation24]. Breast feeding duration was obtained from questionnaires 12-months post-partum.
Offspring (Gen2) data
Details of anthropometry (weight, height, waist circumference (WC), and skinfold thicknesses) at 17 and 20 years old are previously described [Citation25]. At 17 years old, ultrasound (Siemens Antares, Mountain View, CA, USA) adipose thickness was measured by ultrasonographers using standardized criteria [Citation26]. At 20 years old, dual-energy x-ray absorptiometry (DEXA) (Norland XR-36 densitometer, Norland Medical Systems, Fort Atkinson, WI, USA) measured whole body fat, lean, and soft tissue mass (g). Venous blood was sampled after overnight fasting; serum high-sensitivity C-reactive protein (hsCRP), leptin, and adiponectin were measured at the PathWest Laboratory (Royal Perth Hospital) as previously described [Citation27].
Diet was assessed at 17 years old using a semi-quantitative food frequency questionnaire (FFQ) developed by the Commonwealth Scientific and Industrial Research Organization (CSIRO) in Adelaide, Australia, to assess study adolescents’ usual dietary intake over the previous year. The FFQ was able to correctly rank most nutrient intakes when compared with a 3-day food diary [Citation28]. Factor analysis was used to reduce the food group intakes measured by the FFQ into a smaller number of underlying factors or dietary patterns that could explain variations in dietary intake. Two major dietary patterns were identified: a ‘Healthy’ pattern, high in fresh fruit, vegetables, whole grains, and grilled or canned fish, and a ‘Western’ pattern, high in take-away foods, confectionery, soft drinks, and chips [Citation29].
Steps in the study
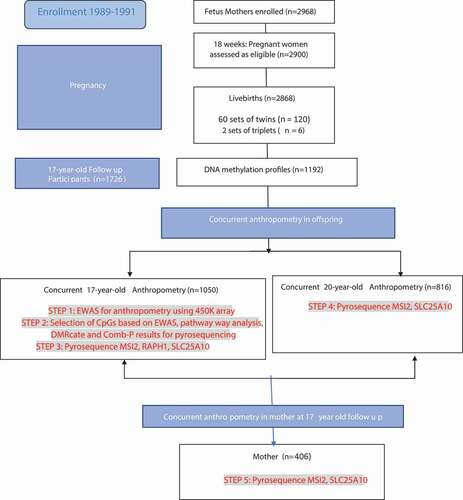
Shown in , the steps of recruitment and follow-ups of the Raine Study are depicted, alongside the subpopulations within which the multiple epigenetic analyses were performed.
Figure 1. Study steps shown, including recruitment and follow-ups of the Raine Study. The epigenetic analyses, specifically Infinium 450 K array and pyrosequencing at different time points and generations is shown in highlighted red font.
Infinium HumanMethylation 450 K BeadChip array
In step 1 (), DNA was extracted from 5-ml samples of ethylenediaminetetraacetic acid (EDTA) blood from 17 years old adolescents from the RAINE study using a Puregene DNA isolation kit based on a simple salting out technique [Citation30]. 1 µg of the genomic DNA was treated with sodium bisulphite using Zymo EZ DNA Methylation-Gold kit (ZymoResearch, Irvine, California, USA, D5007), and processing of the HumanMethylation450K (Infinium Methylation 450 K; Illumina, Inc. CA, USA) platform was carried out by the Centre for Molecular Medicine and Therapeutics (CMMT) (http://www.cmmt.ubc.ca).
Infinium HumanMethylation 450 K BeadChip array data processing
QC used R and Bioconductor packages shinyMethyl [Citation31], MethylAid [Citation32], and RnBeads [Citation33]. Four participants (3 outliers, 1 gender misclassification) were removed. Three outliers were removed due to poor probe quality and were identified as outliers using principal components for both methylAID and shinymethyl using default thresholds. These default thresholds for the 450 K array correspond to [Citation1] median of methylated/unmethylated ratio = 10.5 [Citation2], overall sample-dependent ratio = 11.75 [Citation3], bisulphite conversion = 12.75 [Citation4], hybridization control probe quality = 13.25 [Citation5], detection p-value = 0.95. The fourth sample was removed as there was sex chromosome discrepancy based on the average signal intensity for those participants. Sixty-five intentional SNP CpGs, 11,648 sex chromosome CpGs, and 10,777 CpGs with a detection p-value >0.05 in any sample were removed. One hundred and sixty probes with bead counts <3 in >5% samples were removed. Beta-mixture quantile normalization [Citation34] was applied to each CpG. As the batch effects were still present, technical covariates (plate, slide, and well number) were included in all statistical models performed.
Infinium HumanMethylation 450 K BeadChip array data analysis
As cellular heterogeneity is known to influence DNA methylation profiles and drive some of the observed differences across individual blood samples, we adjusted methylation values for cell counts using the estimated Housman method [Citation35] as implemented in the R statistical package, minfi [Citation36] for six cell types (CD8T, CD4T, NK, B cell, monocytes, and granulocytes). Linear mixed effects examined the association of each autosomal CpG with adiposity measures, accounting for age, sex, cell count, well, and row, with plate number as the random effect. Changes in BMI per unit change in methylation (0–1 scale, corresponding to 0–100% change in methylation) were reported.
Differentially Methylated Regions (DMRs)
For the identification of DMRs, we utilized two methods, Comb-p [Citation37] and DMRcate [Citation38]. Comb-p and DMRcate utilize one-step Sidak correction [Citation39] and the Benjamini–Hochberg method for false-discovery rate (FDR) [Citation40], finding significant CpGs <1,000 nucleotides. For the DMR analysis, the Stouffer correction was applied to calculate the p-value. Within a genomic region, we set the minimum number of CpGs at 2. To maximize robustness, we only considered a DMR significant when it was detected in both Comb-p and DMRcate. Resulting DMRs were annotated with the UCSC Refgene panel from the Illumina annotation file in DMRcate [Citation37].
Pathway analysis
Gene set enrichmnent analysis used the Bioconductor package missMethyl [Citation41]. Pathways enriched by CpGs with p< 0.001 were reported as significant, with FDR corrected p-value <0.05. These CpGs with p< 0.001 were annotated with the nearest UCSC hg19 human genome reference panel to determine their Entrez Gene ID. To account for potential probe number bias, where a gene with more CpGs is likely to be associated with a gene, we employed a modified hypergeometric test as implemented in missMethyl. We also accounted for ‘multi-gene bias’ as approximately 10% of CpGs on the 450 K are associated with more than one gene and is accounted for within the gene set testing function within missMethyl.Pyrosequencing
Bisulphite pyrosequencing was undertaken on DNA from 17 (n = 1050) and 20 (n = 817) year olds (gene2)(Step 4 in ) and their mothers (n = 406) (gen1) (Step 5 in ). It measured DNA methylation (%) of each CpG (Pyro Q-CpG 1.0.9 software). Bisulphite conversion, PCR, and primer design details are provided in supplementary Table 1. Pyrosequencing covered two adjacent CpG loci in MSI2 locus and one additional CpG in the SLC25A10 locus (Supplementary Table 2).
Statistical analysis of pyrosequencing data
Statistical analysis was carried out using SPSS (v24.0) and R (v3.3). Where appropriate, outcomes were transformed using natural logarithms to satisfy the assumption of normality. Agreement between methylation from pyrosequencing and Infinium arrays was assessed by Bland-Altman plots [Citation42]. The same tests were used to assess agreement between pyrosequenced methylation within corresponding loci in mother and offspring.
Multivariate linear regression was undertaken with the outcome being adiposity or inflammatory marker (hsCRP, leptin, adiponectin) and independent variable being the pyrosequenced CpG(%). Adiposity was measured as BMI (kg/m2), WC (cm), subcutaneous and visceral fat thickness, fat, and lean mass (g). Coefficients (β) represent the log-transformed unit of change in outcome/SD change in methylation with associated FDR adjusted p-value (q-values). Analyses adjusted for age, sex, cell count where available [Citation43], and SNPs identified as affecting CpGs. SNPs associated with CpGs were evaluated by the Gene Environment Methylation (GEM) package [Citation44], which detects genome-wide, methylation markers associated in cis and trans genetic polymorphisms according to the model M = α + βG + age + sex + cell count +ε (where M is the methylation matrix and G is the genotype matrix). Collinearity was avoided by removing covariates with high variance inflation factors [Citation45]. All models were tested for sex interaction and reported separately if a significant interaction was detected.
In assessing effects of early environment, linear regression was undertaken with CpG methylation as the outcome. Environmental factors from early life (prepregnancy BMI, GWG, smoking during pregnancy, maternal stress, and breast feeding duration) were independent variables. A final model predicting BMI at 17 years old considered the covariates of all pyrosequenced CpGs, cell counts, age, sex, and environmental factors (associated with CpGs at p < 0.05). Backward selection determined maximal parsimony with variables removed if the significance level of its F value is greater than the removal value of 0.10. The model summary R2 was taken to indicate the variance in BMI at 17 years old that is predicted by the variables in the model.
Results
Participants
Of 1192 individuals with DNA methylation profiles, 1050 (51% males) with anthropometry measurements were analysed. Participants had a mean (SD) age of 17.1 (0.3) years, BMI 23.1 (4.5) kg/m2, and WC 79.5 (11.5) cm. At age 20 years, 817 of these had anthropometry, DEXA (mean BMI 24.5 (5.1) kg/m2, WC 80.2 (12.9) cm), and DNA methylation measured (). Additionally, 406 mothers had concurrent BMI and DNA methylation measured.
Table 1. General characteristics of participants. Number of participents, general characteristics, phenotypic information, and DNA methylation levels of pyrosequenced MSI2, SLC25A10, and RAPH1.
Identification of dmCpGs and DMRs associated with adiposity measures at 17 years
DNA from peripheral blood of the 17 year old adolescents from The Raine study was interrogated for genome-wide DNA methylation using the Infinium 450 K array. Adjusting for cell count heterogeneity and batch effects, there were associations (Bonferroni corrected p < 1.06e-07) between DNA methylation and concurrent BMI, WC, and subcutaneous fat (SC) (supplementary Table 3), but no associations between CpG methylation and visceral fat thickness. Manhattan and volcano plots ( show the –log10 p-values for individual autosomal CpG probe associations for BMI, WC, SC, and visceral fat thickness. Q–Q plots for evaluation of model fit are shown in Supplementary Figure 1. The lambda values for BMI, WC, subcutaneous fat, and visceral fat were 1.5, 1.7, 1.1 and 3.2, respectively. Twenty-nine dmCpGs were associated with BMI, the top 2 dmCpGs were located within pleckstrin homology domains containing protein 1 (RAPH1) (cg07390598) and Musashi RNA-binding protein 2 Ras-associated (MSI2) (cg21139312) genes. Ten dmCpGs were associated with WC, the top 2 being cg07390598 and cg21139312, the same dmCpG sites within RAPH1 and MSI2 that were most strongly associated with BMI. Nine dmCpGs associated with SC fat thickness, the top dmCpG being cg21139312 located within MSI2. Overlap was observed between dmCpGs associated with BMI, WC, and SC; 8 dmCpGs were shared between BMI and SC fat thickness, 8 between WC and SC fat thickness, and 3 (cg21139312 [MSI2], cg07390598 [RAPH1], and cg10773745 [intergenic region]) between all three adiposity measurements ().
Figure 2. Epigenome Wide Association Study (EWAS) results which show DNA methylation associations with adiposity at 17 years of age.
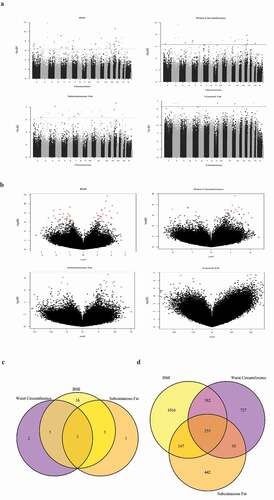
Regional methylation associations were explored using DMRcate and Comb-p, identifying 9 and 22 (6 overlapping) DMRs, respectively, associated with BMI; 8 and 2 (2 overlapping) DMRs associated with WC, and 8 and 6 (2 overlapping) with SC (supplementary Table 4). The DMR in a 60 bp region within MSI2 was associated with BMI by DMRcate (p-value = 7.01E-12) and Comb-p (p-value = 1.23e-09), and with WC by DMRcate (p-value = 4.42e-06). Both DMR models identified the MSI2 region in association with SC fat (DMRcate: p-value = 4.42 e-06, comb-p: p-value = 7.0eE-12) .
Pathways associated with inflammatory response and histone modification were enriched among dmCpGs associated with adiposity
To explore the functional significance of associations between methylation and adiposity measures, pathway analysis was undertaken. For BMI, the top pathway in the Gene Ontology category was inflammatory response (pFDR = 5.59e-04), for WC, there was enrichment for histone modifications and methyltransferase activity(pFDR = 0.033). SC fat showed no significant pathways (supplementary table 5). For BMI and WC or SC, no KEGG (Kyoto Encyclopaedia of Genes and Genomes) pathways were significant.
Validation by pyrosequencing of adiposity-related dmCpGs
The criteria for choosing CpGs to proceed to pyrosequencing included prioritizing those that consistently passed FDR on three measures of adiposity (BMI, WC, Subcutaneous fat), and then two measures of adiposity (BMI and WC). Within the FDR significant CpGs, those whose associations were less likely to confounded by technical factors and more likely to be interpretable and clinically meaningful were favoured. For instance, we chose those that showed significance within pathway analysis, DMRcate and Comb-P. Those within CpG islands were also given priority as they were more likely to influence transcription. We gave lower priority to those CpGs with extreme mean methylation (<10% and >90%), as technical accuracy of the pyrosequencing method is decreased at the limits of the range.
MSI2 cg21139312 and RAPH1 cg07390598 were selected for pyrosequencing as the most highly ranked dmCpGs for association with BMI and WC; MSI2 cg21139312 was also the top ranked dmCpG with SC fat. The region of chromosome 17:55,663,225 to 55,663,284 encompassing the MSI2 cg21139312 (chr17:55,663,225) was the second ranked enriched region for BMI by DMRcate (p = 7.01e-12) and Comb-p (p-value = 9.09 e-09), and 7th ranked for WC (p-value = 4.4e-06). The third dmCpG chosen for validation was SLC25A10 cg09996840, as it was associated with both BMI and WC and belonged to an enriched 990 base region for WC (p-value = 5.58e-07) (supplementary Table 4). For MSI2, the pyrosequencing assay covered two additional CpG sites, one upstream (CpG1) and one downstream (CpG3) of cg21139312 (CpG2). For SLC25A10, the pyrosequencing assay covered one additional CpG site (CpG2). Bland–Altman plots comparing DNA methylation levels measured by 450 K array and pyrosequencing at these CpGs are shown (supplementary Figure 2a).
Consistent with the methylation array, pyrosequencing analysis showed MSI2 cg21139312(CpG2) associated with BMI (β = 0.026, p-value = 1.3e-04), WC (β = 0.019, p-value = 2.1e-04), and SC fat thickness (β = 0.068, p-value = 0.003). The two flanking MSI2 CpG sites were also associated with BMI, WC, and SC fat thickness. All three MSI2 CpGs were associated positively with suprailiac, subscapular, and triceps skinfold thicknesses (). Methylation of SLC25A10 CpGs measured by pyrosequencing were associated with BMI (CpG1 β = 0.020, p-value = 0.011; CpG2 β = 0.030, p-value = 1.4e-04), WC (CpG2 β = 0.018, p-value = 0.004), and SC fat thickness (CpG1 β = 0.080, p-value = 0.004; CpG2 β = 0.087, p-value = 0.003). RAPH1 methylation was associated with BMI, WC, or SC fat thickness before cell-type adjustment, but there was no association with these measures of adiposity after adjustment (, ). SLC25A10 and RAPH1 methylations were not associated with skinfold thicknesses. No CPSs are associated with visceral fat ().
Table 2. Associations of MSI2, RAPH1 and SLC25A10 DNA methylation with anthropometry Associations of MSI2, RAPH1 and SLC25A10 DNA methylation with anthropometrical measures of adiposity (BMI, waist, skin folds) at ages 17 and 20 years and associations with measures of body composition (subcutaneous and visceral fat thickness at age 17 years, and DEXA measurements at age 20 years). All models were adjusted for age, sex and where available for cell count (CD4, CD8, NK, B Cell, Monocytes). Covariates with high variance inflation factors were removed to avoid collinearity as well as Granulocytes. All β-coefficients are expressed per SD change of CpG. q-values which pass FDR accounting for multiple testing are shown in darker font. # Log transformed.
Figure 3. Linear regression associations with adiposity at age 17 years of age.
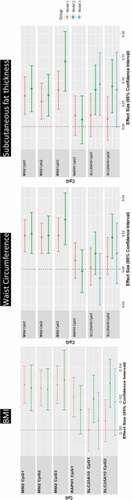
DNA methylation at 17 years of all three MSI2 and Raph1 CpGs was positively associated with BMI measured at 20 years. Changes in DNA methylation between 17 and 20 years were not associated with BMI at 20 years of age. (Supplemental Table 6)
Association of DNA methylation with serum inflammatory markers and adipokines at 17 years of age
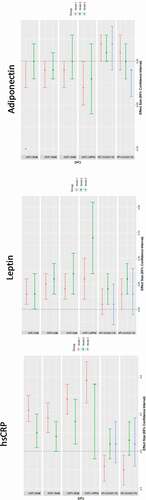
At 17 years, MSI2 methylation was associated with hsCRP (CpG1 β = 0.053, p-value = 0.02; CpG3 β = 0.08, p-value = 0.001) and serum leptin (CpG1 β = 0.034, p-value = 0.039; CpG2 β = 0.056, p-value = 0.0002; CpG3 β = 0.069, p-value = 0.0018) (supplementary table 7, ). Methylation of SLC25A10 CpG1 (β = 0.036, p-value = 0.018; CpG2 β = 0.06, p-value = 0.00017) and Raph1 CpG1 (β = 0.138, p-value = 0.00016) were associated with leptin levels (). No associations were detected between adiponectin and any of the pyrosequenced CpGs. All sex interactions were non-significant.
Figure 4. Association between MSI2, RAPH1 and SLC25A10 DNA methylation with inflammation and adipokines at age 17-years.
Influence of genotype on dmCpGs associated with adiposity
To assess how genotype influences pyrosequenced DNA methylation loci, the GEM R package [Citation44] was used. SLC25A10 (cg09996840) was associated with genotype at 12 cis acting SNPs (supplementary table 8a) all located on the north shore of a CpG island at chr17:79,682,525–79,682,767. The most significant SNP was rs6565624 (q-value = 2.4 x 10–152 (FDR)). Neither MSI2 (cg21139312) nor RAPH1(cg07390598) were significantly associated with genotype at any of the SNP sites measured. The identified SNPs were tested alongside the pyrosequenced SLC25A10 CpGs for predicting BMI or WC. Genotype at tSNPs (rs6565624_G, rs3830068_G, rs12452184_A) was consistently associated with BMI and WC, while abolishing the effects of SLC25A10 CpG1 and CpG2. (Supplementary table 8b and model 3 in ).
Early environmental factors are associated with altered MSI2 and SLC25A10 methylation in adolescence
Methylation of SLC25A10 CpGs 1 and 2 was positively associated with maternal pre-pregnancy BMI (CpG1 β = 0.07, p-value = 0.022; CpG2 β = 0.12, p-value = 0.002) (Supplementary table 9), while MSI2 CpG 2 and 3 methylation was positively associated with smoking at 18 weeks (CpG2 β = 0.81, p-value = 4.8e-04; CpG3 β = 0.76, p-value = 0.006) but not with smoking at 28 week gestation. RAPH1 methylation was associated with GWG rate (β = −1.49, p-value = 0.036)(g/wk).
A model was formed by backward selection with pre-pregnancy BMI, maternal smoking at 18-week gestation and GWG, all pyrosequenced CpGs, cell counts and potential me-QTLs (rs6565624_G, rs3830068_G, rs12452184_A) for the outcome of BMI at 17 years. Variables were removed if the significance level of its F value was greater than 0.10. The final model (r2 = 0.243 (SE = 0.15), () included independent effects of rs6565624_G, MSI2 CpG1, RAPH1, maternal smoking at 18-weeks, pre-pregnancy BMI, CD8+, CD4 + T cells, and granulocytes ().
Table 3. Final linear regression model predicting BMI at 17 years old. Linear regression model for the outcome of BMI at 17-years was formed by backward selection with pre-pregnancy BMI, maternal smoking at 18-weeks gestation and GWG, all pyrosequenced CpGs, cell counts and potential me-QTLs (rs6565624_G, rs3830068_G, rs12452184_A). The model (r2 = 0.243 (SE = 0.15), includes independent effects of rs6565624_G, MSI2 CpG1, RAPH1, maternal smoking at 18-weeks, pre-pregnancy BMI, CD8+, CD4 + T cells, and granulocytes.
Methylation of MSI2 and SLC25A10 are associated with concurrent measures of adiposity at 20 years
In the 20 years old participants, DNA was extracted from peripheral blood and the three MSI2 and two SLC25A10 CpGs were pyrosequenced. All MSI2 CpGs were positively associated with concurrent BMI, WC, suprailiac, and subscapular skinfold fat thicknesses and lean mass; MSI2 CpG2 was associated with fat mass. SLC25A10 CpG1 was associated with WC, suprailiac, and triceps skinfold thicknesses, and CpG2 with tricep thickness (all p-values<0.05) ().
Methylation of MSI2 in mothers is associated with maternal BMI and offspring methylation
DNA methylation of MSI2 and SLC25A10 CpGs from maternal blood samples was measured by pyrosequencing. MSI2 methylation was associated with maternal BMI adjusted for maternal age (CpG1 β = 0.031, p-value = 3.6e-04; CpG2 β = 0.044, p-value = 1.2e-04; CpG3 β = 0.043, p-value = 1.8e-05); SLC25A10 CpGs were not significantly associated with maternal BMI ().
Table 4. Associations of peripheral blood DNA methylation of MIS2, RAPH1 and SLC25A10 with concurrent BMI in mothers of RAINE adolescents. Associations are adjusted for maternal age. BMI and maternal age were ascertained at the time of blood collection. Total sample size is 406. All β-coefficients are expressed per SD change of CpG. q-values which pass FDR accounting for multiple testing are shown in darker font.
Methylation levels of the CpGs from child and mother were compared by Bland–Altman plots and showed fixed and proportional bias for all CpGs (supplementary Figure 2b). The mean value of the difference differed from 0 on one-sample t-tests (all p < 0.001). Adolescents had overall lower levels of DNA methylation for MSI2 CpGs, compared to their mothers (mean differences: CpG1 − 4.2 ± 5.1; CpG2 − 3.8 ± 3.7, CpG3 − 4.6 ± 5.4). The association of the mean MSI2 methylation upon the dependent variable for difference in methylation was significant (CpG1 β = 0.28, p-value = 7.3e-07; CpG2 β = 0.38, p-value = 2.9e-12; CpG3 β = 0.44, p-value = 2.5e-16). All coefficients were positive, indicating that with increasing overall MSI2 methylation, the child’s MSI2 methylation was increasingly inflated compared to the mother’s.
Discussion
Our EWAS identified novel dmCpGs in peripheral blood associated with measures of adiposity in adolescents, with a considerable overlap in the dmCpGs associated with BMI, WC, and SC fat thickness. DNA methylation at three novel dmCpG loci related to the genes MSI2, SLCA25A10, and RAPH1 was associated with a wide range of adiposity/body composition measures in adolescents, and with a number of antenatal factors including GWG, maternal BMI, and maternal smoking. Furthermore, for one locus, MSI2, the association with BMI was observed over time and between generations, suggesting DNA methylation changes in peripheral blood may be robust markers of adiposity across the lifecourse.
In this study, we identified a consistent positive association between MSI2 methylation and multiple measures of adiposity. MSI2 is an RNA-binding protein which plays a key role in post-transcriptional processing [Citation46]. The same CpG site within the MSI2 gene has previously been reported by Dhana et al. to be the most significantly associated dmCpG with BMI in older adults [Citation47], while Shah [Citation48] showed a positive association between cg21139312 and BMI in Dutch adults (n = 750) at 45.5 ± 13.3 years. Our data have now demonstrated the same association in adolescence and young adults, suggesting that differential methylation of MSI2 may be a robust marker of adiposity throughout the lifecourse. MSI2 methylation was also positively associated with leptin, a hormone predominantly made by adipose cells which regulates energy balance [Citation49] and hsCRP, a marker of systemic inflammation [Citation50]. Whether leptin or hsCRP are drivers of the associations between MSI2 methylation and adiposity, or simply bystanders, reflecting the pro-inflammatory state and/or leptin-resistant state associated with high BMI remains to be determined.
Associations between MSI2 methylation and BMI in the mothers of the proband were also observed. Moreover, the associations were in the same direction with a similar or larger estimated effect size compared to their children. This may be attributed to the mothers being approximately 17 years older with a higher BMI than their offspring at the time of the assessment. Compared to our adolescent data, in middle-aged participants, a larger MSI2 methylation effect size upon BMI was reported in the Atherosclerosis Risk in Communities (ARIC), and a similar effect size was reported in the Rotterdam Study [Citation47], the direction of the effect being the same in all these studies. These observations suggest that the association between MSI2 methylation and BMI is generally accentuated with age, possibly due to the natural progression of increasing BMI with age. The consistent association of MSI2 with adiposity in two generations (mother and offspring) shows further internal replication. Bland–Altman analysis showed that with increasing mean (mother and child) MSI2 methylation, the child’s DNA methylation was relatively higher, compared with a dyad with lower mean methylation. This suggests that higher familial levels of obesity and MSI2 methylation may compound obesity and MSI2 methylation in the next generation, potentially transmitting across generations. This increase in BMI and MSI2 methylation within more obese families may be due to shared environment and/or genetics.
A positive association between SLC25A10 methylation and adiposity was also observed. SLC25A10 catalyses transport dicarboxylates across the inner mitochondrial membrane providing substrates for the Krebs cycle and fatty acid synthesis [Citation51]. Increased expression of SLC25A10 has been reported in white adipose tissue in obese mouse models and decreased expression in a fasted mouse model [Citation52]. Moreover, a global transcriptome profiling study identified SLC25A10 as a modifier of insulin sensitivity in adipose tissue in obese women and an inhibitor of insulin-stimulated lipogenesis [Citation53]. Me-QTLs were also identified with cg09996840, which when adjusted for, abolished the association between SLC25A10 CpGs and BMI, suggesting that genetics, rather than environment determines the relationship between methylation and adiposity at this locus. DNA methylation at SLC25A10 may lay on the regulatory pathway by which the identified SNPs influence BMI, in much the same way Kato et al. [Citation54] suggested for SNPs associated with blood pressure.
The third dmCpG associated with BMI was located within RAPH1, which encodes a protein regulating actin and cellular migration [Citation55]. No direct association between RAPH1 and energy homoeostasis has previously been reported. However, the dmCpG site located within RAPH1 overlaps the cholinesterase 2 locus [Citation56] that codes a protein that binds to butyrylcholinesterase, which in turn has been linked to adiposity and insulin resistance [Citation57]. In contrast with the multiple associations observed between DNA methylation and BMI, WC, and SC, there were no associations observed between DNA methylation and visceral fat, possibly, due to the youth of our participants, in which excess adipose tissue is preferentially laid down subcutaneously, increasing relative sensitivity for detecting associations with subcutaneous fat compared to deeper fat deposits [Citation58].
Methylation of MSI2, RAPH1, and SLC25A10 dmCpGs was also associated with antenatal factors including GWG, maternal BMI, and maternal smoking, consistent with the paradigm that the early environment can influence the epigenome with long-term consequences. Interestingly, there were differences in the associations between the dmCpGs, with RAPH1 methylation being associated with GWG, MSI2 with maternal smoking, and SLC25A10 with maternal pre-pregnancy BMI, suggesting that different environmental exposures may drive associations at distinct loci. Interestingly, even after adjusting for these perinatal factors, we found that methylation of the dmCpGs within MSI2, RAPH1, and SLC25A10 independently predicted adolescent BMI, accounting for 24% of variance. This suggests that differential methylation of the three dmCpG loci identified in this study captures a significant proportion of the variance associated with BMI and that such marks may be useful indices of adiposity.
The strength of this study is the ability to integrate prospectively collected early life environment with multiple time points across multiple generations, from which we have identified robust associations between specific dmCpG sites and measures of adiposity across a wide age range. Moreover, our study shows a strong link between inflammation and dmCpGs related to adiposity in adolescence. The most significant gene ontology on pathway analysis was ‘inflammatory responses,’ and selected pyrosequenced dmCpGs were highly associated with hsCRP and leptin, consistent with obesity being a chronic inflammatory disease [Citation59]
Limitations of this study include the use of BMI which is an inexact approximation of adiposity, and which is unable to differentiate between muscle and fat tissue. However, we found considerable overlap between dmCpGs and DMRs associated with BMI, WC, SC, and skinfold thickness which increases the validity of the associations. A second limitation is that we measured DNA methylation in whole blood, and whether similar epigenetic changes are present in adiposie tissue is not currently known; however, DNA methylation changes in nucleated blood cells may reflect changes in immune function or be related to inflammation. Consistent with this hypothesis, there was enrichment among the dmCpGs in pathways related to inflammation. Thirdly, we report associations within a single cohort. However, pyrosequencing validation was undertaken to increase the accuracy of the DNA methylation measurements with internal validation at two separate follow-up time points, and within the mothers of the children. Finally, although we found that the adiposity-associated dmCpGs were also associated with a variety of maternal factors, it is not known whether these maternal factors drive increased adiposity through changes in the DNA methylation at these dmCpG loci, although as the dmCpGs within MSI2, SLC25A10, and RAPH all predicted adiposity independently of maternal factors, it would suggest that the likely effect is increased adiposity resulting in altered methylation. Methylation levels within SLC25A10 are associated with in cis genotype and may mediate a genetic influence on adiposity levels.
In conclusion, MSI2, SLC25A10, and RAPH1 methylation was identified through EWAS and validated in their associations with multiple measures of adiposity. All three independently associated with adolescent BMI even after adjusting for multiple early life factors.
MSI2, in particular, has been shown in this study to be particularly robust over time and multiple anthropometry measures. Furthermore, the association replicated in the mother and with serum leptin as a marker of adiposity. Such findings suggest that certain DNA methylation changes in peripheral blood can be robust markers of adiposity. It is not possible to determine whether the DNA methylation changes are a consequence or cause of adiposity and related inflammation, with the study suggesting both direct and indirect mediation through early life factors.
Availability of data and material
The Raine Study holds a rich and detailed collection of data gathered over 30 years for the purpose of health and well-being research. The informed consent provided by each participant does not permit individual-level data to be made available in the public domain (i.e., a public data repository). However, de-identified analytic data sets are available to all researchers for original research or auditing of published findings. All data access is managed through established Raine Study procedures which require data handlers to agree to a code of conduct, outlined in the Raine Study Researcher Engagement Policy, that includes safeguards to protect the identity of participants. Details of the data access processes and code of conduct are available on the Raine Study website.
Authors’ contributions
R-CH, KAL, and GCB conceived the project. R-CH, KAL, GCB, KMG, LJB, JDH, JMC, TAM, PEM, WHO developed the methods. MAB, RC-H, EC, and KAL performed the laboratory pyrosequencing. MSK, JLM, AMM performed the laboratory arrays. PEM, SR and DA performed bioinformatics. R-CH, KAL and KMG wrote the manuscript. All co-authors reviewed and edited the manuscript.
Declarations
Ethics approval and consent to participate/Consent for publication
Institutional ethics approval for the original Raine Study and DNA methylation analysis have been obtained from the University of Western Australia Ethics Committee (RA/4/1/6613, 1214-EP, RA-4-1-2646). Written informed consent was obtained from legal guardians or parents of those under the age of 17 years with assent of the child. Written informed consent was obtained for those 17 years and older.
Supplemental Material
Download Zip (972.5 KB)Acknowledgments
We acknowledge the Raine Study participants and their families, The Raine Study Team for cohort co-ordination and data collection, The NH&MRC for their long-term contribution to funding the study over the last 29 years, The Telethon Kids Institute for long-term support of the Study. We also acknowledge The University of Western Australia (UWA), Curtin University, The Telethon Kids Institute, Women and Infants Research Foundation, Edith Cowan University, Murdoch University, The University of Notre Dame Australia, and Raine Medical Research Foundation for providing funding for Core Management of the Raine Study. The DNA methylation work was supported by NHMRC grant 1059711. The 17-year follow-up was supported by the National Health and Medical Research Council Program grant (ID353514) and Project grant (ID403981)
Disclosure statement
KMG has received reimbursement for speaking at conferences sponsored by companies selling nutritional products. KMG and KAL are part of an academic consortium that has received research funding from Abbott Nutrition, Nestec and Danone. Other coauthors have nothing to disclose
Supplementary material
Supplemental data for this article can be accessed here.
Additional information
Funding
Related Research Data
References
- Bertram CE, Hanson MA. Animal models and programming of the metabolic syndrome. Br Med Bull. 2001;60(1):103–121.
- Catalano PM, Kirwan JP. Maternal factors that determine neonatal size and body fat. Curr Diab Rep. 2001;1(1):71–77.
- Rzehak P, Covic M, Saffery R, et al. DNA-methylation and body composition in preschool children: epigenome-wide-analysis in the European Childhood Obesity Project (CHOP)-study. Sci Rep. 2017;7(1):14349.
- Godfrey KM, Sheppard A, Gluckman PD, et al. Epigenetic gene promoter methylation at birth is associated with child’s later adiposity. Diabetes. 2011;60(5):1528–1534.
- Lillycrop K, Murray R, Cheong C, et al. ANRIL promoter DNA methylation: a perinatal marker for later adiposity. Ebiomedicine. 2017;19:60–72.
- Hoile SP, C-H R, Huang RC, et al. Supplementation with N-3 long-chain polyunsaturated fatty acids or olive oil in men and women with renal disease induces differential changes in the DNA methylation of FADS2 and ELOVL5 in peripheral blood mononuclear cells. Plos One. 2014;9(10):e109896.
- Dick KJ, Nelson CP, Tsaprouni L, et al. DNA methylation and body-mass index: a genome-wide analysis. Lancet. 2014;383(9933):1990–1998.
- Aslibekyan S, Demerath EW, Mendelson M, et al. Epigenome-wide study identifies novel methylation loci associated with body mass index and waist circumference. Obesity. 2015;23(7):1493–1501.
- Al Muftah WA, Al-Shafai M, Zaghlool SB, et al. Epigenetic associations of type 2 diabetes and BMI in an Arab population. Clin Epigenetics. 2016;8(1):13.
- Ronn T, Volkov P, Gillberg L, et al. Impact of age, BMI and HbA1c levels on the genome-wide DNA methylation and mRNA expression patterns in human adipose tissue and identification of epigenetic biomarkers in blood. Hum Mol Genet. 2015;24(13):3792–3813.
- Meeks KAC, Henneman P, Venema A, et al. An epigenome-wide association study in whole blood of measures of adiposity among Ghanaians: the RODAM study. Clin epigenetics. 2017;9:9.
- Almen MS, Nilsson EK, Jacobsson JA, et al. Genome-wide analysis reveals DNA methylation markers that vary with both age and obesity. Gene. 2014;548(1):61–67.
- Wang X, Zhu H, Snieder H, et al. Obesity related methylation changes in DNA of peripheral blood leukocytes. BMC Med. 2010;8:8.
- Xu X, Su S, Barnes VA, et al. A genome-wide methylation study on obesity: differential variability and differential methylation. Epigenetics. 2013;8(5):522–533.
- Almen MS, Jacobsson JA, Moschonis G, et al. Genome wide analysis reveals association of a FTO gene variant with epigenetic changes. Genomics. 2012;99(3):132–137.
- Huang RC, Garratt ES, Pan H, et al. Genome-wide methylation analysis identifies differentially methylated CpG loci associated with severe obesity in childhood. Epigenetics. 2015;10(11):995–1005.
- Richmond RC, Sharp GC, Ward ME, et al. DNA methylation and BMI: investigating identified methylation sites at HIF3A in a causal framework. Diabetes. 2016;65(5):1231–1244.
- Rounge TB, Page CM, Lepisto M, et al. Genome-wide DNA methylation in saliva and body size of adolescent girls. Epigenomics. 2016;8(11):1495–1505.
- Ligthart S, Marzi C, Aslibekyan S, et al. DNA methylation signatures of chronic low-grade inflammation are associated with complex diseases. Genome Biol. 2016;17(1):255.
- Su S, Zhu H, Xu X, et al. DNA methylation of the LY86 gene is associated with obesity, insulin resistance, and inflammation. Twin Res Hum Genet. 2014;17(3):183–191.
- Newnham JP, Evans SF, Michael CA, et al. Effects of frequent ultrasound during pregnancy - a randomized controlled trial. Lancet. 1993;342(8876):887–891.
- Straker L, Mountain J, Jacques A, et al. Cohort profile: the Western Australian pregnancy cohort (Raine) study-generation 2. Int J Epidemiol. 2017;46(5):1384–+.
- Stick SM, Burton PR, Gurrin L, et al. Effects of maternal smoking during pregnancy and a family history of asthma on respiratory function in newborn infants. Lancet. 1996;348(9034):1060–1064.
- Robinson M, Mattes E, Oddy WH, et al. Prenatal stress and risk of behavioral morbidity from age 2 to 14 years: the influence of the number, type, and timing of stressful life events. Dev Psychopathol. 2011;23(2):507–520.
- Huang RC, Burrows S, Mori TA, et al. Lifecourse adiposity and blood pressure between birth and 17 years old. Am J Hypertens. 2015;28(8):1056–1063.
- Kim SK, Kim HJ, Hur KY, et al. Visceral fat thickness measured by-ultrasonography can estimate not only visceral obesity but also risks of cardiovascular and metabolic diseases. Am J Clin Nutr. 2004;79(4):593–599.
- Huang R-C, Mori TA, Burrows S, et al. Sex dimorphism in the relation between early adiposity and cardiometabolic risk in adolescents. J Clin Endocrinol Metab. 2012;97(6):E1014–E22.
- Ambrosini GL, de Klerk NH, O’Sullivan TA, et al. The reliability of a food frequency questionnaire for use among adolescents. Eur J Clin Nutr. 2009;63(10):1251–1259.
- Ambrosini GL, Oddy WH, Robinson M, et al. Adolescent dietary patterns are associated with lifestyle and family psycho-social factors. Public Health Nutr. 2009;12(10):1807–1815.
- Miller SA, Dykes DD, Polesky HF. A simple salting out procedure for extracting DNA from human nucleated cells. Nucleic Acids Res. 1988;16(3):1215.
- Fortin JP, Fertig E, Hansen K. shinyMethyl: interactive quality control of illumina 450k DNA methylation arrays in R. F1000Research. 2014;3(3):175.
- van Iterson M, Tobi EW, Slieker RC, et al. MethylAid: visual and interactive quality control of large illumina 450k datasets. Bioinformatics. 2014;30(23):3435–3437.
- Assenov Y, Muller F, Lutsik P, et al. Comprehensive analysis of DNA methylation data with RnBeads. Nat Methods. 2014;11(11):1138–1140.
- Teschendorff AE, Marabita F, Lechner M, et al. A beta-mixture quantile normalization method for correcting probe design bias in illumina infinium 450 k DNA methylation data. Bioinformatics. 2013;29(2):189–196.
- Houseman EA, Accomando WP, Koestler DC, et al. DNA methylation arrays as surrogate measures of cell mixture distribution. BMC Bioinf. 2012;13(1):86.
- Aryee MJ, Jaffe AE, Corrada-Bravo H, et al. Minfi: a flexible and comprehensive bioconductor package for the analysis of Infinium DNA methylation microarrays. Bioinformatics. 2014;30(10):1363–1369.
- Pedersen BS, Schwartz DA, Yang IV, et al. Comb-p: software for combining, analyzing, grouping and correcting spatially correlated P-values. Bioinformatics. 2012;28(22):2986–2988.
- Peters TJ, Buckley MJ, Statham AL, et al. De novo identification of differentially methylated regions in the human genome. Epigenetics Chromatin. 2015;8(1):6.
- Sidak Z. Rectangular confidence regions for the means of multivariate normal distributions. J Am Stat Assoc. 1967;62(318):626–633.
- Benjamini Y, Hochberg Y. Controlling the false discovery rate: a practical and powerful approach to multiple testing. J. R. Stat. Soc.Ser B (Methodol). 1995;57(1):289–300.
- Phipson B, Maksimovic J, Oshlack A. missMethyl: an R package for analyzing data from illumina’s HumanMethylation450 platform. Bioinformatics. 2016;32(2):286–288.
- Understanding Bland GD. Altman analysis. Biochem Med (Zagreb). 2015;25(2):141–151.
- Houseman EA, Accomando WP, Koestler DC, et al. DNA methylation arrays as surrogate measures of cell mixture distribution. BMC Bioinf. 2012;13:13.
- Pan H, Holbrook JD, Karnani N, et al. Gene, environment and methylation (GEM): a tool suite to efficiently navigate large scale epigenome wide association studies and integrate genotype and interaction between genotype and environment. BMC Bioinf. 2016;17:17.
- Barton SJ, Melton PE, Titcombe P, et al. In epigenomic studies, including cell-type adjustments in regression models can introduce multicollinearity, resulting in apparent reversal of direction of association. Front Genet. 2019;10:816.
- Sakakibara S, Nakamura Y, Satoh H, et al. Rna-binding protein Musashi2: developmentally regulated expression in neural precursor cells and subpopulations of neurons in mammalian CNS. J Neurosci. 2001;21(20):8091–8107.
- Dhana K, Braun KVE, Nano J, et al. An epigenome-wide association study of obesity-related traits. Am J Epidemiol. 2018;187(8):1662–1669.
- Shah S, Bonder MJ, Marioni RE, et al. Improving phenotypic prediction by combining genetic and epigenetic associations. Am J Hum Genet. 2015;97(1):75–85.
- Pan WW, Myers MG. Leptin and the maintenance of elevated body weight. Nat Rev Neurosci. 2018;19(2):95–105.
- Cabral M, Severo M, Barros H, et al. Longitudinal association of adiposity and high-sensitivity C-reactive protein from adolescence into early adulthood. Nutr Metab Cardiovasc Dis. 2019;29(6):590–597.
- Das K, Lewis RY, Combatsiaris TP, et al. Predominant expression of the mitochondrial dicarboxylate carrier in white adipose tissue. Biochem J. 1999;344(2):313–320.
- Mizuarai S, Miki S, Araki H, et al. Identification of dicarboxylate carrier Slc25a10 as malate transporter in de novo fatty acid synthesis. J Biol Chem. 2005;280(37):32434–32441.
- Kulyte A, Ehrlund A, Arner P, et al. Global transcriptome profiling identifies KLF15 and SLC25A10 as modifiers of adipocytes insulin sensitivity in obese women. PLoS One. 2017;12(6):6.
- Kato N, Loh M, Takeuchi F, et al. Trans-ancestry genome-wide association study identifies 12 genetic loci influencing blood pressure and implicates a role for DNA methylation. Nat Genet. 2015;47(11):1282–1293.
- Lafuente EM, van Puijenbroek AA, Krause M, et al. RIAM, an Ena/VASP and profilin ligand, interacts with Rap1-GTP and mediates Rap1-induced adhesion. Dev Cell. 2004;7(4):585–595.
- De Andrade FA, Batistela MS, Amaral SD, et al. Association between RAPH1 gene haplotypes and CHE2 locus phenotypes. Ann Hum Genet. 2016;80(4):203–209.
- Iwasaki T, Yoneda M, Nakajima A, et al. Serum butyrylcholinesterase is strongly associated with adiposity, the serum lipid profile and insulin resistance. Int Med. 2007;46(19):1633–1639.
- Huang TTK, Johnson MS, Figueroa-Colon R, et al. Growth of visceral fat, subcutaneous abdominal fat, and total body fat in children. Obes Res. 2000;8:16S–S.
- Xu HY, Barnes GT, Yang Q, et al. Chronic inflammation in fat plays a crucial role in the development of obesity-related insulin resistance. J Clin Invest. 2003;112(12):1821–1830.