
ABSTRACT
The contribution of DNA-methylation based gene silencing to carcinogenesis is well established. Increasingly, DNA-methylation is examined using genome-wide techniques, with recent public efforts yielding immense data sets of diverse malignancies representing the vast majority of human cancer related disease burden. Whereas mutation events may group preferentially or in high frequency with a given histology, mutations are poor classifiers of tumour type. Here we examine the hypothesis that cancer-specific DNA-methylation reflects the tissue of origin or carcinogenic risk factor, and these methylation abnormalities may be used to faithfully classify tumours according to histology. We present an analysis of 7427 tumours representing 19 human malignancies and 708 normal samples demonstrating that specific tumour changes in methylation can correctly determine site of origin and tumour histology with 86% overall accuracy. Examination of misclassified tumours reveals underlying shared biology as the source of misclassifications, including common cell of origin or risk factors.
Introduction
Widespread changes in DNA methylation, following alterations in the systems that regulate chromatin architecture, are a key component of tumorigenesis. In the classical understanding, DNA methylation in carcinogenesis results in silencing of tumour-suppressor genes by the addition of a methyl group to cytosines in CpG islands of a gene promoter [Citation1]. The potential for using cancer specific changes in DNA methylation for molecular detection is being widely explored [Citation2,Citation3]. CpG dinucleotides exist throughout the genome with varying functional implications and propensity for methylation and demethylation in different cellular states. Additionally, the co-presence of repressive and activation chromatin marks such as histone 3, lysine 27 tri-methylation (H3K27me3) and histone 3, lysine 4 tri-methylation (H3K4me3) in embryonic stem cells [Citation4] predispose loci to methylation/demethylation during the transformation from benign tissue to malignancy [Citation5]. These predisposing marks, so-called bivalency, suggest that many loci which become methylated in cancer may be shared among many tumour types. However, because these predisposing marks diverge during tissue differentiation [Citation6], it might be expected that some cancer-specific promoter methylation would also diverge between different cancers arising from different tissues.
Recent studies have explored the use of genome-wide patterns of DNA methylation for distinguishing cancer from normal, and for characterizing tumour histology [Citation7–14]. For example, the use of DNA methylation differences to distinguishing tumour subtypes within a specific tumour type, such as chronic lymphocytic leukaemia (CLL) [Citation7,Citation8], or to distinguish primary brain tumours from different metastatic tumours [Citation9] has shown the promise of DNA methylation changes. These patterns have also been explored for identifying primary sites for metastases of unknown origin [Citation10], and tissue source sites for cell-free tumour DNA circulating in blood [Citation11]. These studies demonstrate the potential of DNA methylation profiles, but also highlight remaining challenges. For example, CancerLocator, by Kang et al. [Citation11], established proof of principle using simulations driven by DNA methylation levels measured in the blood of cancer patients, but the study was limited by sample availability to a relatively small sample size representing only 4 tumour types. Xia et al [Citation12]. demonstrated that tissue of origin can be detected by training a classifier with a small set of CpG probes, but focused on tissue samples rather than considering that these differences must also distinguish from normal cell methylation, critical for use in early detection. Tang et al. [Citation13], achieve excellent performance using random forest models on 14 tumour types. However, their tumour specific models each use between 9 and 738 CpG sites (colorectal and pancreas, respectively) and the entire classifier uses 5457 distinct CpGs, impractical for many clinical settings. Similarly, Shen et al. [Citation14] developed and validated an assay exploring differences in Differentially Methylated Regions from 15,000 to 95,000 regions to identify methylome changes reflective of cancer from circulating DNA. In addition to designing a small panel of markers with excellent informatic sensitivity and discriminative capacity, no prior study has systematically characterized misclassifications. The traditional, anatomically defined taxonomy of tumours disguises a significantly more complicated, underlying biology, and molecular tumour classifiers can be expected to better reflect the latter. The objective of the current work is to describe a relatively simple panel of markers with low complexity in both assay ability and interpretation for subsequent validation.
The primary goal of this study is to investigate how tumour classification is limited by tumour biology shared across anatomical categories. Secondarily, we consider the size of the classifier, in anticipation of its use in small samples obtained from fluid. To this end, we examined the comprehensive DNA methylation data collected in the Cancer Genome Atlas (TCGA) to uncover frequent DNA methylation changes which could be used for detection in many malignancies, and whether differences in patterns of methylation could be potentially diagnostic and reflect tumour biology.
Results
Universal DNA methylation marks of cancer
Working from the principle that the greatest clinical utility for DNA methylation detection would be in those cancers with the greatest incidence and mortality, we started our analysis with five core human malignancies (core cancers) that together account for a large proportion of cancer cases: lung squamous (LUSC) and non-squamous carcinoma (LUAD), breast (BRCA), colon (COAD), and prostate cancers (PRAD) (marked in grey in Table S1). According to the Surveillance, Epidemiology, and End Results (SEER) Program, these tumours types account for 47% of cancer cases and 46% of deaths (https://seer.cancer.gov/statfacts/html/common.html).
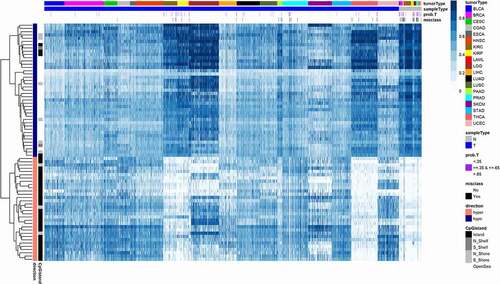
Candidate DNA methylation markers were required to show significant mean difference between tumours and normal in the training data set, and at least 60% of tumours had to exhibit the aberrant pattern of methylation (see Methods for details). We split the core cancer data into training and validation sets, and fit a random forest model on the training partition to predict tumour/normal status using the candidate markers and used the Boruta algorithm for further variable selection. This process yielded 73 CpG probes (32 where tumours were hyper-methylated compared to normals, and 41 where they were hypo-methylated, Table S2) and with these loci the final model achieved 94% sensitivity and 98% specificity on the validation samples. To predict all 19 tumour types, a second random forest model using the same 73 probes, but retrained on a training set of 19 tumour types, afforded 86% sensitivity and 99% specificity on a validation set (). At these levels of performance, applying the classifiers to a screening population with a 1% rate of cancer incidence would yield a positive predictive value (PPV) of 32% for the initial 5 tumour version, and 46% for the full model. This compares favourably to reported PPVs of 25–30% for breast mammography [Citation15].
Figure 1. Universal DNA methylation marks of cancer. A heatmap displays methylation beta values of 73 (32 hyper- and 41 hypo-methylated) probes in the validation set of 19 tumour types. The probes were selected on five core tumours by Boruta algorithm. Dark blue colour on the heatmap corresponds to fully methylated status (beta value = 1); white colour corresponds to unmethylated status (beta value = 0). CpG probes in rows are hierarchically clustered. Samples in columns are clustered by tumour type and by sample type (tumour and normal). Rows (probes) are annotated by direction of methylation comparing to normals (hyper- or hypo-methylated) and by proximity of a probe to CpG island. Columns (samples) are annotated by colour representing histologically confirmed tumour type (tumorType), sample type (tumour/normal), probability to be a tumour sample estimated by random forest model (prob.T), and if a sample was misclassified (misclass). A list of misclassified samples and corresponding probabilities are in Table S2. Tumour type abbreviations can be found in Table S1.
Examining the misclassified samples provided insight into the limitations of this classifier. In addition to the assigned sample class, the random forest provides the votes of individual trees, which serve as a predicted probability or confidence level for the call. For the majority of misclassified samples, the predicted probability of being a tumour was between 0.35 and 0.65 ( and Table S3), meaning that individual trees disagreed on the call. In addition, the distribution of misclassifications differed among the malignancies studied. Most of the tumours misclassified as normal were from cancers with minimal DNA methylation alterations, such as thyroid cancer (THCA) [Citation16] and kidney renal clear cell carcinoma (KIRC) [Citation17] (Table S4). These tumour types might require different loci for detection, given the lower frequency of methylation of the loci directed at most other types of cancer. However, some of the misclassification events were of normal tissues which were called tumours. These misclassifications could represent a challenge for the use of this approach in screening settings where the majority of subjects are cancer free and false positives could outnumber true positives. Two misclassified normal prostate samples had a TCGA notification as ‘Normal tissue contains tumor’ and one misclassified pancreatic cancer sample had a notification ‘this tumor is normal pancreas with atrophy’ (Table S3). Similar findings for other tumour types were encountered. These misclassifications highlight the challenges of using ‘normal’ tissue from regions adjacent to the tumour in TCGA, which may include tumour contamination or field changes where premalignant tissues contain changes found in the tumour. The creation of an accurate classifier will require additional examination of a large set of truly normal samples. However, the differential methylation at these loci, where the majority of normal tissues were correctly classified, suggest that these loci may be used as broad, near universal, cancer detection targets and are not methylated in these tissues normally.
Histology-specific DNA methylation accurately distinguishes between five core malignancies
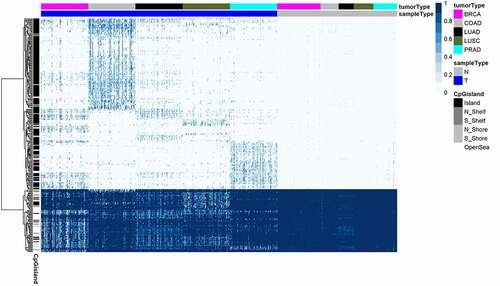
Beyond the potential for general cancer diagnosis, similar approaches have been used to identify loci that distinguish among cancers of different histologies, yielding patterns of DNA methylation with discriminative capacity for segregating tumours according to histology. Most relevant to this study, Tang et al successfully used random forest models to distinguish TCGA tumour types. Their approach of fitting separate random forest models for each tumour type, and combining the results yielded a classifier incorporating more than 5000 individual CpGs, prohibitive for application to liquid biopsy and other settings where low DNA yields are expected. This study differs by considering much smaller panels of markers, and by emphasizing the biological implications of our misclassifications over simple accuracy. Using the training set of 500 samples from five core cancers (a hundred samples from each, we fit a random forest model to classify tumours by type, employing the Boruta feature selection algorithm (see Methods for details), to select 305 probes (, Table S5). Using the remaining samples from these core cancers as a validation set (n = 1844), we tested this model (Table S6). Ninety-two per cent of BRCA, 98% of COAD, 100% of LUAD, 98% of LUSC, and 98% of PRAD samples were correctly classified as the correct histology. Such prediction accuracy suggests that even a small set of CpG probes could be sufficient in prediction tumour histology.
Figure 2. Histology-specific markers for five core tumour types. A heatmap displays methylation beta values of 305 probes resulting from Boruta analysis of 100 tumours from each of 5 core tumour histologies to determine a classifier set of probes, as well as beta values of normal samples corresponding to five core tumours. CpG probes in rows are hierarchically clustered. Samples in columns are clustered by tumour type and by sample type (tumour and normal). The classification results on the validation set of core tumours are shown in Table S6. Annotation colours of rows and columns and the beta value colours are the same as on . See legend for details.
Histology-specific DNA methylation accurately classifies 19 human malignancies
Using the same set of 305 methylation probes derived from five core cancer types, we retrained the random forest model to predict all 19 tumour types. One hundred samples from each of histology were used for training () and the rest of the samples (n = 5527) for validation. The classifier accurately categorized samples according to histology with overall accuracy of 86% in the validation set (), and the prediction accuracy for core tumours was 82% for BRCA, 96% for COAD, 100% for LUAD, 73% for LUSC, and 97% for PRAD. For some core cancers the accuracy dropped significantly, which could be expected since the model is modified to predict multiple tumour types. Surprisingly, for some non-core tumours the predictions were extremely high, e.g., 100% for acute myeloid leukaemia (LAML) and 97% for low-grade glioma (LGG) and 96% skin cutaneous melanoma (SKCM), likely due to the divergence of these malignancies from other histologies. This classifier set, derived from the most highly prevalent human malignancies, had extremely high discriminative capacity on all 19 cancer types.
Figure 3. A 305-probe classifier set derived from five core tumour types used to classify tumours according to histology for 19 human malignancies. A heatmap of methylation beta values for 305 probes (rows) in 1900 samples (columns) from the training set of 19 tumour types. Columns are annotated by colour representing histologically confirmed tumour type. CpG probes in rows are hierarchically clustered. Samples in columns are clustered by tumour type and by sample type (tumour and normal). Annotation colours of rows and columns and the beta value colours are the same as on . See legend for details.
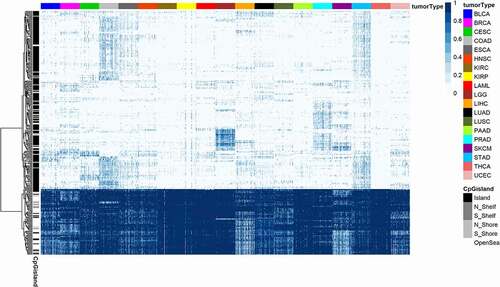
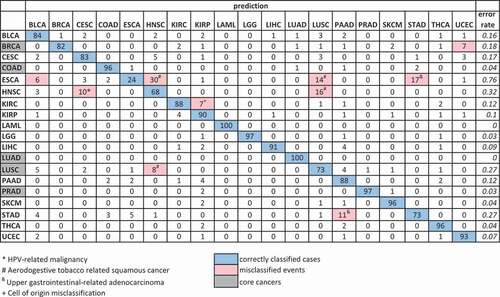
Figure 4. Confusion matrix (in per cent) of the validation set of prediction of 19 cancer types. Confusion matrix of the validation set (n = 5527) of cancer type prediction using 305 Boruta selected probes on five core cancers and applied to predict 19 cancer types. The core cancers are highlighted in grey on the left. The percentage of correctly predicted samples is highlighted in blue; more than 5% of misclassification events are highlighted in pink. True histology is in rows; predicted histology is in columns. The error rate is in italic. Tumour type abbreviations can be found in Table S1.
Histology-specific DNA methylation classification for 19 human malignancies has similar accuracy when classifier derived from heterogeneous cancer types
To study the robustness of the classifier to the initial choice of core cancers, we selected an alternative set of five core cancers (marked in blue in Table S1) to derive a discriminating model. This time we used samples from bladder urothelial carcinoma (BLCA), cervical squamous cell carcinoma and endocervical adenocarcinoma (CESC), kidney renal clear cell carcinoma (KIRC), pancreatic adenocarcinoma (PAAD), and skin cutaneous melanoma (SKCM). We repeated the procedure of selecting probes on a training set of 500 samples using the Boruta algorithm, which resulted with 268 probes. We then trained the Random Forest classifier using these probes and a training set of 1900 samples from all 19 cancer types. The overall accuracy of this classifier on the validation set was very similar to the accuracy of the classifier from the original core cancers (87%) (Table S7). Both the core and alternative classifiers included adenocarcinomas and squamous tumours, and for the alternative, more diverse types (melanoma), and the error rate was highest in misclassifying the location of squamous tumours. Therefore, we tested whether a model built using a homogeneous set of samples would provide a comparable accuracy. For this exercise, we used only squamous cell carcinoma (SCC) samples reported in Campbell et al. [Citation18], which included 522 HNSC, 489 LUSC, 95 ESCA, 256 CESC, and 47 BLCA. Given the limited number of BLCA samples, we created a training set of 235 SCC samples (47 samples of each of five SCC cancers), on which the Boruta algorithm selected only 50 CpG probes. A Random Forest model on these probes and the 235 training set samples gave an error rate of 0.29 (Table S8), which demonstrated a challenge of distinguishing a tumour type in cancers of the same histology. Then, we trained the Random Forest classifier using these 50 probes and a training set of 1900 samples from all 19 cancer types. The overall accuracy of this classifier on the validation set dropped to 75% (Table S9). This result demonstrated the importance of selection of a heterogeneous set of core tumours to create a classifier with high discriminative capacity in prediction of cancer histology.
In summary, these results confirmed the high discriminative capacity of DNA methylation in prediction of cancer histology, when the classifier derived from heterogeneous cancer types. And in the case of a diverse set of cancer types to build the classifier, prediction accuracy was not significantly different. With the differing tumours used to build the model, the classifier set contained a manageable number of CpG loci/probes.
Analysis of misclassification events reveals the biologic basis of informatically derived methylation classifiers
The comparison of the results from prediction of cancer histologies using two sets of probes derived from two heterogenous core cancer sets produced very similar accuracy across histologies ( and Table S1). Three cancer types that were the least accurately predicted by both classifier sets were oesophageal carcinoma (ESCA) (24% and 29%), HNSC (68% and 74%), and stomach adenocarcinoma (STAD) (73% and 69%). This observation led us to examine the reasons for misclassification events. We focused on cancer types with misclassified tumours from the classifier set from the original core cancers that had more than 5% of misclassified events (marked in red in ). There were only six such cancer types: BRCA, ESCA, HNSC, KIRC, LUSC, and STAD. First of all, we looked at the second prediction of the misclassified samples, and a half of these cancer types had the correct second prediction for more than a half of misclassified samples (Table S10).
The cell of origin played an important role in misclassification events. Squamous cell carcinomas of the head, neck and lung have a common aetiology and it is not surprising that they are difficult to distinguish, as we demonstrated above. Sixteen per cent of HNSC tumours were classified as LUSC and, conversely, 8% of LUSC tumours were classified as HNSC (). These tumours share the same squamous cell origin and are both highly associated with smoking. HPV status was an important factor as well; the majority of HNSC that were classified as LUSC were HPV- (Table S11), while the HNSC tumours which were classified as HPV-related CESC, were predominantly HPV+ (Table S11). Although these samples were misclassified with respect to anatomical site, the model is capturing a shared epigenetic pattern of HPV associated malignancies, a distinct methylation signature for HPV status that was shared with cervical cancer ([Citation19], supplemental figure 1.3).
In the same fashion, a careful examination of results for oesophageal cancer, our most frequently misclassified tumour type, exposes the limitations of a clinical classification system that may apply different names to biologically identical and anatomically adjacent GI tumours. Because the TCGA ESCA study includes both squamous cell carcinomas and adenocarcinomas, misclassified oesophageal samples grouped with stomach adenocarcinoma (17%) and others with squamous cell carcinomas of the upper aerodigestive tract (14% as lung and 30% as head and neck) as could be predicted by the overlapping biology and location of these tumours ( and Table S12). Notably, there were no misclassifications of ESCA as LUAD. However, 6% of ESCA was classified as Bladder Urothelial Carcinoma (BLCA), which includes squamous differentiation, and indeed 7% of BLCA was misclassified as other squamous cell cancers (3% as LUSC, 2% as HNSC, and 2% as CESC, Table 1). The other studies of the TCGA network demonstrated common patterns across tumours with squamous cell origin using different data modalities, such as the exome sequences and copy number in Campbell et al. [Citation20], ATAC-seq in Corces et al. [Citation21], and in the multiplatform PanCancer Atlas study of squamous carcinomas using all available data types [Citation18].
Similarly, other tissue of origin characteristics also had an impact in misclassification. Seven per cent of KIRC was misclassified as the kidney papillary carcinoma (KIRP), and symmetrically, 4% of KIRP was classified as KIRC and may reflect a common origin with differentiation ambiguity, or the possibility of some mixed histologies in renal tumours [Citation22]. In the TCGA study of 33 tumour types, Hoadley et al. demonstrated the influence of cell of origin in integrated molecular clustering, and especially, in DNA-methylation-based clustering [Citation23] to support underlying biology of our misclassification events.
Of 27% misclassified STAD samples, 19% are misclassified as another gastrointestinal adenocarcinoma (11% PAAD, 5% ESCA, and 3% COAD). As mentioned above, the oesophageal misclassification likely reflects the challenging problem for pathologists in determining the origin of tumours that arise at the gastroesophageal junction. In addition, since oesophageal tumours often arise from Barrett’s oesophagus, a metaplastic transformation of squamous epithelial to colonic differentiation, the misclassification of stomach and oesophageal adenocarcinoma as colorectal carcinoma likely reflects this transformation.
Another cancer with a relatively high error rate was BRCA, where 18% were misclassified. In this case, misclassified breast tumours were distributed across several tumour types (bladder, kidney, lung, skin, uterus). We found that misclassified BRCA were predominantly basal subtype (84% of misclassified breast tumours (Table S13)) according to PAM50 classification, despite this tumour type representing only 19% of the breast tumours analysed. This poorly differentiated subtype forms a distinct DNA methylation subtype [Citation24], which is closest to normal breast tissue and lacks the DNA methylation changes common to other subtypes of breast cancer. Since basal tumours are a minority of breast cancer, DNA methylation loci which distinguish most breast cancers from other tumour types would therefore not be optimal for diagnosing basal tumours.
A deeper analysis of misclassified samples revealed the common biology underlying distinct cancer types, as well as the unique development of each histology. This analysis let us consider those misclassification events as not really misclassification, but rather evidence of common biology, and we could claim that overall accuracy of our classifier was higher.
Discussion
Recent advances have made the liquid biopsy a very real possibility. Cell-free tumour DNA, shed into the bloodstream, can be sampled with minimal invasion, and used to identify disease and monitor progress. The fundamental principles are well established but various practical issues remain unresolved. Mutations in oncogenes and tumour suppressors like p53 and KRAS are a hallmark of cancer, and make excellent markers for monitoring progress in patients with known abnormalities, but are of limited use in diagnostic settings where even the most common mutations are present in a minority of tumours.
DNA methylation markers have the potential to overcome some of the limitations of mutation markers. The most common cancer-related changes in DNA methylation, such as hypermethylation of CpGs in the promoters of polycomb marked genes, are very common and can be identified in a majority of tumours. Moreover, epigenetic marks are a crucial determinant of phenotype in cells that stably differ in terms of function, and gene expression, despite retaining the same genetic material. So epigenetic changes may be particularly useful for identifying histology from profiles of tumour DNA.
Our purpose in this manuscript was to build on an existing body of work demonstrating the potential of DNA methylation markers for first identifying cancer and then inferring its location. We identified a relatively small number of loci for which a panel for molecular detection could be developed. A targeted panel could be used for selective methylation detection, either through specific detection of altered DNA patterns (MSP (methylation-specific PCR) [Citation25], DREAMing (Discrimination of Rare EpiAlleles by Melt) [Citation26]), but each of these approaches might require too many individual assays to be practical with current technology. However, limiting DNA methylation detection to a small number of loci could allow the depth of sequencing required to detect the rare ctDNA molecules present in the blood stream which is not possible with an untargeted approach.
However, a panel that detects universal cancer-specific methylation creates a new challenge, which is the identification of the site of the tumour releasing the detectable change. Using a separate discovery approach, we further defined a panel of loci where methylation differences could distinguish among tumours from different histologies and organ sites. These are not the tissue-specific events discussed above, as those markers would not necessarily come from transformed cells in the site of the cancer, but could come from the normal tissues as well. This is the limitation of many protein markers that have been examined for cancer detection, such as prostate-specific antigen (PSA), carcinoembryonic antigen (CEA), cancer antigen 125 (CA125) [Citation27]. Each of these protein biomarkers are elevated in some cancer patients due to increased expression or secretion of the normally expressed protein, and though cut-offs are established for the normal levels detectable in the blood, this quantitative compromise limits the earliest detection of cancer in some cases, and complicates the interpretation of some normal conditions where levels are elevated (for example with PSA).
Unlike mutational events, DNA-methylation abnormalities occur routinely and predictably in the transition from normal to malignant tissues. In addition to hypermethylation events that are sentinel of malignant transformation, other CpG dinucleotides undergo high-frequency methylation in a histology specific manner. These differences are partially explained by their association with polycomb marks, which denote loci with high propensity for hypermethylation during malignant transition, and the histologic tumours of origin among 19 human malignancies have shared and unique polycomb loci. The misclassification rate of the tumour type biomarkers was low, but those informative. Interestingly, specificity of methylation appears related to the risk factor for carcinogenesis as shown by the number of HPV-related head and neck cancers misclassified as cervical cancer and smoking-related head and neck cancers misclassified as lung squamous cancers. In the latter case, both common exposure and shared biology, as both are squamous tumours arising in tissues with direct smoke exposure. DNA-methylation changes have been studied as biomarkers in cancer for diagnosis, prognosis, and response to therapy. Here, we present a novel analysis of methylation changes in cancer which emphasizes unique characteristics for categorization when compared to other molecular abnormalities that occur in carcinogenesis and which form the basis of effective early detection strategies.
Methods
Data analysis was performed using R/Bioconductor software [Citation28,Citation29] with custom routines as well as standard packages. Heat maps were created using the pheatmap R package (v 1.0.12) [Citation30].
TCGA data
TCGA DNA methylation was measured on the Illumina HumanMethlation 450 K platform [Citation31]. Level 3 DNA methylation data and corresponding clinical information were downloaded from TCGA GDC Data Portal using the TCGABiolinks R package [Citation32]. We downloaded data for 19 tumour types, which are not rare and have the number of tumour samples more than a hundred (Table S1). HPV data for HNSC were accessed from Nulton et al. [Citation33] TCGA notifications were downloaded from Broad Institute Firehose data portal [Citation34]. In the primary analyses, we follow the TCGAs designation of tumour type, as well as tumour vs normal, as coded in the sample ID. Thus, in some cases (e.g., lung and kidney) anatomical categories are further divided by histology, while in others, (e.g., oesophageal and bladder) histologically distinct samples are grouped under the same anatomical heading. An exception to this rule occurred where we trained a classifier using only squamous cell carcinoma samples. In that instance, we selected individual squamous tumours as determined by Campbell et al. [Citation18]
Universal DNA methylation marks of disease
To find tumour-specific DNA methylation marks, we computed hyper- and hypo-methylation frequencies for CpG probes in core cancers. A tumour sample was called DNA hypermethylated if the β-value of the probe was greater than two times the standard deviation of the mean of β-values of adjacent normal tissue samples. Symmetrically, a tumour sample was called DNA hypomethylated if the β-value of the probe was less than two times the standard deviation of the mean of β-values of adjacent normal tissue samples. After that, we selected probes that have frequency more than 0.6 in all core cancers. We found 708 probes (343 hyper-methylated and 365 hypo-methylated probes). Then we applied a feature selection algorithm implemented in the Boruta package [Citation35], which is the Random Forest classifier based algorithm, to reduce the number of probes. The Boruta algorithm selected 73 important probes (32 hyper- and 41 hypo-methylated probes, Table S2). Using these 73 probes, we created a Random Forest classifier, implemented in the randomForest package [Citation36] on a training set of 100 tumours of each type and a half of adjacent normal samples from core tumours. Then we applied the classifier to the rest of the core tumour samples. We also created a random forest classifier using 73 probes and a training set of 100 tumours of each type and a half of adjacent normal samples from all 19 tumour types and applied the classifier to the rest of the tumour samples.
Histology-specific DNA methylation accurately distinguishes between five core malignancies
To find histology-specific DNA methylation marks, we used again a feature selection algorithm implemented in the Boruta package [Citation35]. First, we restricted the probe set using two following criteria: a probe should be (i) the least variable across all normal samples (within the 1st quartile) and (ii) within the top 5th percentile of the most variable probes in any of five core cancers. Boruta was applied to that probe set and 500 randomly chosen tumour samples (the training set), a hundred samples from each cancer type. The algorithm selected 305 out of 2598 with the capacity to accurately classify five core cancer types (Table S5). Then, we created a Random Forest classifier, implemented in the randomForest package [Citation36], using these 305 probes and the training set of 100 tumours of each type and applied the classifier to the validation set samples (the rest of the core cancer samples not included in the training set).
Histology-specific DNA methylation accurately classifies 19 human malignancies
We randomly chose a hundred samples from 19 cancer types for a training set and used the remaining samples as a validation set. Using the probe set derived on the core cancers (n = 305), we created a Random Forest classifier on the training set and predicted tissue type in the validation set.
Supplemental Material
Download MS Excel (56.6 KB)Disclosure statement
The authors report no conflict of interest.
Supplementary material
Supplemental data for this article can be accessed here.
Additional information
Funding
Related Research Data
References
- Herman JG, Baylin SB. Gene silencing in cancer in association with promoter hypermethylation. N Engl J Med. 2003;349:2042–2054.
- Hulbert A, Jusue-Torres I, Stark A, et al. Early detection of lung cancer using DNA promoter hypermethylation in plasma and sputum. Clin Cancer Res Off J Am Assoc Cancer Res. 2017;23:1998–2005.
- Laird PW. The power and the promise of DNA methylation markers. Nat Rev Cancer. 2003;3:253–266.
- Bernstein BE, Mikkelsen TS, Xie X, et al. A bivalent chromatin structure marks key developmental genes in embryonic stem cells. Cell. 2006;125:315–326.
- Ohm JE, McGarvey KM, Yu X, et al. A stem cell-like chromatin pattern may predispose tumor suppressor genes to DNA hypermethylation and heritable silencing. Nat Genet. 2007;39:237–242.
- Jadhav U, Nalapareddy K, Saxena M, et al. Acquired tissue-specific promoter bivalency is a basis for PRC2 necessity in adult cells. Cell. 2016;165:1389–1400.
- Queirós AC, Villamor N, Clot G, et al. A B-cell epigenetic signature defines three biologic subgroups of chronic lymphocytic leukemia with clinical impact. Leukemia. 2015;29:598–605.
- Giacopelli B, Zhao Q, Ruppert AS, et al. Developmental subtypes assessed by DNA methylation-iPLEX forecast the natural history of chronic lymphocytic leukemia. Blood. 2019;134:688–698.
- Orozco JIJ, Knijnenburg TA, Manughian-Peter AO, et al. Epigenetic profiling for the molecular classification of metastatic brain tumors. Nat Commun. 2018;9:4627.
- Hao X, Luo H, Krawczyk M, et al. DNA methylation markers for diagnosis and prognosis of common cancers. Proc Natl Acad Sci. 2017;114:7414–7419.
- Kang S, Li Q, Chen Q, et al. CancerLocator: non-invasive cancer diagnosis and tissue-of-origin prediction using methylation profiles of cell-free DNA. Genome Biol. 2017;18:53.
- Xia D, Leon AJ, Cabanero M, et al. Minimalist approaches to cancer tissue-of-origin classification by DNA methylation. Mod Pathol. 2020;33:1874–1888.
- Tang W, Wan S, Yang Z, et al. Tumor origin detection with tissue-specific miRNA and DNA methylation markers. Bioinformatics. 2018;34:398–406.
- Shen SY, Singhania R, Fehringer G, et al. Sensitive tumour detection and classification using plasma cell-free DNA methylomes. Nature. 2018;563:579–583.
- Halladay JR, Yankaskas BC, Bowling JM, et al. Positive predictive value of mammography: comparison of interpretations of screening and diagnostic images by the same radiologist and by different radiologists. AJR Am J Roentgenol. 2010;195:782–785.
- Agrawal N, Akbani R, Aksoy B. Cancer genome atlas research network, integrated genomic characterization of papillary thyroid carcinoma. Cell. 2014;159:676–690.
- The Cancer Genome Atlas Research Network. Comprehensive molecular characterization of clear cell renal cell carcinoma. Nature. 2013;499:43–49.
- Campbell JD, Yau C, Bowlby R, et al. Genomic, pathway network, and immunologic features distinguishing squamous carcinomas. Cell Rep. 2018;23:194–212.e6.
- Cancer Genome Atlas Network. Comprehensive genomic characterization of head and neck squamous cell carcinomas. Nature. 2015;517:576–582.
- Campbell JD, Alexandrov A, Kim J, et al. Distinct patterns of somatic genome alterations in lung adenocarcinomas and squamous cell carcinomas. Nat Genet. 2016;48:607–616.
- Corces MR, Granja JM, Shams S, et al. The chromatin accessibility landscape of primary human cancers. Science. 2018;362:eaav1898.
- Ross H, Martignoni G, Argani P. Renal cell carcinoma with clear cell and papillary features. Arch Pathol Lab Med. 2012;136:391–399.
- Hoadley KA, Yau C, Hinoue T, et al. Cell-of-origin patterns dominate the molecular classification of 10,000 tumors from 33 types of cancer. Cell. 2018;173:291–304.e6.
- Cancer Genome Atlas Network. Comprehensive molecular portraits of human breast tumours. Nature. 2012;490:61–70.
- Herman JG, Graff JR, Myöhänen S, et al. Methylation-specific PCR: a novel PCR assay for methylation status of CpG islands. Proc Natl Acad Sci U S A. 1996;93:9821–9826.
- Pisanic TR, Athamanolap P, Poh W, et al. DREAMing: a simple and ultrasensitive method for assessing intratumor epigenetic heterogeneity directly from liquid biopsies. Nucleic Acids Res. 2015;43:e154.
- Scholler N, Urban N. CA125 in ovarian cancer. Biomark Med. 2007;1:513–523.
- R: a language and environment for statistical computing; n.d.
- Gentleman RC, Carey VJ, Bates DM, et al. Bioconductor: open software development for computational biology and bioinformatics. Genome Biol. 2004;5:R80.
- pheatmap: pretty heatmaps version 1.0.12 from CRAN; n.d.
- Bibikova M, Barnes B, Tsan C, et al. High density DNA methylation array with single CpG site resolution. Genomics. 2011;98:288–295.
- Colaprico A, Silva TC, Olsen C, et al. TCGAbiolinks: an R/Bioconductor package for integrative analysis of TCGA data. Nucleic Acids Res. 2016;44:e71–e71.
- Nulton TJ, Olex AL, Dozmorov M, et al. Analysis of the cancer genome atlas sequencing data reveals novel properties of the human papillomavirus 16 genome in head and neck squamous cell carcinoma. Oncotarget. 2017;8:17684–17699.
- n.d. Available from: http://gdac.broadinstitute.org/runs/stddata__2016_01_28/samples_report/Notifications.html
- Kursa MB, Rudnicki WR. Feature selection with the boruta package. J Stat Softw. 2010;36:1–13.
- Wiener M, Wiener M. Classification and regression by random forest. J Exp Ther Oncol. 2002;2:5.