
ABSTRACT
Methylation signatures in cell-free DNA (cfDNA) have shown great sensitivity and specificity in the characterization of tumour status and classification of tumour types, as well as the response to therapy and recurrence. Currently, most cfDNA methylation studies are based on bisulphite conversion, especially targeted bisulphite sequencing, while enrichment-based methods such as cfMeDIP-seq are beginning to show potential. Here, we report an enrichment-based ultra-low input cfDNA methylation profiling method using methyl-CpG binding proteins capture, termed cfMBD-seq. We optimized the conditions for cfMBD capture by adjusting the amount of MethylCap protein along with using methylated filler DNA. Our data show high correlation between low input cfMBD-seq and standard MBD-seq (>1000 ng input). When compared to cfMEDIP-seq, cfMBD-seq demonstrates higher sequencing data quality with more sequenced reads passed filter and less duplicate rate. cfMBD-seq also outperforms cfMeDIP-seq in the enrichment of CpG islands. This new bisulphite-free ultra-low input methylation profiling technology has great potential in non-invasive and cost-effective cancer detection and classification.
Introduction
Liquid biopsies are the analyses of circulating components in blood or other body fluids. This technology is rapidly becoming prominent for cancer detection and management due to three overarching advantages. First, the collection of blood is minimally invasive. Second, the short half-life of circulating nucleic acids in the blood allows liquid biopsies to be a real-time and dynamic monitoring tool for tumour burden estimation. Third, since circulating nucleic acids originate from different tissues, liquid biopsies may capture a whole picture of a patient’s malignancy and solve the problem of tumour heterogeneity [Citation1–3]. Currently, circulating cell-free DNA (cfDNA) has been widely applied to the detection of cancer-associated hotspot mutations. However, these genetic mutations can only be detected in a subset of patients at advanced stages. Also, given the limited number of recurrent mutations available for discriminating tumour-derived cfDNA from normal cfDNA in early-stage cancer, the sensitivity of these mutation-based detections is relatively low [Citation4,Citation5]. By contrast, aberrant DNA methylation occurs early during tumorigenesis and is abundantly present in the entire cancer process [Citation6]. Moreover, the DNA methylation profile is highly tissue-specific and consistent in a certain tissue types among different individuals [Citation7]. Detection of tumour-specific cfDNA methylation signatures is believed to be a more robust and sensitive approach for cancer detection [Citation8,Citation9].
DNA methylation is a common epigenetic modification that occurs most frequently in cytosine residues in the sequence context of CpG [Citation10]. Generally, the majority of all CpGs are methylated in mammalian genomes, except short unmethylated CpG-rich regions called CpG islands [Citation11]. In comparison, the cancer genome is characterized by DNA methylation alteration with global hypomethylation and CpG islands-specific hypermethylation, resulting in genomic instability and gene silencing, respectively [Citation12]. CpG islands occur at the transcription start sites of approximately 60% human gene promoters. Hypermethylation of CpG island promoters can affect the cell cycle, DNA repair, the metabolism of carcinogens, cell-to-cell interaction, apoptosis, and angiogenesis, all of which are involved in tumorigenesis and cancer development [Citation13]. CpG island hypermethylation of different genes has been identified in different types of cancers [Citation12]. Thus, methylation signatures from CpG islands have great potential in the detection and management of cancer [Citation14].
Currently, the majority of cfDNA methylation profiling technologies are based on chemical treatment of the DNA with bisulphite [Citation15]. Whole-genome bisulphite sequencing (WGBS) of cfDNA has been attempted, but this approach is not feasible for most patient-based studies because of its high cost and limited information recovery owing to the low genome-wide abundance of CpGs [Citation16,Citation17]. Targeted bisulphite sequencing of cfDNA has also been developed and high accuracy diagnostic prediction models of hepatocellular carcinoma and colorectal cancer have been established from a large cohort of patients and normal controls [Citation18,Citation19]. However, the target methylation markers of these studies were selected from Infinium HumanMethylation450 BeadChip (HM450K) data. This methylation array is known to have selection bias and poor genome-wide coverage of all methylation sites (2%), which may miss important target sites [Citation20]. Similarly, the applications of quantitative and droplet digital methylation-specific PCRs are limited to predefined genomic regions and restricted by their low throughput nature. Alternatively, enrichment-based methylation profiling methods have shown a similar sensitivity and specificity when compared to bisulphite conversion-based methods [Citation21]. Methylated DNA can be captured by methyl-CpG binding proteins (MBD) or anti-5mC antibodies (MeDIP) that have a high affinity towards methylated CpGs. One critical limitation of such methods for liquid biopsies is that a relatively large amount of input DNA (ideally >1000 ng) is required while the yield of cfDNA is typically low (2 ~ 10 ng/ml plasma). To address this issue, a recent study optimized the MeDIP-seq protocol to allow methylome analysis of small quantities (1–10 ng) of cfDNA, termed cfMeDIP-seq [Citation22–24]. This technology has been applied to identify differentially methylated regions (DMRs) in a wide variety of cancer patients and has shown very promising results [Citation24]. Recent studies have also shown accurate classification of patients across all stages of renal cell carcinoma using plasma cfDNA [Citation25,Citation26].
Intrigued by the low-input improvements in cfMeDIP-seq, we optimized MBD-seq [Citation27] to enable as little as 1 ng cfDNA input and termed this ultra-low input protocol cfMBD-seq. We optimized the MBD capture by adjusting the amount of MethylCap protein used in addition to the use of methylated filler DNA to maintain site-specific binding. Our data show a robust genome-wide inter-replicate Pearson correlation between cfMBD-seq and standard MBD-seq (>1000 ng input) even when the input DNA is as low as 1 ng. Compared to cfMeDIP-seq, cfMBD-seq demonstrates higher sequencing data quality with more sequenced reads passed filter and less duplicate rate. Moreover, cfMBD-seq outperforms cfMeDIP-seq in terms of enrichment of CpG islands. Genome browser visualization shows that cfMBD-seq also recapitulates methylation signals from other methylation profiling technologies. This new bisulphite-free ultra-low input methylation profiling technology has a promising future in non-invasive and cost-effective cancer detection and classification.
Result
Characterization of cfMBD-seq technology
The standard protocol for methylation enrichment requires a minimum of 1000 ng DNA as input. Since the yield of cfDNA is extremely low at 2–10 ng per ml plasma, the current protocol is not suitable for cfDNA methylation analysis. To ensure amplification of methylation-enriched cfDNA, we added sequencing adapters to cfDNA by end repair/A-tailing and ligation before methylation enrichment and library amplification. This pre-enrichment adapter ligation preserves the methylation status of cfDNA because newly synthesized DNA are not methylated. To meet the high input requirement for methylation enrichment, we added exogenous Enterobacteria phage λ DNA (filler DNA) to the adapter-ligated cfDNA to increase the final DNA input to 100 ng. The filler DNA ensures a constant MethylCap protein/DNA ratio and helps maintain a similar methylation enrichment efficiency across different samples with different cfDNA yields while minimizing non-specific binding and DNA loss. Since filler DNA is not amplified during library amplification and is not aligned with the human genome, it will not interfere with the analysis of sequencing data. Unlike genome-wide sequencing, cfMBD-seq captures only a fraction of the genome (methylated DNA) and thus allows adequate sequencing coverage with fewer total reads. Therefore, it enables pooling of multiple uniquely indexed samples for a single run while retaining high sensitivity. This makes cfMBD-seq a cost-effective method for methylome-wide association analysis in a large-scale study (for details, see Methods and Figure S1a).
Reduced MethylCap protein improves methylation enrichment
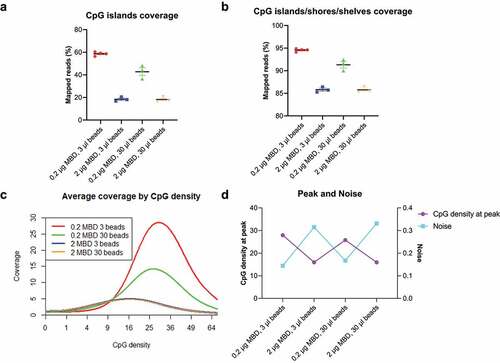
Based on the use of filler DNA, we performed extensive benchmarking to identify an optimal methylation enrichment condition. One of the key adaptations for this purpose is to determine the appropriate amount of MethylCap protein to bind the input DNA mixture. If the amount of protein is too high, non-specific binding will occur due to extra binding sites on the protein. If too low, a portion of methylated fragments will not be captured. We thus tested across different ratios of MethylCap protein and magnetic beads to input DNA. When MethylCap protein/DNA ratio is kept the same as recommended by the manufacturer, where 2 μg MethylCap protein is used for 1 μg DNA (2:1 ratio), the captured CpG islands reached up to 58.65% of all mapped reads ()). Since methylation differences sometimes occur at a short distance away from the CpG islands [Citation28], we also calculated the sum of captured reads from CpG islands/shores/shelves regions. Under the recommended ratio, 94.56% of reads fell into the extended regions while these regions only account for 6.72% of the entire genome (), S1b). We then plotted the genome-wide coverage (average number of fragments covering CpGs) against CpG density (number of CpGs per fragment). The curve shows that the coverage is relatively low in CpG-poor regions and ultra-dense regions, while peaks in regions have moderate CpG density. As the peak represents CpG-rich regions such as CpG islands, the higher coverage at the peak indicates the better methylation enrichment ()). To better characterize these distributions, we termed the CpG density at the point of the highest coverage as ‘peak’. We also used the term ‘noise’ to illustrate the ratio of average non-CpG coverage to average CpG coverage. Consistently, the 2:1 ratio gives the highest peak and the lowest noise ()). Unlike the MethylCap protein, the volume of magnetic beads had less impact on the performance of methylation enrichment. Given that redundant beads may increase the risk of nonspecific binding, we determined the best enrichment conditions as 0.2 μg protein and 3 μl beads with a total input DNA of 100 ng.
Figure 1. Reduced MethylCap protein improves low-input methylation enrichment.
Methylated filler DNA is needed to increase enrichment efficiency and reduce background noise
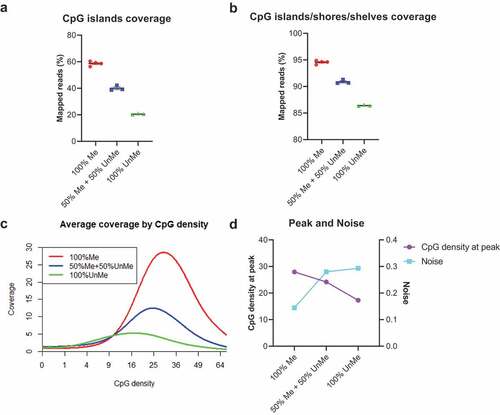
In MBD-based enrichment, the typical yields of methylated DNA are 3–20% of the input DNA mass. Since cfDNA only accounts for a small fraction (<10%) in the mixture of cfDNA and filler DNA, the methylated fragments in cfDNA may not be able to fill all binding sites in the MethylCap protein. If the filler DNA is not methylated, the risk of unspecific binding is increased. To test the potential impact of filler DNA methylation status on enrichment efficiency, we treated the filler DNA with CpG methyltransferase and used the mixture of the treated and untreated filler DNA as input. When filler DNA is methylated, we observe preferential enrichment in both the CpG islands and CpG islands/shores/shelves regions. The coverages of enriched target regions decreased with reduced methylation level of filler DNA ()). For example, CpG islands coverage was 58.65%, 40.05%, and 20.53% when methylation level of filler DNA was 100%, 50%, and 0%, respectively. The extended regions show the same trend. The coverage by CpG density plot ()) and peak/noise trend plot ()) further confirmed the importance of methylated filler DNA. Since the methylated filler DNA can block the extra binding sites on the protein, it is not difficult to explain why the specificity of the reaction was enhanced.
Figure 2. Methylated filler DNA is needed to compensate for low-input methylation enrichment.
Library yield and spike-in control are used for pre-sequencing quality controls
We empirically find that the library yield for different conditions is different and hypothesize that a non-specific capture will increase the final library yield. To test this, we examined the final library concentration and the quality of methylation enrichment. We find that optimal condition tended to have a lower library concentration while suboptimal conditions generate more final library DNA under the same amplification cycles (Figure S2a, S2b). Besides library concentration, real-time PCR (qPCR) often provides a more accurate pre-sequencing quality control. Since cfDNA is highly fragmented, the use of large amplicon (such as 170 bp of methylated control TSH2B) is not recommended. In fact, it is very hard to detect unmethylated control GAPDH in a successful enrichment due to low input. Therefore, instead of the TSH2B and GAPDH control pair, we used A. thaliana DNA as spike-in control to estimate the enrichment efficiency. We observed a significant enrichment of methylated DNAs when compared spike-in controls before and after capture reaction. Under the optimal condition, the specificity of capturing methylated control DNA was ≥99%, with the recovery rate of spiked-in methylated control should be ~50%-90% and the recovery of spiked-in unmethylated control should be <1% (Figure S2c, S2d).
1 ng input achieved high-quality results similar to 1000 ng input DNA
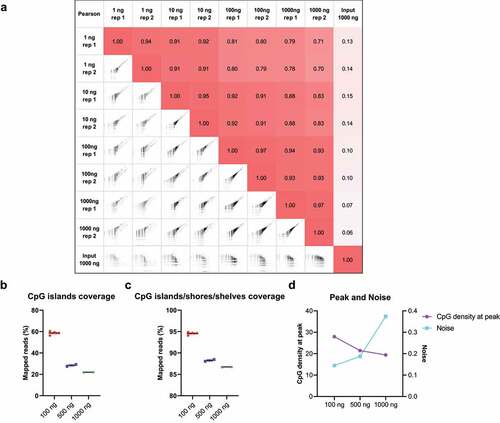
To compare the low-input cfMBD-seq with standard MBD-seq (>1000 ng input), we sheared colorectal cancer HCT116 DNA into small fragments with a peak of ~167 bp to mimic cfDNA and tested different DNA inputs for methylation enrichment (1, 10, 100, and 1000 ng). For 1 ng and 10 ng DNA, we used methylated filler DNA to increase the final DNA input to 100 ng. For 1000 ng input, standard MBD-seq was used for library preparation. The results show robust genome-wide inter-replicate Pearson correlation ()). More importantly, saturation analysis showed a high saturation correlation of 0.91 with only 1 ng DNA as input (Figure S3), indicating that the methylome profile from 1 ng DNA is sufficient to generate a saturated and reproducible coverage profile of the reference genome. The saturation correlation of 3 ng cfDNA input is consistent with low genomic DNA (gDNA) input (Figure S3). Together, these results suggest cfMBD-seq can generate high-quality methylome profiles similar to standard MBD-seq while allowing ultra-low DNA input. As the 1000 ng input has a high genome-wide inter-replicate correlation, we further investigated if increased amount of filler DNA can enhance the performance of the reaction. We thus increased the DNA input by adding more filler DNA, with the quantity of cfDNA unchanged (in total 100, 500, and 1000 ng). However, we did not observe an improved methylation enrichment even when the amounts of MethylCap protein and beads were adjusted accordingly. The higher filler DNA reduced the performance of target region enrichment ()) and increased background noise ()), suggesting that the increased amount of methylated filler DNA overshadowed the trace amount of methylated cfDNA. Thus, we determined 100 ng as an optimized DNA input, due to the robust recovery of high CpG density regions with low noise.
Figure 3. Different input DNA amounts in cfMBD-seq.
Additional wash and elution buffers did not significantly affect methylation enrichment
Given the confirmed MethylCap protein-to-DNA ratio and amount of methylated filler DNA, we evaluated other experimental conditions to see if methylation enrichment can be further improved. First, we examined the effect of a more stringent washing condition on non-specific binding. Compared to single wash, the double wash did not significantly increase coverage of CpG islands. The additional wash also did not decrease the coverage of the open sea regions, where non-specific bindings are most likely to occur (Figure S4a). Likewise, there was no significant difference in noise between the standard wash and double wash (Figure S4b). Second, we examined the effect of the elution buffer salt concentration on methylation enrichment. We performed single fraction elution for three different elution buffers provided in the MethylCap kit. Theoretically, an increased salt concentration may preferentially enrich regions with a higher CpG density [Citation29]. However, we did not observe a notable shift in the coverage by density plot nor coverage difference in each CpG annotations (Figure S5a-c). For example, the coverage signals at the CpG island MGAT3 showed no difference among three elution buffers (Figure S5d). The finding that MethylCap protein (MeCP2) is not sensitive to the salt concentration of elution buffer is consistent with previous findings [Citation30,Citation31]. We also tested multiple fractions elution, that is, sequential elution with low, medium, and high salt elution buffer from one capture reaction. The coverage by density plots illustrated robust methylation enrichment in both the first fraction (low salt) and the pool of three fractions (Figure S5e). However, the second fraction (medium salt), the third fraction (high salt), and the pool of both fractions had very low coverage due to the intrinsic limitation of low input (Figure S5e). In summary, our results suggest an optimal condition for low input MBD methylation enrichment includes 0.2 μg MethylCap protein and 3 μl beads for 100 ng DNA mixture (cfDNA + methylated filler DNA), standard wash, and single fraction elution.
Comparison of cfMBD-seq with other technologies
To evaluate the methylation capture accuracy of cfMBD-seq, we calculated its sensitivity (proportion of methylated CpG islands detected) and specificity (proportion of non-methylated CpG islands detected). We used Infinium HM450K data (Gene Expression Omnibus (GEO): GSE55491, peripheral blood mononuclear cell (PBMC) from N = 5 healthy controls) as standard to determine whether a CpG island was methylated or non-methylated. It is known that the methylation level between neighbouring CpG sites is positively correlated. Therefore, to obtain a comparable measurement between cfMBD-seq and methylation array, we averaged beta-values of adjacent CpG sites within each CpG island and defined the methylation status of that CpG island. We then built a logistic regression model for all CpG islands in the microarray using normalized read counts from cfMBD-seq and methylation status from the microarray (AUC = 0.995, )). At the cut-off of 13.25, derived from the intersection of the specificity and sensitivity curves translated to normalized read counts, the sensitivity of cfMBD-seq is 0.94 and the specificity is 0.98. Namely, at this threshold, cfMBD-seq detected 94% of the methylated CpG islands that were reliably detected by Infinium methylation array while correctly classifying 98% of the non-methylated sites.
Figure 4. Comparison of cfMBD-seq with low input MBD-seq and cfMeDIP-seq.
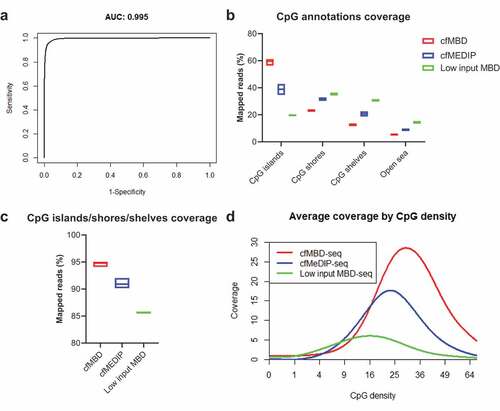
To determine the performance of cfMBD-seq over existing methylation enrichment assays, we compared cfMBD-seq with a previously published low-input MBD-seq protocol (N = 4 from GEO: GSM2593327-GSM2593330) that did not use filler DNA [Citation32]. This protocol uses MBD2, another MBD family member that is sensitive to the salt concentration of the elution buffer, for methylation capture. In order to balance the methylome-wide coverage, this protocol uses a low-salt buffer for elution, which results in a very low recovery rate (median 19.95% [(Q1) 19.25%-(Q3) 20.11%]) of the high CpG density regions (CpG islands) and a relatively high recovery rate (14.30% [14.24%-14.49%]) of the open sea regions ()). Worst of all, the overall coverage is low, which makes it difficult to discriminate methylated fragments from non-specific fragments and reduces the statistical power of differentially methylated analyses ()). We next compared cfMBD-seq with cfMeDIP-seq (N = 24 from published dataset) which showed adequate performance in capturing tumour-specific methylation in cfDNA [Citation24]. According to the summary QC from the RaMWAS package, we observed a higher percentage of reads that passed the filter in cfMBD-seq (83.15% [82.93%-83.68%]) than in cfMeDIP-seq (74.90% [74.53%-75.45%]) and a lower duplicate rate (3.45% [3.40%-3.90%] vs. 12.00% [9.00%-19.23%]). Taken together, cfMBD-seq generated higher quality of sequencing data and provided more informative sequences than cfMeDIP-seq given the same amount of aligned reads (79.60% [79.15%-80.43%] vs. 62.65% [55.60%-66.65%]) (). From CpG annotation-based coverage report, cfMBD-seq showed a significantly higher recovery rate at CpG islands (60.13% [58.78%-60.81%] vs. 38.16% [37.21%-41.28%], )) and a slightly higher recovery rate at combined CpG islands/shores/shelves (94.81% [94.61%-94.98%] vs. 90.90% [90.91%-91.55%], )), suggesting that cfMBD-seq preferentially enriches CpG islands while cfMeDIP-seq has more signal on CpG shores and CpG shelves. This finding is consistent with the coverage by the CpG density plot, where cfMBD-seq peaks at higher CpG density than cfMeDIP-seq (29.98 [29.54–30.33] vs. 22.88 [22.37–23.50], )). The comparison between cfMBD-seq, low input MBD-seq, and cfMeDIP-seq is summarized in .
Table 1. Feature comparison among cfMBD-seq, low input MBD-seq, and cfMeDIP-seq
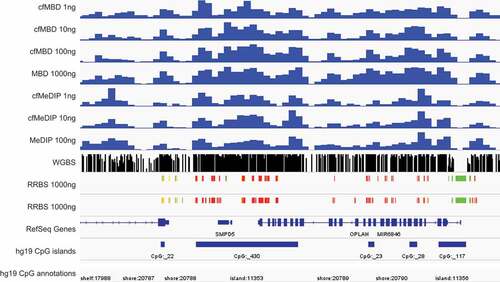
To better demonstrate the reproducibility of cfMBD-seq, we show a snapshot of a genomic region with consecutive CpG islands (chr8:86,703,816–86,880,439). We observed peaks with high similarity among cfMBD-seq (1 to 100 ng input DNA), standard MBD-seq (1000 ng), cfMeDIP-seq (1 to 10 ng), and standard MeDIP-seq (100 ng) (Figure S6). We then compare the signal peaks among different methylation profiling technologies. We show that cfMBD-seq also recapitulated methylation profiles from reduced representation bisulphite sequencing (RRBS, 1000 ng) and WGBS (2000 ng) (). All these findings suggest that cfMBD-seq, allowing for ultra-low amounts of starting material, will extend the methylome-wide investigations that can be conducted with MBD-seq.
Figure 5. cfMBD-seq recapitulates methylation profiles from other technologies.
Discussion
In this study, we further optimized the MBD-seq protocol to enable methylation enrichment from ultra-low DNA input. Our data show that cfMBD-seq achieves high genome-wide inter-replicate Pearson correlation with the standard MBD-seq (>1000 ng input) even when the input DNA is as little as 1 ng. cfMBD-seq also performs better than a previously published low input MBD-seq protocol without using filler DNA in methylation enrichment of CpG islands/shores/shelves regions [Citation32]. Moreover, cfMBD-seq outperforms cfMeDIP-seq in the enrichment of fragments with higher CpG density such as CpG islands. This finding is consistent with a previous study comparing the standard MBD-seq with the standard MEDIP-seq: MeDIP commonly enriches methylated regions with a low CpG density while MBD captures a broad range of CpG densities and identifies the greatest proportion of CpG islands [Citation33]. It is known that CpG-rich fragments do not undergo complete denaturation into single stranded DNA, which is required for an efficient MeDIP capture and may explain why MeDIP-seq is less sensitive towards fragments with high CpG density. In contrast, MBD capture does not require DNA denaturation because the MethylCap protein is sensitive towards double stranded DNA. Therefore, temperature control of DNA–protein mixture during MBD capture is less strict than that of MeDIP capture. In addition, MBD enrichment in cfMBD-seq can be finished within 5 hours (including 3 hours of incubation) while cfMeDIP enrichment requires overnight incubation. Thus, the reaction to MBD enrichment is less time-consuming. cfMBD-seq showed a slightly higher noise than cfMeDIP-seq in the summary QC of RaMWAS package. Noise is defined as the ratio of the average coverage of fragments that do not contain a CpG tandem to the average coverage of fragments that contain a CpG tandem in this package. As cfMBD-seq preferentially enriches methylated fragments with high CpG density, the coverage of fragments with low CpG density is expected to be low. However, low CpG density fragments are widely distributed in the human genome (open sea, Figure S1b), resulting in a relatively low average CpG coverage of cfMBD-seq. The average non-CpG coverage of cfMBD-seq and cfMeDIP-seq is less than 1, indicating high specificity of both assays. Overall, cfMBD-seq is a method of choice for interrogating regulation of gene expression (methylation changes in CpG islands). On the other hand, cfMeDIP-seq would be preferable in investigating transcriptional regulation of non-coding RNAs (methylation changes in gene bodies and CpG shores).
There are a few caveats to ensure successful cfMBD-seq. First, the quality of the MethylCap protein is very important. We notice that the use of the MethylCap protein, which has experienced multiple freeze–thaw cycles negatively impacts the data quality. Because the MethylCap protein is used with 10-fold dilution before adding to the reaction, it can be used for more reactions than standard MBD capture. Therefore, we recommend splitting the MethylCap protein into multiple aliquots to minimize the freeze–thaw cycles and using fresh diluted protein for each batch. Second, the success of the methylation enrichment reaction must be validated by qPCR to detect recovery of spiked-in control. The specificity of the reaction should be ≥99% before proceeding to the next step. Third, accurate library quantification is critical. Since methylated filler DNA is used in the methylation enrichment, qPCR-based library quantification is recommended because of its ability to quantify amounts of amplifiable DNA. Finally, adequate sequencing depth is crucial for high-quality data. Based on the saturation analysis, at least 30 million mapped reads are required to generate a saturated and reproducible coverage profile. The cost of cfMBD-seq from cfDNA extraction through the generation of sequencing data (single-end and pooling 12–15 indexed libraries) using the Illumina NextSeq 550 platform is less than $300 per sample. This cost-effective feature allows large-scale methylome-wide association analysis that is crucial for the establishment of a diagnostic model with high accuracy.
It is worth mentioning that the current study also has some limitations. First, it is well known that methylation status is different between individuals. The differences observed among cfMBD-seq, low-input MBD-seq, and cfMeDIP-seq could be partly attributed to differences in the samples that were used. Thus, this approach requires further validation. Second, the main application of cfMBD-seq is to identify cancer biomarkers in cfDNA. However, current study was limited to technology development and optimization. Further study in patient’s samples is warranted to test the feasibility of cfMBD-seq in clinical settings, in particular to elaborate how well this technology can differentiate the tumour-derived cfDNA (ctDNA) methylation from high background overall cfDNA.
Our study demonstrates the potential benefits of using cfMBD-seq to profile the methylome of cfDNA with ultra-low DNA input. Current results provide justification for further validation using case and control plasma samples from different malignancies to perform differential methylation analyses. Since enrichment-based methods are analysed by comparing the relative abundance of sequenced fragments, cfMBD-seq shares similar analysis workflows with cfMeDIP-seq for identification of DMRs and other downstream machine learning analyses. Another potential for cfMBD-seq is its use in other methylome-wide investigations that are limited by DNA yield. We confidently believe that cfMBD-seq, being non-invasive and cost-effective, has great potential in identifying biomarkers for cancer detection and classification.
Methods
cfDNA and HCT116 DNA extraction
Pooled human plasma (IPLAWBK3E50ML) was purchased from Innovative Research (Novi, MI, USA). Whole blood (K3 EDTA tube) was collected from donors in an FDA-approved collection centre. Plasma was frozen immediately after isolation. After thawing, additional centrifugation of 3000 rpm for 10 min was performed to ensure complete depletion of cell debris. cfDNA was extracted using QIAamp Circulating Nucleic Acid Kit (Qiagen; Hilden, Germany) and quantified using Qubit Fluorometer with iQuant™ NGS-HS dsDNA Assay Kit (Genecopoeia; Rockville, MD, USA). The average cfDNA yield from 1 ml plasma was ~7.5 ng. The colorectal carcinoma cell line HCT116 was purchased from ATCC (CCL-247™) and cultured according to the recommended cell culture method. HCT116 DNA was extracted using QIAamp DNA Blood Mini Kit (Qiagen) and quantified using Nanodrop (NanoDrop Technologies; Wilmington, Delaware, USA). gDNA was sheared to 160 bp using Covaris ME220 Focused Ultrasonicator to mimic the fragment size of cfDNA. HCT116 was chosen because of the availability of public DNA methylation data.
Library preparation and filler DNA generation
DNA was subjected to end repair/A-tailing and adapter ligation using KAPA Hyper Prep Kit (Kapa Biosystems; Wilmington, MA, USA) with the sequencing adapter from NEBNext Multiplex Oligos for Illumina (New England BioLabs; Ipswitch, MA, USA). The number of adapters used in the reaction was adjusted according to an adapter:insert molar ratio of 200:1. Adapter ligated DNA was purified with SPRI Beads (Beckman Coulter; Pasadena, CA, USA) and digested with USER enzyme (New England BioLabs) followed by purification with DNA Clean & Concentrator-5 Kit (ZYMO Research; Irvine, CA, USA). Meanwhile, filler DNA was generated via polymerase chain reaction (PCR) with GoTaq Master Mix (Promega; Madison, WI, USA), using Enterobacteria phage λ DNA as template. Amplicons were treated with CpG methyltransferase (M.SssI; Thermo Fisher Scientific; Waltham, MA, USA) for CpG methylation. The CpG methylation-sensitive restriction enzyme HpyCH4IV (New England BioLabs) digestion followed by agarose gel electrophoresis was used to ensure complete methylation of filler DNA. More detailed protocols regarding library preparation and filler DNA generation (including primer sequences) were reported previously [Citation23].
cfMBD-seq
Adapter ligated DNA was first combined with methylated filler DNA to ensure that the total amount of input for methylation enrichment was 100 ng, which was further mixed with 0.2 ng of methylated and 0.2 ng of unmethylated A. thaliana DNA from DNA Methylation control package (Diagenode, Seraing, Belgium). The DNA mixture was then subjected to methylation enrichment using MethylCap Kit (Diagenode) following the manufacturer's protocol with some modifications. The total volume brought up by Buffer B was reduced to 140 μl to minimize DNA waste. The amounts of MethylCap protein and magnetic beads were decreased proportionally according to the recommended DNA to protein and beads ratio (0.2 μg protein and 3 μl beads per 100 ng DNA input). Single fraction elution with High Elution Buffer was applied. The eluted fraction was purified by DNA Clean & Concentrator-5 Kit. The purified DNA was divided into two parts, one for qPCR (PowerUp™ SYBR™ Green Master Mix, Thermo Fisher) quality control and another for library amplification. The recovery of spiked-in methylated and unmethylated control can be calculated based on the cycle threshold (Ct) value of the enriched sample and input control. The specificity can be calculated by (1 – [recovery of unmethylated control DNA over recovery of methylated control DNA]) × 100. The methylation-enriched DNA libraries were amplified as follows: 95°C for 3 min, followed by 12 cycles of 98°C for 20 s, 65°C for 15 s, and 72°C for 30 s and a final extension of 72°C for 1 min. During amplification, a unique index from the primer was added to the sequencing adapter for each sample. The amplified libraries were purified using SPRI Beads followed by a dual size selection (0.6x followed by 1.2x) to remove any adapter dimers. All final libraries were first quantified using Qubit Assay and KAPA Library Quantification Kits (Kapa Biosystems) and then submitted to Moffitt Cancer Center Molecular Genomics Core for D1000 ScreenTape Assay (Agilent; Santa Clara, CA, USA). Libraries were sequenced on the NextSeq 550 platform (Illumina; San Diego, CA, USA), high-output 75 bp single-end read, multiplexed as ~12-15 samples per run.
Data processing
After sequencing, pre-alignment quality control was performed for the raw sequenced reads using fastp (Version 0.20.1) [Citation34] with the default settings. The sequenced reads were then aligned to the human genome (hg19) using Bowtie-2 (Version 2.4.2) [Citation35] with the default settings. After the alignment, the generated sam files were converted to bam files, followed by sorting and indexing duplicate read removal, and read count extractions on chr1 – chr22 using SAMtools (Version 1.11) [Citation36] ‘view’, ‘sort’, ‘index’, and ‘markdup’ command lines. R (Version 4.0.3 or greater) package RaMWAS (Version 1.12.0) [Citation37] was used for quality control of the overall mapping quality and calculation of average non-CpG/CpG coverage and coverage by CpG density. To ensure the comparability between different conditions, bam files of the same experimental condition were merged and 30 million sequenced reads were randomly extracted (https://github.com/ACSoupir/MiscProcessingScripts) from each condition for plotting of coverage by CpG density plot. R package MEDIPS (Version 1.40.0) [Citation38] was then applied for saturation analysis and calculation of correlations of genome-wide short read coverage profiles between samples based on counts per 1000 bp non-overlapping windows. Normalized data were exported as wiggle files for visualization on the Integrative Genomics Viewer.
CpG annotations reference was obtained from R package annotatr (Version 1.16.0). BEDtools (Version 2.28.0) [Citation39] ‘coverage’ command line was used to call the coverage according to the CpG annotations reference. TPM (Transcripts Per Kilobase Million) normalization was performed before comparing the CpG annotations coverage between different samples. Data from low-input MBD-seq and cfMeDIP-seq were reprocessed from raw data (fastq level) using the same workflow. R package minfi (Version 1.36.0) was used to call and annotate (hg19) methylation signal from Infinium HM450K data. The average beta-values of each CpG site among different samples were first calculated. Methylation status of CpG islands was then determined by the average beta-values of adjacent CpG sites within the same CpG island (<0.5 as unmethylated and ≥0.5 as methylated). Logistic regression model was built using normalized read counts from cfMBD-seq and methylation status (methylated as 1 and unmethylated as 0) from microarray. R package ROCR (Version 1.0–11) was used to generate the receiver operating characteristic curve. All data and R images were imported into GraphPad Prism 8 for preparation of figures. A detailed bioinformatics analysis pipeline was coded in git bash and is available in GitHub (see availability of materials and data).
Author contributions
Conceptualization, LW; Experiment, JYH; Data analysis, JYH, AS; Writing—original draft preparation, JYH; Writing—proofreading and editing, JYH, AS, and LW; Supervision, LW; funding acquisition, LW.
Supplemental Material
Download Zip (1.8 MB)Availability of materials and data
The sequencing data is available from GEO under the accession number GSE161331.
The data analysis pipeline is available at https://github.com/LiangWangLab/cfMBD-seq.
Disclosure statement
No potential conflicts of interest were disclosed.
Supplementary material
Supplemental data for this article can be accessed here.
Additional information
Funding
Related Research Data
References
- Wan JCM, Massie C, Garcia-Corbacho J, et al. Liquid biopsies come of age: towards implementation of circulating tumour DNA. Nat Rev Cancer. 2017;17:223–238.
- Siravegna G, Marsoni S, Siena S, et al. Integrating liquid biopsies into the management of cancer. Nat Rev Clin Oncol. 2017;14:531–548.
- Heitzer E, Haque IS, Roberts CES, et al. Current and future perspectives of liquid biopsies in genomics-driven oncology. Nat Rev Genet. 2019;20:71–88.
- Janku F, Huang HJ, Fujii T, et al. Multiplex KRASG12/G13 mutation testing of unamplified cell-free DNA from the plasma of patients with advanced cancers using droplet digital polymerase chain reaction. Ann Oncol. 2017;28:642–650.
- Janku F, Huang HJ, Claes B, et al. BRAF mutation testing in cell-free DNA from the plasma of patients with advanced cancers using a rapid, automated molecular diagnostics system. Mol Cancer Ther. 2016;15:1397–1404.
- Li W, Li Q, Kang S, et al. CancerDetector: ultrasensitive and non-invasive cancer detection at the resolution of individual reads using cell-free DNA methylation sequencing data. Nucleic Acids Res. 2018;46:e89.
- Roadmap Epigenomics C, Meuleman W, Ernst J, et al. Integrative analysis of 111 reference human epigenomes. Nature. 2015;518:317–330.
- Gai W, Sun K. Epigenetic biomarkers in cell-free DNA and applications in liquid biopsy. Genes (Basel). 2019;10:32.
- Moss J, Magenheim J, Neiman D, et al. Comprehensive human cell-type methylation atlas reveals origins of circulating cell-free DNA in health and disease. Nat Commun. 2018;9:5068.
- Jones PA. Functions of DNA methylation: islands, start sites, gene bodies and beyond. Nat Rev Genet. 2012;13:484–492.
- Suzuki MM, Bird A. DNA methylation landscapes: provocative insights from epigenomics. Nat Rev Genet. 2008;9:465–476.
- Esteller M. Epigenetics in cancer. N Engl J Med. 2008;358:1148–1159.
- Esteller M. Cancer epigenomics: DNA methylomes and histone-modification maps. Nat Rev Genet. 2007;8:286–298.
- Sprang M, Paret C, Faber J. CpG-islands as markers for liquid biopsies of cancer patients. Cells. 2020;9:1820.
- Huang J, Wang L. Cell-free DNA methylation profiling analysis-technologies and bioinformatics. Cancers (Basel). 2019;11. DOI:10.3390/cancers11111741
- Sun K, Jiang P, Chan KCA, et al. Plasma DNA tissue mapping by genome-wide methylation sequencing for noninvasive prenatal, cancer, and transplantation assessments. Proc Natl Acad Sci U S A. 2015;112:E5503–5512.
- Chan KC, Jiang P, Chan CWM, et al. Noninvasive detection of cancer-associated genome-wide hypomethylation and copy number aberrations by plasma DNA bisulfite sequencing. Proc Natl Acad Sci U S A. 2013;110:18761–18768.
- Luo H, Zhao Q, Wei W, et al. Circulating tumor DNA methylation profiles enable early diagnosis, prognosis prediction, and screening for colorectal cancer. Sci Transl Med. 2020;12:eaax7533.
- Xu RH, Wei W, Krawczyk M, et al. Circulating tumour DNA methylation markers for diagnosis and prognosis of hepatocellular carcinoma. Nat Mater. 2017;16:1155–1161.
- Vrba L, Futscher BW. A suite of DNA methylation markers that can detect most common human cancers. Epigenetics. 2018;13:61–72.
- Chan RF, Shabalin AA, Xie LY, et al. Enrichment methods provide a feasible approach to comprehensive and adequately powered investigations of the brain methylome. Nucleic Acids Res. 2017;45:e97.
- Taiwo O, Wilson GA, Morris T, et al. Methylome analysis using MeDIP-seq with low DNA concentrations. Nat Protoc. 2012;7:617–636.
- Shen SY, Burgener JM, Bratman SV, et al. Preparation of cfMeDIP-seq libraries for methylome profiling of plasma cell-free DNA. Nat Protoc. 2019;14:2749–2780.
- Shen SY, Singhania R, Fehringer G, et al. Sensitive tumour detection and classification using plasma cell-free DNA methylomes. Nature. 2018;563:579-+.
- Nuzzo PV, Berchuck JE, Korthauer K, et al. Detection of renal cell carcinoma using plasma and urine cell-free DNA methylomes. Nat Med. 2020;26:1041–1043.
- Lasseter K, Nassar AH, Hamieh L, et al. Plasma cell-free DNA variant analysis compared with methylated DNA analysis in renal cell carcinoma. Genet Med. 2020;22:1366–1373.
- Brinkman AB, Simmer F, Ma K, et al. Whole-genome DNA methylation profiling using MethylCap-seq. Methods. 2010;52:232–236.
- Irizarry RA, Ladd-Acosta C, Wen B, et al. The human colon cancer methylome shows similar hypo- and hypermethylation at conserved tissue-specific CpG island shores. Nat Genet. 2009;41:178–186.
- MethylCap kit (Diagenode Cat# C02020010).
- Aberg KA, Xie L, Chan RF, et al. Evaluation of methyl-binding domain based enrichment approaches revisited. PLoS One. 2015;10:e0132205.
- Bock C, Tomazou EM, Brinkman AB, et al. Quantitative comparison of genome-wide DNA methylation mapping technologies. Nat Biotechnol. 2010;28:1106–1114.
- Aberg KA, Chan RF, Shabalin AA, et al. A MBD-seq protocol for large-scale methylome-wide studies with (very) low amounts of DNA. Epigenetics. 2017;12:743–750.
- Nair SS, Coolen MW, Stirzaker C, et al. Comparison of methyl-DNA immunoprecipitation (MeDIP) and methyl-CpG binding domain (MBD) protein capture for genome-wide DNA methylation analysis reveal CpG sequence coverage bias. Epigenetics. 2011;6:34–44.
- Chen S, Zhou Y, Chen Y, et al. fastp: an ultra-fast all-in-one FASTQ preprocessor. Bioinformatics. 2018;34:i884–i890.
- Langmead B, Salzberg SL. Fast gapped-read alignment with Bowtie 2. Nat Methods. 2012;9:357–359.
- Li H, Handsaker B, Wysoker A, et al. The Sequence alignment/map format and SAMtools. Bioinformatics. 2009;25:2078–2079.
- Shabalin AA, Hattab MW, Clark SL, et al. RaMWAS: fast methylome-wide association study pipeline for enrichment platforms. Bioinformatics. 2018;34:2283–2285.
- Lienhard M, Grimm C, Morkel M, et al. MEDIPS: genome-wide differential coverage analysis of sequencing data derived from DNA enrichment experiments. Bioinformatics. 2014;30:284–286.
- Quinlan AR. BEDTools: the Swiss-army tool for genome feature analysis. Curr Protoc Bioinformatics. 2014;47:11 12 11–34.