
ABSTRACT
The mammalian kidney has extensive repair capacity; however, identifying adult renal stem cells has proven elusive. We applied an epigenetic marker of foetal cell origin (FCO) in diverse human tissues as a probe for developmental cell persistence, finding a 5.4-fold greater FCO proportion in kidney. Normal kidney FCO proportions averaged 49% with extensive interindividual variation. FCO proportions were significantly negatively correlated with immune-related gene expression and positively correlated with genes expressed in the renal medulla, including those involved in renal organogenesis (e.g., FGF2, PAX8, and HOXB7). FCO associated genes also mapped to medullary nephron segments in mouse and rat, suggesting evolutionary conservation of this cellular compartment. Renal cancer patients whose tumours contained non-zero FCO scores survived longer. The kidney appears unique in possessing substantial foetal epigenetic features. Further study of FCO-related gene methylation may elucidate regenerative regulatory programmes in tissues without apparent discrete stem cell compartments.
Introduction
Our understanding of epithelial homoeostasis and regeneration draws heavily on the concept of the stem cell niche first proposed in the haematopoietic system[Citation1]. Anatomically confined niche microenvironments promote the maintenance of stem cells, regulate their function, and there is abundant evidence of heterogeneity in these specialized environments among tissues [Citation2,Citation3]. While metabolic reprogramming favours glycolysis over mitochondrial oxidative phosphorylation and a dependence on oxygen-deficient conditions is a feature of the stem cell niche [Citation4], in some epithelial tissues with hypoxic regions such as the kidney, a localized stem cell compartment has proven difficult to establish. Instead, fully differentiated adult kidney tubule epithelial cells appear to dedifferentiate and redifferentiate following injury in the absence of a restricted stem cell compartment [Citation5–8]. The robust proliferative and reparative activity of renal epithelium exists across its segments [Citation5,Citation9,Citation10]. Further, background epithelial cell division without injury suggesting programmed homoeostatic restoration in response to wear and tear damage [Citation11]. To account for the kidney’s observed regenerative capacity researchers have proposed multiple pools of regionally specified progenitors [Citation12–14]. These observations challenge the prevailing view that epithelial homoeostasis and repair is a one-way process from undifferentiated progenitor cells to fully differentiated mature cells, and points towards mature epithelial cells acquiring a stem cell-like state upon injury [Citation15]. The regulatory programmes that direct these processes are unknown. Based on the re-expression of embryonic genes following injury [Citation16], we hypothesize that retention of foetal epigenetic programmes in the renal epithelium could play a role in this regenerative strategy and we further posit that this could be regulated through DNA methylation.
DNA methylation tags can be powerful tools for defining the dynamic contributions of different stem cell populations in epithelial homoeostasis[Citation17]. Methylation tags allow fate-mapping because their patterns are somatically inherited. Numerous investigators have shown how DNA methylation signatures can form a memory trace of stem cell origin [Citation18–27]. Recently, we used DNA methylation data from foetal and adult haematopoietic cells to devise a computational tool that estimates the proportions of cells (either haematopoietic or non-haematopoietic) derived from foetal cells [Citation28]. All foetal tissues, including foetal kidney, contained DNA methylation sites whose status is indicative of embryonic stem cells. Based on the output of this DNA methylation-based algorithm we created an index we have termed the foetal cell origin (FCO) proportion. Among haematopoietic cells we found the FCO proportion marks a developmental transition from foetal to adult stem cells as development proceeds from foetal to mature forms; a process called stem cell maturation [Citation29–31]. Similarly, in non-haematopoietic tissues the FCO proportion changes during developmental age. A recent survey revealed variable but generally low FCO levels in multiple adult solid tissues [Citation32]. This latter observation suggests that transitions in some embryonic methylation features during haematopoietic cell development also occur in many diverse tissues. In this study, we explore the FCO proportion in kidney tissue in relationship to its complex anatomical and functional architecture.
The functional unit of the kidney is the nephron (), with multiple distinct compartments: the glomerulus, proximal tubule, loop of Henle, distal tubule, connecting tubule and collecting ducts. Decades long study has revealed how these segments perform different aspects of the filtration process [Citation33]. Gene expression along the proximal to distal axis of the nephron is tied to its anatomic and functional segmentation [Citation34–36]. In addition, the organization of the cortico-medullary compartments of the kidney places medullary epithelial cells in a hyperosmolar and hypoxic environment [Citation37] that contains a paucity of lymphatics [Citation38]. Adaptation to low oxygen entails constitutive signalling of hypoxia-inducible factor 1 alpha (HIF-1α), which distinguishes the renal medulla from the cortex as well as from other parenchymal organs in the human body [Citation39]. The low oxygen concentrations, continuous HIF-1α signalling, and as the greater reliance of the medulla on glycolytic energy metabolism [Citation40] are reminiscent of conditions extant during embryonic development [Citation41,Citation42].
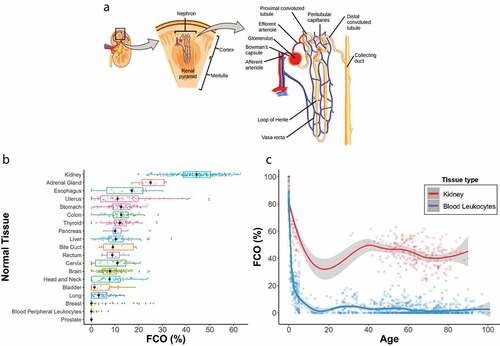
Figure 1. A-C. FCO proportions are associated with development stage, subject age and are elevated in adult kidney compared to non-renal tissues. Panel A. Schematic image of nephron (https://commons.wikimedia.org/wiki/File:Figure_41_03_03.png; permitted to use) Panel B. Horizontal box plots of median FCO proportions among adult tissues showing that adult kidney FCO proportions are higher than other solid tissues or haematopoietic cells. FCO proportions estimated in 964 normal tissue samples from 20 TCGA studies and 4 GEO studies. Panel C. Cross-sectional plot of the FCO proportions of human foetal, paediatric and adult kidney specimens and blood leukocytes by tissue donor age. Loess smoothing curves and 95% confidence intervals across different ages showing the relationship of donor age with FCO proportions. Data sources supplied in methods.
The FCO signature represents a phenotypic block of CpG sites that display foetal methylation status and is associated with at least 928 genes. A priori, we recognized genes encoding transcription and growth factors fundamental in nephrogenesis within this FCO gene subset (Suppl Table 1) (e.g., SIX2, PAX8, IRX1, HOXB7, FGF2) [Citation43]. SIX2 is one of the earliest mesenchymal to epithelial morphogens required in nephrogenesis [Citation44], and is not expressed in adult tissue [Citation45]. PAX8 and its homologue PAX2 are central regulators of kidney development [Citation46]. IRX1 plays a crucial role in the formation intermediate segments of the embryonic nephron [Citation47–49] and is expressed at low levels in the adult loop of Henle [Citation34]. Another FCO related gene, HOXB7, is considered a specific cell lineage determining factor of collecting duct cells [Citation50] and is expressed in the adult nephric epithelium in the loop of Henle and collecting ducts [Citation51]. FGF2 (basic fibroblast growth factor 2) has been implicated in early metanephric mesenchymal patterning [Citation52], and although not expressed in adult rat nephrons [Citation34] it is induced in acute and chronic kidney damage, where it reduces functional and structural damage [Citation53–55].
The mammalian kidney has been shown to contain unique physiological and regenerative properties [Citation6–8]. Importantly, a discrete stem cell compartment in the kidney has been elusive using existing markers [Citation7], which prompted our studies of the FCO marker in kidney. Here we examined expression data from different cortical and medullary regions of the human kidney obtained by localized biopsies at different depths of the organ [Citation56]. We explored FCO-related gene expression and its relationship to established co-expression modules previously mapped to structural and functional regions of the human nephron [Citation57]. Meticulous microdissection and application of bulk and single-cell RNA-Seq have revealed a deep homology of renal cell identity and function across human, mouse and rat species. Here we integrated DNA methylation and multi-species gene expression data to investigate links between the FCO proportion and renal tissue organization. We corroborated our findings in mouse using kidney single-cell RNA-Seq data [Citation58]. In the rat, we studied comprehensive nephron segment-specific data, which catalogues more than 8000 transcripts in 14 structurally definable tubular subunits [Citation34]. Because foetal and embryonic features are associated with renal cancer stem cells, whose frequencies increase in higher grade and stage tumours with shorter survival times [Citation59–62] we examined the FCO fraction and its relationship with tumour characteristics and patient survival times. Our results implicate a heretofore unrecognized foetal programme as a potential controller of medullary gene expression in adult human kidney and point to the existence of a widespread niche of epigenetically distinct progenitors.
Methods
DNA methylation studies
We analysed DNA methylation data from 348 kidney specimens in 6 studies and 1812 other tissue specimens in 31 studies. Specifically, non-tumour adult kidney and other solid tissues from TCGA Level 3 Illumina Infinium HumanMethylation450 BeadChip array data were collected from 739 normal tissue samples from 20 TCGA studies (Suppl Table 2). Additional normal adult tissue samples (N = 225) of cervix, brain, adrenal gland and stomach from GEO data sets were downloaded from GSE46306 [Citation63], GSE80970 [Citation64], GSE77871 [Citation65] and GSE103186 [Citation66]. Foetal normal kidney sample data were downloaded from GSE69502 [Citation67] and GSE76641 [Citation18] (N = 22) and paediatric normal kidney sample data were downloaded from GSE59157 [Citation68] (N = 36). We accessed additional datasets of microdissected renal cortex from diabetes-related chronic kidney disease (CKD) (N = 21) and CKD free controls (N = 64), GSE50874 [Citation69]. DNA methylation data of 1027 blood leukocyte samples from birth to adulthood were downloaded from GSE62219 [Citation70], GSE83334 [Citation71], GSE36054 [Citation72], GSE40279 [Citation73], GSE35069 [Citation74], GSE59065 [Citation75] and GSE30870 [Citation76] and 26 cord blood samples from packages FlowSorted.CordBlood.450 K[Citation77] and FlowSorted.CordBloodNorway.450 K [Citation77] on Bioconductor (Suppl Table 3).
Gene expression studies
Human kidney (RNA-Seq) expression data were downloaded from normal TCGA kidney samples [Citation78] and biopsy depth microarray expression from [Citation56]. RNA-Seq data from microdissected rat nephron [Citation34] and single-cell mouse kidney [Citation58] were accessed.
Transcriptome-wide expression correlations with FCO proportions
We also examined genome-wide kidney gene expression to identify transcripts associated with the FCO proportions of specimens, in contrast to the metagene described above, which are restricted to FCO genes that are associated with DMRs in either the extended (N = 1218 CpG) or algorithmic subset (N = 27 CpG). Specifically, we computed the Pearson and Spearman correlation between the FCO proportion and the expression levels of each gene among samples in the TCGA normal kidney data for whom both DNA methylation (necessary for FCO estimation) and gene expression data were available (N = 47). Suppl Table 4 contains the gene-specific Spearman and Pearson correlation coefficients with the FCO.
Gene expression metagenes associated with FCO proportions
FCO-related kidney metagenes for positively and negatively correlated genes were created using Level 3 RNA-seq gene-level HTSeq-FPKM data from 104 normal kidney samples from the KIRC and KIRP TCGA cohorts. The extended FCO subset of N = 1218 CpGs is associated with 928 genes, herein referred to as FCO subset genes. We restricted our analysis to transcripts with zFPKM > −3 as recommended [Citation79]. Within normal kidney samples, 630 of these FCO subset genes were identified as significantly expressed and of these 187 were judged positively and 189 negatively correlated with the FCO proportion. Significant correlations were assigned if the expression Spearman’s coefficient FDR was <0.1, after adjusting for age and gender (FCOgeneExpression = FCO + age +gender). Metagenes were created for positively and negatively correlated genes separately by taking the log2 transformed FPKM value of each gene after adding an offset of 1 and scaling the mean value for each gene to 0. Finally, samples were assigned an FCO score by calculating the mean expression of all differentially expressed FCO genes. We also created metagenes for genes associated with the 27 CpGs contained in the computational probe set which is used in the algorithm for estimating the FCO proportion [Citation28]; this restricted computational subset contains 33 genes. Among them, the expression levels of eight were identified as positively and four negatively correlated with the FCO proportion. Suppl Table 5 lists the metagene descriptions.
Biopsy depth gene expression analyses
We correlated FCO proportions and FCO metagene expression scores with previously published expression signatures that distinguish four different kidney locations (outer cortex, corticomedullary junction, outer medulla and inner medulla) in histologically normal adult kidney [Citation56]. Samples were procured using fine-needle cores from approximately 10-mm-thick sections obtained from five nephrectomized patients in surgery for renal neoplasms. Tissue farthest from the tumour was selected. Gene expression data were collected using the HumanHT-12 4.0 expression BeadChip (Illumina Inc. San Diego CA) platform. A total of 102 samples were available to correlate biopsy depth expression and FCO metagene expression data. A total of 47 samples with biopsy depth expression also had DNA methylation data to allow correlations with FCO proportion.
Mouse kidney single cell-derived metagenes
Mouse renal cell expression metagene signatures were derived from a catalogue of mouse kidney cell types obtained in an unbiased manner using droplet-based single-cell RNA sequencing [Citation58]. Clustering analyses based on 43,745 single cells identified 16 distinct cell clusters, which were assigned a cell identity through multiple corroborating sources including: bulk RNA sequencing from microdissected rat nephron [Citation34], microarray data on human immune cell, and transgenic mouse models. Cell-specific marker genes for mouse kidney ascending loop of Henle, collecting duct principal cell, proximal tubule, distal convoluted tubule, B lymphocyte and T lymphocyte were downloaded and used as input for creating metagene signatures (Suppl Table 5). Each mouse cell metagene was correlated with the FCO proportion and FCO related expression scores of normal human kidney samples of the TCGA.
Mapping FCO differentially expressed genes to anatomic segments of the rat nephron
RNA-Seq data from rat microdissected glomerulus and 14 nephron segments were retrieved using the publicly accessible portal of the Epithelial Systems Biology Laboratory [Citation34] https://hpcwebapps.cit.nih.gov/ESBL/Database/NephronRNAseq/All_transcripts.html. Rat renal tubule segments manually dissected under microscope were lysed in cell lysis buffer containing reverse transcriptase and oligo-dT primers. After reverse transcription of poly(A)-tailed mRNA transcripts, cDNAs were amplified and sequenced using Illumina HiSeq 2000 sequencer. FASTQ sequences were mapped to rat reference genome and gene expression levels of all genes were determined by calculating the reads per kilobase of exon model per million mapped reads (RPKM). To explore the representation of human FCO related gene expression within anatomic segments of the rat kidney, we first identified all human kidney genes (TCGA normal kidney) whose expression exhibited a Spearman correlation of at least > |0.6| with the corresponding FCO proportion of each sample. From this gene set, we identified G = 458 high-confidence human/rat orthologs, determined using the Ensembl database (http://www.ensembl.org/biomart/martview), that were expressed in at least 5% of the samples from different anatomical segments of the rat kidney. The RPKM values for these 458 were log2-transformed (with an offset of 1 to account for RPKM values of zero), and used as input for a t-distributed Stochastic Neighbour Embedding (t-SNE) analysis to visualize the high-dimensional structure of the data in a lower-dimensional space (two-dimensions, in this case) [Citation80]. The R-package Rtsne [Citation81] was used for the t-SNE analysis using default settings for all parameters, except number of dimensions (ndim = 2) and perplexity = 8. To gain insight into the genes driving the t-SNE clusters, G = 30 genes (out of the 458 used in t-SNE) were used to construct a hierarchical clustering heatmap to visualize influential genes across different renal tubule segments. These 30 genes were selected such that they exhibited the smallest p-values based on a Kruskal-Wallis test used to compare log2-transformed RPKM values between the different renal tubule segments (e.g., G, S1, S2, S3, SDL, etc.).
Data processing and quality control
Level 3 Illumina Infinium HumanMethylation450 BeadChip array data on TCGA contain beta values calculated from background-corrected methylated (M) and unmethylated (U) array intensities as Beta = M/(M + U). In these data, probes having a common SNP within 10bp of the interrogated CpG site or having overlaps with a repetitive element within 15bp from the interrogated CpG site are masked as ‘NA’ across all samples, as were probes with a non-detection probability (P > 0.01) in a given sample [Citation32]. Level 3 TCGA RNA-seq gene-level expression data used are HTSeq-FPKM (Fragments Per Kilobase of transcript per Million mapped reads) data that normalize read count based on gene length and the total number of mapped reads [Citation82]. For GEO DNA methylation data used, GSE46306 [Citation63], GSE69502 [Citation67], GSE59157 [Citation68] and GSE40279 [Citation73] contain normalized average beta values processed by BeadStudio software; GSE80970 [Citation64] contains quantile-normalized beta values by using Dasen function within the wateRmelon package in Bioconductor; GSE77871 [Citation65], GSE50874 [Citation69], GSE36054 [Citation72], GSE35069 [Citation74] and GSE30870 [Citation76] contain average beta values processed by the GenomeStudio software; GSE103186 [Citation66] contains normalized beta values by using the minfi package in Bioconductor; GSE76641 [Citation18] contains functional normalized beta values by using R; GSE62219 [Citation70] contains quantile normalized M-values by using the GenomeStudio software; GSE83334 [Citation71] and GSE59065 [Citation75] contain normalized beta values by using the Subset-Quantile Within Array Normalization (SWAN) in the minfi Bioconductor package. In addition, raw DNA methylation data on FlowSorted.CordBlood.450 K [Citation83] and FlowSorted.CordBloodNorway.450 K [Citation77] were processed by using the minfi package in Bioconductor.
Calculation of the foetal cell origin (FCO) proportion
The derivation of the FCO algorithm was estimated as previously described [Citation28]. Briefly, this method achieves a deconvolution of foetal versus adult cell fraction using constrained projection quadratic programming (CP/QP) proposed by Houseman [Citation84], substituting the default reference library with the library identified based on the pipeline developed to discriminate foetal and adult blood leukocytes [Citation28]. For analyses using GEO data sets, no additional normalization steps were employed to the already preprocessed β-values. β-value distributions were, however, inspected for irregularities, and where relevant, k nearest neighbours were performed for missing value imputation.
Metascape gene enrichment analysis
We assessed genes whose expression was positively and negatively correlated with the FCO proportion of kidney samples. Four sets of genes were characterized by gene enrichment analysis, including top 250 genome-wide genes whose expression are negatively correlated with FCO proportion based on the Spearman’s correlation coefficient ranking, 2996 genome-wide genes whose expression are positively correlated with FCO proportion at the Spearman’s correlation coefficient cut-off 0.45, 187 FCO genes whose expression were judged as positively correlated with FCO proportion and 189 FCO genes whose expression were judged as negatively correlated with FCO proportion (FDR < 0.1). The gene enrichment analyses were conducted with Metascape software [Citation85], database updated on 2020–09-16. For each given gene list, pathway and process enrichment analysis has been carried out with the following ontology sources: KEGG Pathway, GO Biological Processes, Reactome Gene Sets, Canonical Pathways and CORUM. All genes in the human genome have been used as the enrichment background [Citation85]. Terms with a p-value <0.01, a minimum count of 3, and an enrichment factor >1.5 (the enrichment factor is the ratio between the observed counts and the counts expected by chance) are collected and grouped into clusters based on their membership similarities [Citation85]. More specifically, p-values are calculated based on the accumulative hypergeometric distribution, and q-values are calculated using the Benjamini-Hochberg procedure to account for multiple testing [Citation85].
Additional kidney metagene scores
A total number of 823 genes in 25 quality threshold (QT) clusters representing kidney glomerulus, cortex, loop of Henle, and medulla formed co-expressed gene modules [Citation56]. These co-expression modules were compared with the FCO proportion and FCO related expression metagenes. In addition, since the level of renal tissue fibrosis and tissue inflammation increases with age and often differs between individuals, we included metagenes representing different aspects of kidney damage [Citation86,Citation87]. A number of gene signatures were used to calculate the relative sample-level gene signature scores. Two gene signatures were downloaded from the Broad Institute Molecular Signatures Database (MSigDB; http://www.broadinstitute.org/gsea/msigdb/index.jsp): 97 genes found upregulated in transplant biopsies following acute kidney rejection as compared to well-functioning transplants [Citation86], and 261 genes associated with ageing kidney histology [Citation87], respectively (Suppl Table 5).
Epigenetic mutations in clear cell
We examined the distribution of previously identified missense and truncating mutations in genes that encode for histone-modifying enzymes in FCO-related survival subgroups. These genes include PBRM1, BAP1, SETD2 [Citation78].
Statistical analysis of survival times TCGA survival data
Tree-based models of renal cancer overall survival were constructed using recursive partitioning via the partDSA algorithm [Citation88,Citation89] in an effort to create homogeneous survival risk groups. Models incorporated relevant patient variables, including patient age, gender, TMN class, tumour laterality, tumour FCO score. FCO score was treated as a continuous variable. partDSA models were built and chosen using the Brier loss function and fivefold cross-validation.
Statistical analysis to estimate the proportion of variation in FCO explained by kidney depth measurements
The function rsq.partial in the R-package rsq was used to compute the proportion of variation in FCO explained by depth measurements (e.g., values of cortex, cortex-medulla, outer medulla, and medulla papillae) not explained by subject age, gender, and race. Calculation of the partial R[Citation2] was carried out using sums of squares estimates from two nested linear regression models, each fit to FCO as the dependent variable. Model 1 included subject age, gender, race as covariates, and Model 2 included all of covariates in Model 1, plus depth measurements of the cortex, cortex-medulla, outer medulla, and medulla papillae.
Database and software
All data sets from TCGA (https://portal.gdc.cancer.gov/), GEO (https://www.ncbi.nlm.nih.gov/geo/), ESBL (https://hpcwebapps.cit.nih.gov/ESBL/Database/NephronRNAseq/All_transcripts.html.) and the Ensemble database (http://www.ensembl.org/biomart/martview) are publicly available. The software R studio with R version 3.6.3 and Metascape (https://metascape.org/gp/index.html#/main/step1) [Citation85] are used to analyse the data and create figures and graphs.
Results
An overview of the analyses is shown in Suppl and a summary of the data sources is presented in Suppl Table 2 and Suppl Table 3.
Human adult kidney displays high FCO proportions compared to other tissues and wide inter-individual variation
Comparing FCO proportions between adult haematopoietic cells and 18 solid tissues revealed that the kidney contained the highest FCO proportions (, N = 964). Mean FCO proportions of other solid organs averaged 8.2%, whereas adult kidney was 43.9%; a 5.4-fold higher FCO proportion (p < 0.001; t test). The second highest FCO proportions were observed in adrenal tissue (25.3%). Adult leukocytes have an average FCO of zero, although some outliers showed low to modest frequencies. To explore the influence of age on the renal FCO proportion, we plotted the FCO proportion by age in kidney (N = 263) and blood leukocytes (N = 1053) (). The FCO of paediatric kidneys (N = 36, average age = 2.8 yrs.) was lower than foetal samples (N = 22, 55.1% versus 96.5%, p < 0.001; t-test), and adult kidney (N = 205,18–90 yrs.), FCO proportions were lower compared with paediatric samples (43.9% vs 55.1%, p < 0.001; t-test). However, both paediatric and adult scores were markedly elevated compared to adult blood leukocytes. Wide individual variation in adult renal FCO proportions was observed with a subtle trend towards lower scores as age increased (Pearson’s r = −0.32, p < 0.001). We studied FCO proportions in an additional adult dataset (GSE50874) consisting of micro-dissected kidney cortex enriched for proximal tubular epithelium (N = 85) in contrast to the normal bulk biopsy specimens of the TCGA (N = 205); including control samples (N = 64), and those with evidence of chronic kidney disease (CKD) (N = 21) [Citation69]. Both micro-dissected sample sets contained lower FCO proportions compared to normal bulk kidney samples from TCGA (35.2% non-CKD versus 43.9% TCGA normal, P < 0.001; 23.2% CKD versus 43.9%TCGA normal, P < 0.001; t test) see Suppl . The FCO proportions of CKD affected samples was lower than the control microdissected specimens (35.2% non-CKD versus 23.2% CKD, P < 0.001; t test).
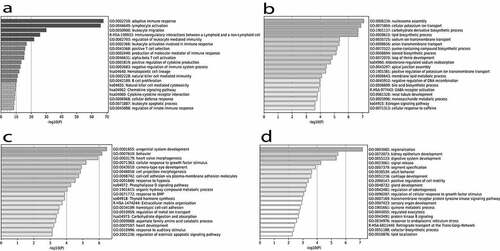
Figure 2. A-D. Gene ontology enrichment among genes associated with the FCO proportion. Panel A. The top 250 genes negatively correlated with the FCO proportion were analysed using gene ontology (GO) enrichment analysis with the PANTHER Overrepresentation Test. We present the top 20 GO biological process pathways in the table based on FDR ranking. Panel B. Top 20 GO terms enriched with genes exhibiting a positive correlation with FCO proportion based on a transcriptome-wide association analysis. Panel C. Top 20 GO terms enriched with genes exhibiting a negative correlation with FCO proportions based on restricted subset of genes containing FCO DMRs. Panel D. Top 20 GO terms enriched with genes exhibiting a positive correlation with FCO proportions based on restricted subset of genes containing FCO DMRs.
Transcriptome-wide gene expression correlations with FCO proportions and enriched biological pathways
Two analyses identified differential gene expression (DGE) patterns associated with the FCO proportion. The first used all transcripts (N = 56,716) expressed in the TCGA normal kidney samples, and the second was a supervised analysis restricted to FCO genes (N = 928) containing DMRs (Suppl Table 6–9). Results from the genome-wide gene set (N = 20,851) enrichment analysis using the top 250 genes negatively correlated with FCO proportions (ranked by Spearman’s r, Suppl Table 6) is summarized in . The ontology classes enriched among negatively correlated genes were strongly concentrated in immune functions including B cell, T cell activation and natural killer cell functions. For example, nine B cell immunoglobulin heavy-chain loci (IGHM, IGHA1, IGHA1, IGHG1, IGHG2, IGHG3, IGHG4, IGHE, IGHD) and the constant region of immunoglobulin light chains IGLC2, were represented. A recent study [Citation90] reported B cells to be exclusively located in adult kidney cortex. Consistent with this result, we found a strong inverse correlation of the nine heavy-chain metagene expression score with the adult FCO proportion (Pearson’s r = −0.82; p < .001). CD3D and CD3E in the list are part of the T-cell receptor/CD3 complex (TCR/CD3 complex) and involved in T-cell development and signal transduction [Citation91].
Results from the genome-wide gene set (N = 20,851) enrichment analysis using 2996 genes positively correlated with FCO proportions (Spearman’s r > 0.45, Suppl Table 7) are summarized in (). Prominent categories observed were potassium ion transport, loop of Henle, and renal tubule development. Among the genes included are KCNJ family potassium channels and Na+/K+-ATPases localized in distal tubule [Citation92]. Genes positively correlated with the FCO are predominately epithelial in origin compared with negatively correlated genes, which are haematological in origin.
FCO subset gene expression correlations with FCO proportions and enriched biological pathways
In the second set of gene enrichment analyses, we restricted our DGE pattern scans to the 928 genes whose methylation is used for FCO inference, the FCO DMRs [Citation28]. Of the 630 genes expressed in kidney, 187 (FDR < 0.1) were positively correlated with FCO proportion, and 189 (FDR < 0.1) FCO genes were negatively correlated; we refer to these gene sets as positive FCO expression subsets, and negative FCO expression subsets, respectively. Among 189 genes containing DMRs and whose expression was negatively correlated with the FCO proportion (Suppl Table 8), we observed enrichment of genes involve in urogenital systems development (). For instance, WNT6 is expressed in the branching ureteric bud during the early stages of organogenesis [Citation93] and the inactivation of NFIA causes both ureteropelvic junction and ureterovesical junction anomalies in murine models and humans [Citation94]. Among 187 positive FCO subset genes (Suppl Table 9), we observed enrichment of GO terms for regionalization, kidney epithelial differentiation and segment specification . Regionalization is a pattern specification process resulting in the subdivision of an axis or axes in space to define an area or volume that specific cell differentiation patterns will take place. For example, we identified HOXA2, HOXA11, HOXB3, HOXB6, HOXB7 and HOXD9 in our positive FCO subset gene list and the HOX genes are proven to be instrumental in establishing the positional identity of cells along the embryonic anteroposterior (A-P) axis [Citation95]. Also, PAX8 in the list has been proved to regulate branching morphogenesis and nephron differentiation in the developing kidney [Citation96]. Furthermore, FGF2 in the list was implicated in early metanephric mesenchymal patterning [Citation52].
Differentially methylated regions (DMRs) in FCO genes FGF2, PAX8 and HOXB7 across tissues
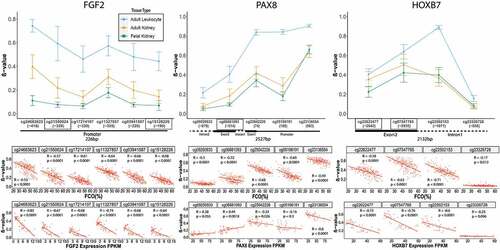
To provide three examples of FCO-related DMRs in foetal kidney, adult kidney, and adult blood leukocytes, we plotted the methylation beta values of FGF2, PAX8 and HOXB7 which have established roles in embryonic kidney development ( upper panels). The errors represent standard deviations for the methylation proportions of 22 foetal kidneys [Citation18,Citation67], 205 normal adult kidneys (TCGA renal clear cell KIRC and papillary KIPR) and 36 adult leukocytes samples [Citation74]. Genomic regions containing FCO DMRs displayed lower methylation values in adult kidney than adult leukocytes, indicating that adult kidney does not mature as much as adult leukocytes. Foetal kidney methylation values were typically lowest compared to adult kidney and white blood cells. Individual CpG values for each gene were correlated with each estimated tissue FCO proportion ( Middle panel). We also found significant correlations of gene expression with methylation at the CpG level ( Lower Panels) indicating that these differentially expressed genes in adult tissues contain methylation marks shared with embryonic stem cells. Furthermore, we added 151 foetal leukocytes samples [Citation77,Citation83], 12 embryonic stem cell-line samples [Citation97] (Suppl ) and paediatric kidney samples (Suppl ) to the methylation error bar plot [Citation68].
Figure 3. DNA methylation levels of FCO related genes depend on tissue type and are correlated with gene expression in adult kidney. Three examples of FCO-related DMRs in foetal kidney, adult kidney and adult blood leukocytes are shown; FGF2, PAX8, and HOXB7 genes. The upper panels show that adult leukocytes, which have a non-detectable FCO score, demonstrate higher beta values (Y-axis) compared to foetal kidney and that adult kidney methylation tracks with foetal tissues (boxed are the FCO related CpGs). Error bars represent standard deviations for 22 foetal kidneys (GSE69502 and GSE76641), 205 normal adult kidneys (TCGA), and 23 adult blood leukocytes. The lower panels depict the correlations of each CpG site methylation value with the corresponding sample FCO proportion (middle panel) and the corresponding RNA-Seq expression score (lower panel) in adult kidney.
Renal depth biopsy reveals that FCO related gene expression localizes to the medulla
Using the 187 genes positively correlated with FCO proportions (Suppl Table 9) we created a metagene expression signature to serve as a transcriptional correlate of the foetal methylation signature. We reasoned that associating FCO gene expression with biopsy depth-specific gene expression could help localize the cells whose expression is affected by the FCO. Four different regions representing nephron biopsy depth were previously differentiated by their distinctive gene expression [Citation56]. We regressed these established biopsy depth expression values (X-axis) with each sample’s FCO expression metagene score (Y-axis) at each of four different biopsy depths (). The resulting plots revealed clear linear trends of FCO with biopsy depth expression scores within each kidney region: cortex, cortico-medullary, outer medulla, inner medulla. However, the slopes of the regressions were positive for outer and inner medulla but were negative for the cortex and cortico-medullary depth samples. Similarly, the 189 genes identified as negatively correlated with the FCO proportion were used to create a negative FCO expression score (Suppl Table 8). These negative FCO parameters were also regressed against regional biopsy expression scores. The resultant pattern was a mirror image of the relationships observed for the positive expression scores (Suppl ). Metagene scores for negatively correlated genes were positively associated with cortex and cortico-medullary depths and negatively associated with outer and inner medulla. Taken together, these observations show that genes whose expression increases with increasing FCO proportion are most strongly associated with medullar depth biopsy. In contrast, gene expression inversely related to the FCO proportion is related to the renal cortex. Using the depth metagene score for each sample in conjunction with donor age we modelled the FCO proportion and estimated that 33% of the variation in the normal kidney proportions was associated with variation in depth metagene score and hence potentially attributable to cell composition.
Figure 4. A-B. Gene expression signatures positively correlated with FCO proportions localize to renal medulla in adult human kidney. Panel A. The expression of genes positively correlated with the FCO proportion are highly correlated with differentially expressed genes of the renal medulla. Metagene signature scores for FCO positively correlated genes are plotted against four published metagene expression scores of cortical and medullar biopsy depth biopsies [Citation56] (95% confidence interval indicated by grey shades). Panel B. Heatmap showing correspondence of FCO positive and negatively correlated gene metagenes with the co-expression modules of Lindgren DA 2017[Citation56]. Co-expression modules correspond to published quality threshold (QT) module designation and are presented in the anatomic order as presented therein.
![Figure 4. A-B. Gene expression signatures positively correlated with FCO proportions localize to renal medulla in adult human kidney. Panel A. The expression of genes positively correlated with the FCO proportion are highly correlated with differentially expressed genes of the renal medulla. Metagene signature scores for FCO positively correlated genes are plotted against four published metagene expression scores of cortical and medullar biopsy depth biopsies [Citation56] (95% confidence interval indicated by grey shades). Panel B. Heatmap showing correspondence of FCO positive and negatively correlated gene metagenes with the co-expression modules of Lindgren DA 2017[Citation56]. Co-expression modules correspond to published quality threshold (QT) module designation and are presented in the anatomic order as presented therein.](/cms/asset/fdceb47c-8f71-4bcd-a961-2f8af1e2bd31/kepi_a_1900027_f0004_oc.jpg)
Co-expression modules implicate FCO proportions with distal tubule and medullar segment gene expression
To further understand FCO expression metagenes’ relationship with the segmented structure of the human nephron, we aligned FCO expression parameters with a previously validated model of nephron co-expression 16 epithelial modules and additional inflammation-related signatures () [Citation56]. Both the FCO positive (n = 8) and negative (n = 4) expression metagenes are displayed in their relationship to co-expression module scores and show a coherent pattern of association between positive FCO metagenes and distal nephron modules. In contrast, the metagenes negatively associated with the FCO proportions displayed a cohesive association pattern with glomerulus and proximal tubular location. These observations are reminiscent of the biopsy depth correlations, indicating robustness, this pattern was consistent even using a limited number of FCO related genes. Immune-related gene expression was inversely associated with the FCO proportion, consistent with results of other inflammation modules. Immune-related signatures were in general inversely associated with the FCO proportion and the positive FCO metagene score (Suppl ). HIF-1 signalling pathway metagenes were significantly positively correlated with the FCO proportion and the positive FCO metagene score (p < 0.01) (Suppl ).
Figure 5. Corroboration of human FCO-related gene expression using orthologous renal genes in mouse (a) and rat (b). Panel A. The expression of human orthologs of mouse kidney cell gene signatures for ascending limb of the loop of Henle cells, and the collecting duct’s principal cells are strongly correlated with FCO related gene expression. Expression of human orthologs of mouse proximal and distal convoluted cells are inversely correlated with FCO related gene expression (95% confidence interval indicated by grey shades). Panel B, left. t-SNE clustering using rat orthologs of human FCO related genes that discriminates six kidney regions in the rat. Human genes were chosen whose expression exhibited a Spearman correlation with FCO proportions of at least > |0.6|. Panel B, right. Hierarchical clustering using the top 30 influential genes in the t-SNE clusters showing association of medullary segments with genes positively correlated with FCO proportions whereas cortical nephron segments and glomerulus are influenced by gene expression negatively associated with FCO proportions.
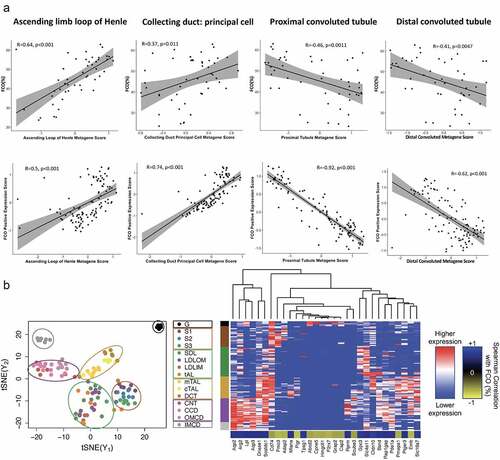
Figure 6. Non-detectable FCO proportions within tumour tissue predict longer survival times in human clear cell renal cancer. Survival analysis was conducted using the data from TCGA. We applied a recursive partitioning algorithm, partDSA, in an effort to create homogeneous survival risk groups [Citation88]. Panel A. partDSA survival tree for human renal clear cell carcinoma patients on TCGA. The models incorporated relevant patient variables, including patient age, gender, TMN class, tumour laterality, tumour FCO score. Panel B. Kaplan-Meier survival curves for the part DSA-identified subgroups. Panel C. Relevant survival statistics for the part DSA-identified subgroups. Panel D. Association of nondetectable FCO (FCO = 0) proportions with higher stage clear cell renal cancer tumours.
![Figure 6. Non-detectable FCO proportions within tumour tissue predict longer survival times in human clear cell renal cancer. Survival analysis was conducted using the data from TCGA. We applied a recursive partitioning algorithm, partDSA, in an effort to create homogeneous survival risk groups [Citation88]. Panel A. partDSA survival tree for human renal clear cell carcinoma patients on TCGA. The models incorporated relevant patient variables, including patient age, gender, TMN class, tumour laterality, tumour FCO score. Panel B. Kaplan-Meier survival curves for the part DSA-identified subgroups. Panel C. Relevant survival statistics for the part DSA-identified subgroups. Panel D. Association of nondetectable FCO (FCO = 0) proportions with higher stage clear cell renal cancer tumours.](/cms/asset/bcd97e76-248c-4540-b85d-e1b684535190/kepi_a_1900027_f0006_oc.jpg)
Mouse kidney cell orthologs in human tissues aligned with the FCO proportion
We utilized mouse kidney single-cell RNA-Seq data to explore corroboration with our human data implicating medullar gene expression and FCO proportions [Citation58]. We identified human orthologs of mouse renal cell-specific genes to evaluate whether the FCO proportion of human kidneys would align with results for proximal and distal tubule, the loop of Henle, and principal collecting duct cells (). The FCO proportion and metagene expression scores associated with FCO proportion were positively correlated with the expression of orthologs of ascending limb of the loop of Henle and the principal cell collecting duct, which are both medullar structures. By contrast, the FCO proportion and associated metagenes were both inversely related to the scores based on the orthologs of proximal and distal tubular cells located in the renal cortex. These data indicate that human orthologs of mouse renal cell-specific genes display features consistent with human kidney in pointing to FCO related expression within medullar anatomic regions.
Corroboration of renal medullary expression of FCO related genes using microdissected rat RNA-Seq nephron data
An orthogonal approach to our analysis of mouse expression data was undertaken to map 458 human FCO-related genes (Suppl Table 10) to orthologous genes within the extensive database of rat glomerulus and 16 nephron segments. Then, we used t-SNE to plot FCO associated genes to test whether human FCO related gene expression maps to specific regions of the rat nephron, which revealed six regional nephric clusters as shown in . We then tested whether influential genes that clustered cortical and medullar regions of the kidney were associated with the FCO proportion. In , 30 of the most significant genes (Suppl Table 11) and their Spearman’s correlation with the FCO proportion were aligned with renal anatomic position. Glomeruli and proximal tubular clusters were clustered by genes negatively associated with the FCO whereas collecting ducts and distal tubules were predominately clustered by genes positively associated with the FCO proportion. These results indicate that human genes associated with the FCO proportion are highly influential in the rat nephron as differentiating glomerulus and proximal tubules from distal tubule and collecting ducts, supporting the generalizability of the FCO as a strong correlative of medullar gene expression as compared to cortical gene expression.
FCO proportion is a prognostic factor in clear cell renal cancer
Recursive partitioning analysis was employed to investigate if FCO proportion was associated with survival in clear cell renal cancer using the TCGA database. Three distinct risk groups were identified. The high-risk group (n = 121; black group in , median overall survival (OS) 3.1 years) included patients over 62 years old whose tumours were T3/T4 stage, or patients under 62 with left/bilateral tumour location; or patients over 74 with T1/T2 stage tumours (median OS 3.1 years). The Intermediate risk group (n = 93; red group in , median OS 7.8 years) included patients under 62 with T3/T4 right tumour location; or patients under 74 with T1/T2 and FCO equal to 0. The low-risk group (n = 103; green group in , >75% surviving past 5 years) included patients under 74 with T1/T2 tumours and an FCO greater than 0 (median OS NA). These low-risk patients were at an 80% reduced risk of death (hazard ratio: 0.19, 95% CI (0.09, 0.41)) compared to those with similar age and stage whose FCO equal 0 (red group to right of green group, ). Of 319 TCGA tumours, 162 (50.8%) demonstrated non-detectable FCO levels that were most prevalent among T3/T4 stage tumours (). In patients under 74 with T1/T2 tumours, an FCO proportion >0 was associated with an 80% reduction in the risk of death.
Discussion
Widespread foetal methylation in adult kidney and age dependence of FCO proportions
The observed plasticity of adult renal epithelial cells prompted our studies of DMRs in embryonic and foetal genes. The kidney had the highest FCO proportions of any adult tissue examined, indicating a large portion of the kidney may have an ontogeny traceable to foetal cells. In comparison, leukocytes and most other solid organs in adults display non-detectable or low FCO proportions. Kidney samples from adult chronic kidney disease patients had lower FCO proportions than non-diseased samples, implicating clinical pathology as one factor influencing the FCO signature. Non-diseased and micro-dissected samples enriched in the renal cortex’s proximal tubules displayed lower FCO scores compared to TCGA normal samples, which were all sampled without regard to anatomic depth. We interpret these latter observations as cell composition and renal pathology rather than donor age, explaining individual variation in FCO proportions after childhood. Analysis of FCO methylation within individual kidney cells could directly test this hypothesis, but data quality and zero inflation limitations from single-cell methylation measures are currently prohibitive. In addition, comprehensive DNA methylation analysis of defined kidney segments does not exist in any species. We hypothesized that recent sequence-based gene expression studies could bridge the kidney structure and the FCO signature. Utilizing gene expression data from biopsies taken at different depths indicated that overall, 33% of individual variation in the adult FCO proportion might be explained by variations in the cell composition of kidney samples, which has critical implications for the study of kidney pathophysiology.
Gene expression correlated with FCO proportions in human kidney
Our genome-wide scans of nondissected TCGA normal samples revealed a dramatic negative association of the FCO proportion with immune response genes. Transcripts encoding lineage differentiation factors and effector molecules of adaptive and innate immune cells (e.g., B-cell antibody synthesis) were prominent among the genes most negatively correlated with FCO proportion. This result is consistent with the idea that immune cells in the kidney are of haematopoietic origin, which are derived from adult stem cells and do not contain foetal methylation marks, and consistent with gene expression data from non-dissected mouse kidney [Citation58]. Moreover, inflammatory signatures were also inversely related to FCO proportions.
Focusing on gene expression positively correlated with the FCO proportion identified epithelial cell-derived transcripts prominent in regions of the distal nephron as compared with the glomerulus and proximal tubules, which are contained within the renal cortex. This conclusion is supported by three sets of empirical observations using human data. First, genes whose expression levels were positively correlated with the FCO proportion were enriched for gene ontology terms including loop of Henle and distal nephron development. Second, expression signatures based on these genes demonstrated strong associations with genes signalling medullar and cortico-medullary location in biopsy samples of different depth. Also, strong inverse correlations of FCO related gene expression were observed with metagenes of renal cortex and cortico-medullary depth biopsy. Finally, previously established co-expression modules of the distal nephron were most strongly associated with the expression of FCO related genes. As observed with the biopsy depth correlations, the co-expression modules that mapped to the glomerulus and proximal segments were inversely associated with FCO metagenes. FCO proportions and gene expression positively correlated with those proportions localized preferentially to medullary regions of the human kidney.
Mouse and rat expression data corroborate medulla associated DGE patterns
Though the FCO signature has only been studied in humans, we reasoned that postnatal maintenance of foetal epigenetic features is fundamental in mammalian renal biology. While extensive conservation in gene expression is observed between human and rodent kidney, there is reported inter-species divergence in quantitative gene expression, especially at the nephron substructure level [Citation98,Citation99]. To minimize potential bias in our analyses, we normalized expression levels in each species and employed metagene signatures that averaged relative expression over groups of co-expressed genes to de-emphasize individual genes. Human orthologs of cell discriminating genes identified in the mouse kidney [Citation58] had a linear relationship between their expression levels tested and FCO proportion in human samples for the loop of Henle and principal cells of the collecting ducts. In sharp contrast, we found strong inverse relationships of expression with FCO for orthologs of mouse proximal and distal convoluted cell discriminating genes, which are restricted to the renal cortex. Thus, mouse renal cell expression signatures based on single-cell analyses provide a picture consistent with human co-expression models and renal biopsy depth results. This observation strengthens the link between FCO proportions and DGE patterns within medulla in contrast to renal cortical regions.
We also applied an orthogonal approach to our mouse studies by mapping human FCO related genes to their corresponding segments in the rat nephron. We employed t-SNE and clustering of human FCO related genes that have expressed rat homologues and mapped their expression levels across the glomerulus and rat nephron tubular segments. The resulting clusters delineated six regions corresponding to glomeruli and portions of the proximal and distal tubules and collecting ducts. While the FCO related clusters did not differentiate the full substructure of the nephron, they did achieve broad regional patterning with good correspondence between influential members of each cluster to an anatomic region and the directionality of the input gene’s correlation with the FCO proportion in humans. For example, medullary collecting duct segments were clustered by genes positively associated with the FCO proportion, whereas glomerular and proximal segments were clustered by genes negatively correlated with the human FCO proportion. We further note that clear discrimination of all nephron substructures has not been achieved even when using the full complement of expressed rat transcripts. Therefore, we judge that our results, using only 458 transcripts, are highly informative. The FCO proportion demonstrates biological relevance by ordering DGE patterns that contribute to regional transcriptional identity.
Repair hypothesis and renal stem cells
Considering the possible role of foetal epigenetic features leads to consideration of their potential relationship to stem cells. The role of stem cells in tissue homoeostasis and repair in the adult kidney has been extensively studied [Citation7,Citation16]. In contrast to tissues with high cell turnover such as the gut and bone marrow that have well-defined stem cell compartments, the kidney tubular epithelium, with its low rate of homoeostatic cell division, and highly segmented architecture, appears to have evolved a more distributive regenerative capacity. Early studies pointed to the extensive capacity of renal epithelial cells to dedifferentiate and redifferentiate during neoepithelialization after acute injuries [Citation10]. Fully differentiated epithelia were shown to regenerate the proximal tubule without any contribution from a pre-existing intratubular stem cell population [Citation100]. Anatomic-specific progenitor cell niches have been proposed for glomerulus, proximal tubules and medullary papillae [Citation101]. In the mouse, developmental stage affected the distribution of putative stem cells across medullar and cortical regions [Citation102]. Response to renal artery occlusion in the medullary papilla indicated that repair is regionally specified [Citation14]. The renal papilla itself, with its low oxygen content, has been proposed to be a good candidate for a stem cell niche environment [Citation101]. In the adult, hypoxic cell niches provide favourable conditions for maintenance of stable long-lived dormant stem cells [Citation103,Citation104]. Hypoxia and associated glycolytic metabolism may play a protective role and provide signals to stem cells that help maintain them in a prolonged undifferentiated state [Citation105,Citation106]. Consistent with this, we observed that metagene expression signatures of both hypoxia and glycolysis were positively correlated with FCO proportions in normal adult kidney.
The epigenetic mechanisms underlying different epithelial maintenance and repair strategies are unclear, and we believe our results provide new insights into these processes. Following insult or damage, increased transcription of nephrogenic genes is well documented, and among these are FCO genes with specific foetal methylation features. Prior studies established the role of PAX8, HOXB7, and FGF2 in the early stages of nephrogenesis and in response to injury in the adult organ. For each of these genes, we found DMRs exhibiting foetal patterns of unmethylated DNA in adult kidneys. Notably, these DMRs were correlated with differential gene expression levels. These observations suggest that the CpG methylation status of FCO-related genes plays a regulatory role in the kidney; they likely do not just act as biomarkers of cell ontogeny. In the normal kidney samples we studied, the differences in gene expression could be contributing to homoeostasis. The maintenance and regeneration of a highly segmented epithelium like the nephron with its distinct cell compartments may require an epigenetic programme that retains capacity to direct regionalization and segment specialization. This idea fits with the enrichment of regionalization, kidney epithelial differentiation, and segment specification ontology terms that we found among DGE patterns associated with FCO proportions. The widespread foetal methylation signature we report here may help programme the hypothesized multiple pools of progenitor cells of the kidney [Citation14].
Renal cancer survival and the FCO proportion in tumour cells
Contrary to expectations, the FCO proportion of tumours was strongly associated with lower stage tumours and longer survival times. Renal cancer stem cells track with higher grade and stage tumours and shorter patient survival times. These observations point to a clear distinction of the cancer stem cell and foetal cell origin concepts with respect to the clinical behaviour of kidney cancer. The non-detectable FCO levels were most prevalent among T3/T4 stage tumours. In patients under 74 with T1/T2 tumours, an FCO proportion >0 was associated with a significant reduction in the risk of death. This suggests the FCO proportion may help discriminate against similarly staged patients. Although FCO negative tumours may have a different cell of origin, it is also possible that non-detectable FCO proportions represent a loss of foetal methylation features resulting from epigenomic instability. Preserving the methylation status of the block of CpG sites in the FCO gene set during proliferative expansion may require efficient mechanisms to prevent hypermethylation. It is not surprising that malignant transformation could lead to a loss of the FCO signature due to disruption of the epigenetic machinery. A universal feature of solid tumours is that they display significantly lower FCO proportions than their respective normal tissues [Citation32]. This may result in part from mutations or other acquired disruptions in epigenetic regulation, common in clear cell renal cancer and other tumours. However, we did not observe any associations of TCGA recorded mutations, specific DNA methylation signatures, or tumour purity estimates with the FCO scores of tumours. Therefore, we view the FCO proportion as a potentially unique tumour marker representing epigenome stability and improved renal cancer survival.
Limitations and conclusions
The current study is the first to suggest a functional role of conserved DNA methylation marks present in embryonic and foetal cells in differentiated adult cells’ biology. However, our observations’ correlative nature precludes us from definitively assigning any direct regulatory function to the DMRs within the FCO. Another limitation is that we do not have FCO measurements within isolated cells of the human kidney. This level of analysis is essentially prohibitive in any species. Given this limitation, our current view of a widespread epigenetic compartment in adult kidneys must await significant technical advances in renal epigenomics before we are able to move beyond correlative observations. Even though, we used the most comprehensive human samples available, they still constitute macrodissected biopsies from nephrectomy samples for renal cancer. Previous studies have indicated that gene expression from nephrectomy samples are not biased to normal kidney tissues [Citation87]. However, more baseline data in the non-diseased kidney is needed. These limitations reinforce the importance of animal models that do provide high-resolution data. To corroborate our human data, we mapped FCO correlated gene expression with nephron segment-specific data in rodents. FCO-related genes positively correlated with medulla and distal tubular location in mouse and rat nephron were strongly correlated with medulla metagene signatures obtained from human biopsies. We acknowledge that divergence in substructure gene expression may limit the translation of these results across species.
Our study’s broader implication is that the kidney appears to represent an archetypal example of a widespread niche of foetal derived cells in an adult epithelial tissue. Previous researchers have drawn attention to the renal medulla’s hypoxic conditions and its resemblance to conditions in embryonic and foetal life. Such hypoxic regions, which support stem cell survival, occur throughout the body [Citation107]. The development of computational tools and cell ontogeny methylation markers applicable to human tissues provide a path for future research to elucidate the role of conserved foetal epigenetic programs in tissue homoeostasis and regeneration.
Author contributions
Conceptualization, J.K.W., Z.Z., K.T.K.; Methodology, J.K.W., Z.Z.; Software, Z.Z, DCK, L.A.S.
Formal Analysis, Z.Z, DCK, L.A.S.; Investigation, J.K.W., Z.Z., Z.Z, DCK, L.A.S., A.M.M., B.C.C., K.T.K.; Data Curation, Z.Z, DCK, L.A.S.; Writing – Original Draft, J.K.W., Z.Z.; Writing-Review & Editing, J.K.W., Z.Z., Z.Z, DCK, L.A.S., A.M.M., B.C.C., K.T.K.; Visualization, Z.Z, DCK; Supervision, J.K.W., K.T.K.; Project Administration, J.K.W., K.T.K.; Funding Acquisition, J.K.W.
Abbreviations
DGE: differential gene expression; DMR: differentially methylated region; FGF2: basic fibroblast growth factor 2; FCO: foetal cell origin; IHC: immunohistochemistry; OS: overall survival; PAX8: paired box transcription factor 8; HOXB7: homeobox B7; TCGA: Tumour Cell Genome Atlas; GEO: Gene Expression Omnibus; ESBL: Epithelial Systems Biology Laboratory.
Supplemental Material
Download Zip (5.8 MB)Acknowledgments
Work was supported by the National Institutes of Health with grants R01CA207360, and P50CA097257 to J.K.W. and A.M.M., R01CA207110 to K.T.K., and R01DE022772 and R01CA216265 to B.C.C. L.A.S. is supported by the National Institute of General Medical Science award P20GM1044168299 and the Congressionally Directed Medical Research Programs/Department of Defense W81XWH-20-1-0778. Support to J.K.W. and A.M.M. was also provided by the loglio Collective and to J.K.W. by the Robert Magnin Newman Endowed Chair in Neurooncology. D.C.K. was supported by the National Cancer Institute (NCI) Cancer Center Support Grant P30 CA168524 and by the Kansas IDeA Network of Biomedical Research Excellence (K-INBRE) Bioinformatics Core, supported in part by the National Institute of General Medical Science award P20GM103418.
Disclosure statement
J.K.W. and K.T.K. are cofounders of Cellintec.
Supplementary material
Supplemental data for this article can be accessed here.
Additional information
Funding
Related Research Data
References
- Schofield R. The relationship between the spleen colony-forming cell and the haemopoietic stem cell. Blood Cells. 1978;4(1–2):7–25.
- Crane GM, Jeffery E, Morrison SJ. Adult haematopoietic stem cell niches. Nat Rev Immunol. 2017;17(9):573–590.
- Tan DW, Barker N. Intestinal stem cells and their defining niche. Curr Top Dev Biol. 2014;107:77–107.
- Mohyeldin A, Garzon-Muvdi T, Quinones-Hinojosa A. Oxygen in stem cell biology: a critical component of the stem cell niche. Cell Stem Cell. 2010;7(2):150–161.
- Witzgall R, Brown D, Schwarz C, et al. Localization of proliferating cell nuclear antigen, vimentin, c-Fos, and clusterin in the postischemic kidney. Evidence for a heterogenous genetic response among nephron segments, and a large pool of mitotically active and dedifferentiated cells. J Clin Invest. 1994;93(5):2175–2188.
- Bonventre JV. Dedifferentiation and proliferation of surviving epithelial cells in acute renal failure. J Am Soc Nephrol. 2003;14(Suppl 1):S55–61.
- Humphreys BD, Czerniak S, DiRocco DP, et al. Repair of injured proximal tubule does not involve specialized progenitors. Proc Natl Acad Sci U S A. 2011;108(22):9226–9231.
- Angelotti ML, Ronconi E, Ballerini L, et al. Characterization of renal progenitors committed toward tubular lineage and their regenerative potential in renal tubular injury. Stem Cells. 2012;30:1714–1725.
- Villanueva S, Cespedes C, Vio CP. Ischemic acute renal failure induces the expression of a wide range of nephrogenic proteins. Am J Physiol Regul Integr Comp Physiol. 2006;290(4):R861–870.
- Oliver JA, Maarouf O, Cheema FH, et al. The renal papilla is a niche for adult kidney stem cells. J Clin Invest. 2004;114(6):795–804
- Vogetseder A, Karadeniz A, Kaissling B, et al. Tubular cell proliferation in the healthy rat kidney. Histochem Cell Biol. 2005;124(2):97–104.
- Oliver JA. Adult renal stem cells and renal repair. Curr Opin Nephrol Hypertens. 2004;13(1):17–22.
- Oliver JA, Maarouf O, Cheema FH, et al. The renal papilla is a niche for adult kidney stem cells. J Clin Invest. 2004;114(6):795–804.
- Oliver JA, Sampogna RV, Jalal S, et al. A subpopulation of label-retaining cells of the kidney papilla regenerates injured kidney medullary tubules. Stem Cell Reports. 2016;6(5):757–771.
- Kramann R, Kusaba T, Humphreys BD. Who regenerates the kidney tubule? Nephrol Dial Transplant. 2015;30(6):903–910.
- Little MH, Kairath P. Does renal repair recapitulate kidney development? J Am Soc Nephrol. 2017;28(1):34–46.
- Yatabe Y, Tavare S, Shibata D. Investigating stem cells in human colon by using methylation patterns. Proc Natl Acad Sci U S A. 2001;98(19):10839–10844.
- Roost MS, Slieker RC, Bialecka M, et al. DNA methylation and transcriptional trajectories during human development and reprogramming of isogenic pluripotent stem cells. Nat Commun. 2017;8(1):908.
- Hiler D, Chen X, Hazen J, et al. Quantification of retinogenesis in 3D cultures reveals epigenetic memory and higher efficiency in iPSCs derived from rod photoreceptors. Cell Stem Cell. 2015;17(1):101–115.
- Hu Q, Friedrich AM, Johnson LV, et al. Memory in induced pluripotent stem cells: reprogrammed human retinal-pigmented epithelial cells show tendency for spontaneous redifferentiation. Stem Cells. 2010;28(11):1981–1991.
- Hargus G, Ehrlich M, Arauzo-Bravo MJ, et al. Origin-dependent neural cell identities in differentiated human iPSCs in vitro and after transplantation into the mouse brain. Cell Rep. 2014;8(6):1697–1703.
- Bar-Nur O, Russ HA, Efrat S, et al. Epigenetic memory and preferential lineage-specific differentiation in induced pluripotent stem cells derived from human pancreatic islet beta cells. Cell Stem Cell. 2011;9(1):17–23.
- Quattrocelli M, Swinnen M, Giacomazzi G, et al. Mesodermal iPSC-derived progenitor cells functionally regenerate cardiac and skeletal muscle. J Clin Invest. 2015;125(12):4463–4482.
- Kim K, Zhao R, Doi A, et al. Donor cell type can influence the epigenome and differentiation potential of human induced pluripotent stem cells. Nat Biotechnol. 2011;29(12):1117–1119.
- Vitaloni M, Pulecio J, Bilic J, et al. MicroRNAs contribute to induced pluripotent stem cell somatic donor memory. J Biol Chem. 2014;289(4):2084–2098.
- Polo JM, Liu S, Figueroa ME, et al. Cell type of origin influences the molecular and functional properties of mouse induced pluripotent stem cells. Nat Biotechnol. 2010;28(8):848–855.
- Ohi Y, Qin H, Hong C, et al. Incomplete DNA methylation underlies a transcriptional memory of somatic cells in human iPS cells. Nat Cell Biol. 2011;13(5):541–549.
- Salas LA, Wiencke JK, Koestler DC, et al. Tracing human stem cell lineage during development using DNA methylation. Genome Res. 2018;28(9):1285–1295.
- Orkin SH, Zon LI. Hematopoiesis: an evolving paradigm for stem cell biology. Cell. 2008;132(4):631–644.
- Copley MR, Eaves CJ. Developmental changes in hematopoietic stem cell properties. Exp Mol Med. 2013;45(11):e55.
- Manesia JK, Franch M, Tabas-Madrid D, et al. Distinct molecular signature of murine fetal liver and adult hematopoietic stem cells identify novel regulators of hematopoietic stem cell function. Stem Cells Dev. 2017;26(8):573–584.
- Zhang Z, Wiencke JK, Koestler DC, et al. Absence of an embryonic stem cell DNA methylation signature in human cancer. BMC Cancer. 2019;19(1):711.
- McMahon AP. Development of the mammalian kidney. Curr Top Dev Biol. 2016;117:31–64.
- Lee JW, Chou CL, Knepper MA. Deep sequencing in microdissected renal tubules identifies nephron segment-specific transcriptomes. J Am Soc Nephrol. 2015;26(11):2669–2677.
- Higgins JP, Wang L, Kambham N, et al. Gene expression in the normal adult human kidney assessed by complementary DNA microarray. Mol Biol Cell. 2004;15(2):649–656.
- Papadopoulos T, Krochmal M, Cisek K, et al. Omics databases on kidney disease: where they can be found and how to benefit from them. Clin Kidney J. 2016;9(3):343–352.
- Brezis M, Rosen S. Hypoxia of the renal medulla–its implications for disease. N Engl J Med. 1995;332(10):647–655.
- Russell PS, Hong J, Windsor JA, et al. Renal lymphatics: anatomy, physiology, and clinical implications. Front Physiol. 2019;10:251.
- Neuhofer W, Beck FX. Survival in hostile environments: strategies of renal medullary cells. Physiology (Bethesda). 2006;21:171–180.
- Chen Y, Fry BC, Layton AT. Modeling glucose metabolism and lactate production in the kidney. Math Biosci. 2017;289:116–129.
- Jauniaux E, Gulbis B, Burton GJ. Physiological implications of the materno-fetal oxygen gradient in human early pregnancy. Reprod Biomed Online. 2003;7(2):250–253.
- Dunwoodie SL. The role of hypoxia in development of the mammalian embryo. Dev Cell. 2009;17(6):755–773.
- Patel SR, Ranghini E, Dressler GR. Mechanisms of gene activation and repression by pax proteins in the developing kidney. Pediatr Nephrol. 2014;29(4):589–595.
- Kobayashi A, Valerius MT, Mugford JW, et al. Six2 defines and regulates a multipotent self-renewing nephron progenitor population throughout mammalian kidney development. Cell Stem Cell. 2008;3(2):169–181.
- Humphreys BD, Valerius MT, Kobayashi A, et al. Intrinsic epithelial cells repair the kidney after injury. Cell Stem Cell. 2008;2(3):284–291.
- Sharma R, Sanchez-Ferras O, Bouchard M. Pax genes in renal development, disease and regeneration. Semin Cell Dev Biol. 2015;44:97–106.
- Alarcon P, Rodriguez-Seguel E, Fernandez-Gonzalez A, et al. A dual requirement for Iroquois genes during xenopus kidney development. Dev. 2008;135(19):3197–3207.
- Massa F, Garbay S, Bouvier R, et al. Hepatocyte nuclear factor 1beta controls nephron tubular development. Dev. 2013;140(4):886–896.
- Heliot C, Desgrange A, Buisson I, et al. HNF1B controls proximal-intermediate nephron segment identity in vertebrates by regulating notch signalling components and Irx1/2. Dev. 2013;140(4):873–885.
- Patterson LT, Potter SS. Atlas of Hox gene expression in the developing kidney. Dev Dyn. 2004;229(4):771–779.
- Pickering CM, Grady C, Medvar B, et al. Proteomic profiling of nuclear fractions from native renal inner medullary collecting duct cells. Physiol Genomics. 2016;48(2):154–166.
- Walker KA, Sims-Lucas S, Bates CM. Fibroblast growth factor receptor signaling in kidney and lower urinary tract development. Pediatr Nephrol. 2016;31(6):885–895.
- Villanueva S, Cespedes C, Gonzalez AA, et al. Inhibition of bFGF-receptor type 2 increases kidney damage and suppresses nephrogenic protein expression after ischemic acute renal failure. Am J Physiol Regul Integr Comp Physiol. 2008;294:R819–828.
- Villanueva S, Cespedes C, Gonzalez A, et al. bFGF induces an earlier expression of nephrogenic proteins after ischemic acute renal failure. Am J Physiol Regul Integr Comp Physiol. 2006;291:R1677–1687.
- Villanueva S, Glavic A, Ruiz P, et al. Posteriorization by FGF, Wnt, and retinoic acid is required for neural crest induction. Dev Biol. 2002;241(2):289–301.
- Lindgren D, Eriksson P, Krawczyk K, et al. Cell-type-specific gene programs of the normal human nephron define kidney cancer subtypes. Cell Rep. 2017;20(6):1476–1489.
- Lindgren D, Sjolund J, Axelson H. tracing renal cell carcinomas back to the nephron. Trends Cancer. 2018;4:472–484.
- Park J, Shrestha R, Qiu C, et al. Single-cell transcriptomics of the mouse kidney reveals potential cellular targets of kidney disease. Sci. 2018;360(6390):758–763.
- Saroufim A, Messai Y, Hasmim M, et al. Tumoral CD105 is a novel independent prognostic marker for prognosis in clear-cell renal cell carcinoma. Br J Cancer. 2014;110(7):1778–1784.
- Mikami S, Mizuno R, Kosaka T, et al. Expression of TNF-alpha and CD44 is implicated in poor prognosis, cancer cell invasion, metastasis and resistance to the sunitinib treatment in clear cell renal cell carcinomas. Int J Cancer. 2015;136(7):1504–1514.
- Li X, Ma X, Chen L, et al. Prognostic value of CD44 expression in renal cell carcinoma: a systematic review and meta-analysis. Sci Rep. 2015;5(1):13157.
- Peired AJ, Sisti A, Romagnani P. Mesenchymal stem cell-based therapy for kidney disease: a review of clinical evidence. Stem Cells Int. 2016;2016:4798639.
- Farkas SA, Milutin-Gasperov N, Grce M, et al. Genome-wide DNA methylation assay reveals novel candidate biomarker genes in cervical cancer. Epigenet. 2013;8(11):1213–1225.
- Smith RG, Hannon E, De Jager PL, et al. Elevated DNA methylation across a 48-kb region spanning the HOXA gene cluster is associated with Alzheimer’s disease neuropathology. Alzheimers Dement. 2018;14(12):1580–1588.
- Legendre CR, Demeure MJ, Whitsett TG, et al. Pathway implications of aberrant global methylation in adrenocortical cancer. PLoS One. 2016;11(3):e0150629.
- Huang KK, Ramnarayanan K, Zhu F, et al. Genomic and epigenomic profiling of high-risk intestinal metaplasia reveals molecular determinants of progression to gastric cancer. Cancer Cell. 2018;33(1):137–150 e135.
- Price EM, Penaherrera MS, Portales-Casamar E, et al. Profiling placental and fetal DNA methylation in human neural tube defects. Epigenet Chromatin. 2016;9(1):6.
- Charlton J, Williams RD, Weeks M, et al. Methylome analysis identifies a wilms tumor epigenetic biomarker detectable in blood. Genome Biol. 2014;15(8):434.
- Ko YA, Mohtat D, Suzuki M, et al. Cytosine methylation changes in enhancer regions of core pro-fibrotic genes characterize kidney fibrosis development. Genome Biol. 2013;14(10):R108.
- Acevedo N, Reinius LE, Vitezic M, et al. Age-associated DNA methylation changes in immune genes, histone modifiers and chromatin remodeling factors within 5 years after birth in human blood leukocytes. Clin Epigenetics. 2015;7(1):34.
- Urdinguio RG, Torro MI, Bayon GF, et al. Longitudinal study of DNA methylation during the first 5 years of life. J Transl Med. 2016;14:160.
- Alisch RS, arwick BG, Chopra P, et al. Age-associated DNA methylation in pediatric populations. Genome Res. 2012;22(4):623–632.
- Hannum G, Guinney J, Zhao L, et al. Genome-wide methylation profiles reveal quantitative views of human aging rates. Mol Cell. 2013;49(2):359–367.
- Reinius LE, Acevedo N, Joerink M, et al. Differential DNA methylation in purified human blood cells: implications for cell lineage and studies on disease susceptibility. PLoS One. 2012;7(7):e41361.
- Tserel L, Kolde R, Limbach M, et al. Age-related profiling of DNA methylation in CD8+ T cells reveals changes in immune response and transcriptional regulator genes. Sci Rep. 2015;5(1):13107.
- Heyn H, Li N, Ferreira HJ, et al. Distinct DNA methylomes of newborns and centenarians. Proc Natl Acad Sci U S A. 2012;109(26):10522–10527.
- Bakulski KM, Feinberg JI, Andrews SV, et al. DNA methylation of cord blood cell types: Applications for mixed cell birth studies. Epigenetics. 2016;11(5):354–362
- Gervin K, Page CM, Aass HC, et al. Cell type specific DNA methylation in cord blood: A 450K-reference data set and cell count-based validation of estimated cell type composition. Epigenetics. 2016;11(9):690–698.
- Hart T, Komori HK, LaMere S, et al. Finding the active genes in deep RNA-seq gene expression studies. BMC Genomics. 2013;14(1):778.
- Laurens Van Der Maaten GH. visualizing data using t-SNE. J Mach Learn Res. 2008;9:2579-2605.
- Krijthe JH Rtsne: t-distributed stochastic neighbor embedding using a barnes-hut implementation. (2015).
- Anders S, Pyl PT, Huber W. HTSeq–a Python framework to work with high-throughput sequencing data. Bioinf. 2015;31:166–169.
- Bakulski KM, Feinberg JI, Andrews SV, et al. DNA methylation of cord blood cell types: applications for mixed cell birth studies. Epigenet. 2016;11(5):354–362.
- Houseman EA, Accomando WP, Koestler DC, et al. DNA methylation arrays as surrogate measures of cell mixture distribution. BMC Bioinf. 2012;13:86.
- Zhou Y, Zhou B, Pache L, et al. Metascape provides a biologist-oriented resource for the analysis of systems-level datasets. Nat Commun. 2019;10(1):1523.
- Flechner SM, Kurian SM, Head SR, et al. Kidney transplant rejection and tissue injury by gene profiling of biopsies and peripheral blood lymphocytes. Am J Transplant. 2004;4(9):1475–1489.
- Rodwell GE, Sonu R, Zahn JM, et al. A transcriptional profile of aging in the human kidney. PLoS Biol. 2004;2(12):e427.
- Molinaro AM, Lostritto K, Van Der Laan M. partDSA: deletion/substitution/addition algorithm for partitioning the covariate space in prediction. Bioinf. 2010;26(10):1357–1363.
- Lostritto K, Strawderman RL, Molinaro AM. A partitioning deletion/substitution/addition algorithm for creating survival risk groups. Biom. 2012;68(4):1146–1156.
- Stewart BJ, Ferdinand JR, Young MD, et al. Spatiotemporal immune zonation of the human kidney. Sci. 2019;365(6460):1461–1466.
- Wegener AM, Letourneur F, Hoeveler A, et al. The T cell receptor/CD3 complex is composed of at least two autonomous transduction modules. Cell. 1992;68(1):83–95.
- Hamilton KL, Devor DC. Basolateral membrane K+ channels in renal epithelial cells. Am J Physiol Renal Physiol. 2012;302(9):F1069–1081.
- Pulkkinen K, Murugan S, Vainio S. Wnt signaling in kidney development and disease. Organogenesis. 2008;4(2):55–59.
- Chen F. Genetic and developmental basis for urinary tract obstruction. Pediatr Nephrol. 2009;24(9):1621–1632.
- Vogels R, Charite J, De Graaff W, et al. Proximal cis-acting elements cooperate to set Hoxb-7 (Hox-2.3) expression boundaries in transgenic mice. Dev. 1993;118:71–82.
- Narlis M, Grote D, Gaitan Y, et al. Pax2 and Pax8 regulate branching morphogenesis and nephron differentiation in the developing kidney. J Am Soc Nephrol. 2007;18(4):1121–1129.
- Hamilton KL, Devor DC. Basolateral membrane K+ channels in renal epithelial cells. Am J Physiol Renal Physiol. 2012;302(9):F1069–F1081.
- Lindstrom NO, Tran T, Guo J, et al. Conserved and divergent molecular and anatomic features of human and mouse nephron patterning. J Am Soc Nephrol. 2018;29(3):825–840.
- Cheval L, Pierrat F, Rajerison R, et al. Of mice and men: divergence of gene expression patterns in kidney. PLoS One. 2012;7(10):e46876.
- Kusaba T, Lalli M, Kramann R, et al. Differentiated kidney epithelial cells repair injured proximal tubule. Proc Natl Acad Sci U S A. 2014;111(4):1527–1532.
- Huling J, Yoo JJ. Comparing adult renal stem cell identification, characterization and applications. J Biomed Sci. 2017;24(1):32.
- Rangarajan S, Sunil B, Fan C, et al. Distinct populations of label-retaining cells in the adult kidney are defined temporally and exhibit divergent regional distributions. Am J Physiol Renal Physiol. 2014;307(11):F1274–1282.
- Nombela-Arrieta C, Pivarnik G, Winkel B, et al. Quantitative imaging of haematopoietic stem and progenitor cell localization and hypoxic status in the bone marrow microenvironment. Nat Cell Biol. 2013;15(5):533–543.
- Ito K, Suda T. Metabolic requirements for the maintenance of self-renewing stem cells. Nat Rev Mol Cell Biol. 2014;15(4):243–256.
- Suda T, Takubo K, Semenza GL. Metabolic regulation of hematopoietic stem cells in the hypoxic niche. Cell Stem Cell. 2011;9(4):298–310.
- Morikawa T, Takubo K. Hypoxia regulates the hematopoietic stem cell niche. Pflugers Arch. 2016;468(1):13–22.
- Redondo PA, Pavlou M, Loizidou M, et al. Elements of the niche for adult stem cell expansion. J Tissue Eng. 2017;8:2041731417725464.