
ABSTRACT
Anthropogenic pollution is known to negatively influence an organism’s physiology, behaviour, and fitness. Epigenetic regulation, such as DNA methylation, has been hypothesized as a potential mechanism to mediate such effects, yet studies in wild species are lacking. We first investigated the effects of early-life exposure to the heavy metal lead (Pb) on DNA methylation levels in a wild population of great tits (Parus major), by experimentally exposing nestlings to Pb at environmentally relevant levels. Secondly, we compared nestling DNA methylation from a population exposed to long-term heavy metal pollution (close to a copper smelter), where birds suffer from pollution-related decrease in food quality, and a control population. For both comparisons, the analysis of about one million CpGs covering most of the annotated genes revealed that pollution-related changes in DNA methylation were not genome wide, but enriched for genes underlying developmental processes. However, the results were not consistent when using binomial or beta binomial regression highlighting the difficulty of modelling variance in CpGs. Our study indicates that post-natal anthropogenic heavy metal exposure can affect methylation levels of development related genes in a wild bird population.
Introduction
Epigenetic control of gene expression, such as DNA methylation, is increasingly recognized as playing a major role in many different cellular processes. DNA methylation is the addition of a methyl (-CH3) group to the 5' carbon site of cytosines catalysed by DNA-methyltransferases that occur mainly at CpG sites in animals. Especially in CpG islands within promotor regions, DNA methylation is found to be negatively associated with gene expression. Epigenetic changes are linked to variation in phenotype and behaviour and are associated with prevalence for various diseases [Citation1–3].
Methylation patterns can be affected by various environmental factors such as maternal nutrition and maternal care [Citation4–7], but also by various pollutants and other early-life stressors, both pre- and postnatally, as discovered in humans and mouse models [Citation8–12]. The potential effects of environmental factors on epigenetic regulation are highly important for ecological and ecotoxicological fields, but research in wild vertebrate populations is only emerging [Citation10,Citation13–19]. However, epigenetics can significantly improve our understanding of the mechanisms underlying natural phenotypic variation and the responses of organisms to environmental change [Citation18]. Furthermore, potential transgenerational epigenetic effects could explain why populations are slow to recover even after pollution removal [Citation9].
Heavy metals, such as Pb, are global, persistent human-induced pollutants that are among the potential contaminants affecting DNA methylation status [Citation20]. For example in human epidemiological studies, developing foetuses show a decrease in global methylation levels as a result of historical maternal Pb exposure and accumulation [Citation21,Citation22]. Furthermore, in rat, mouse and monkey models, experimental peri- and post-natal Pb exposure decreases DNA methyltransferase activity and affects DNA methylation, which are subsequently related to behavioural alternations [Citation23–29]. In birds, metal exposure has been found to affect offspring growth [Citation30] and multiple aspects of physiology, including stress hormone and stress protein levels [Citation31], oxidative stress levels [Citation32] and immune function [Citation33]. However, the potential epigenetic alterations by early-life exposure to metal pollution, potentially underlying such effects in birds, have not been studied.
In addition to the direct effect of metals, large-scale metal pollution can decrease resource availability and quality in wild populations [Citation34,Citation35], which could subsequently also influence methylation patterns: Along with toxicants, altered nutrition and diet, especially diet poor in methyl donors, are well-known epigenetic modifiers in animal models [Citation2, Citation36, Citation37]. Also protein or lipid-altered diets can cause major changes in the epigenome [Citation36,Citation38,Citation39]. All in all, we expect populations inhabiting polluted environments to have altered DNA methylation patterns, either due to direct or indirect pollution effects.
Here we investigated whether experimental and anthropogenic early-life exposure to the heavy metal Pb alters genome-wide DNA methylation status in a wild population of great tits (Parus major). First, we experimentally exposed nestlings to dietary Pb at levels found close to active pollution sources in Europe and compared to respective controls. The exposure covered the whole postnatal pre-fledging period. Second, we compared methylation patterns from nestlings in a population close to an anthropogenic pollution source, copper smelter [Citation40] to nestlings from an unpolluted population. Around the smelter, nestlings are exposed to multiple metals in low concentrations pre-and postnatally and experience an altered nutritional quality and quantity compared to controls. In our recent work using the same experimental protocol we found that Pb exposure and altered nutrition during nestling development lead to changes in e.g., growth, oxidative stress markers, stress protein levels and vitamin metabolism, but the mechanisms, potentially epigenetic regulation are not understood [Citation31,Citation41,Citation42].
Our objectives are two-fold. First, by comparing nestlings exposed to the experimental Pb treatment to the control group we aim to detect methylation changes directly induced by Pb during post-natal stage. Second, by comparing nestling methylation patterns from an environment with a long history of metal pollution, to an unpolluted population we aim to detect long term effects of pollutants on great tit methylation levels, that could be mediated via prenatal or postnatal metal exposure or via altered nutrition (latter coined as indirect effect of metal pollution). By these two comparisons we expect to find differentially methylated regions associated with genes that can potentially explain how wild bird populations cope with anthropogenic pollution. Given that there are not yet established standards for analysing methylation data in an ecological context, we used and compared two frequently used statistical methods to detect differentially methylated sites [Citation43,Citation44].
Methods
Study species
The great tit is a small passerine bird and a model species in ecological and evolutionary research, with ample ecological and genetic background information available. It is an insectivorous non-migratory bird that commonly breeds in nest boxes, making it an ideal species for experimental manipulations. Importantly, as one of the only non-domesticated bird species, both the genome and methylome are available [Citation45–47].
(1) Experimental Pb treatment and control population
The Pb exposure, dosages and sampling are described in detail in [Citation31,Citation41,Citation48]. Briefly, breeding was monitored to record hatching dates of great tit chicks in a population with low pollution levels in southwestern Finland (Turku, 60°26'N, 22°10'E). From day 3 after hatching (hatch date = 0) until day 14 (i.e., in total 12 days) whole broods were subjected to Pb with daily oral dosing with the following treatments: HIGH dose (4 µg Pb/g body mass, N = 15 broods) or CONTROL (distilled water, N = 15 broods). Based on calculations of faecal Pb levels in passerines at several polluted and reference sites across Europe [Citation35, Citation49–55] the estimated Pb intake averages 2.2–8.5 µg/g body mass daily in polluted and 0.2–0.5 µg/g in control areas. Therefore, the dose represented environmentally relevant exposure levels occurring in polluted areas in Europe. The exposure period covered most of the post-hatching nestling period, i.e., most important developmental period in altricial birds.
(2) Polluted environment: copper smelter population
The Harjavalta copper smelter (61°20'N, 22°10'E) was built in 1945 and great tits have been monitored since 1991 in the vicinity (<2 km) of the pollution source. Thus, this study site is suitable for investigating long-term exposure of several metals (e.g., Pb, arsenic, cadmium, copper, nickel) as well as lower food availability and quality [Citation34]. The Mean faecal Pb concentrations have varied between 8–10 µg/g (dry mass, geometric mean) [Citation56] in nestlings in SMELTER. Assuming two year generation time interval, great tits have been exposed to environmental pollution for about 12 generations after the study population was established by placing nest boxes. These nests were monitored in the same way as in HIGH and CONTROL and nestlings were dosed with distilled water. The sample in the SMELTER consisted of 19 nests. The smelter site is ca 95 km from the experimental site. The breeding habitat was similar in both CONTROL and SMELTER, representing pine dominated forests with mixed spruce and birch. However, in the CONTROL area some oaks were scattered in the forest. The same control group was used for HIGH and SMELTER comparisons.
Blood sampling protocol, DNA isolation and RRBS library preparation
Blood samples were collected from 7-day old nestlings for sex-determination [Citation57] and only females were chosen for CONTROL, HIGH, and SMELTER groups. Measurements were taken of multiple physiological indices [Citation31,Citation58]. Fresh faecal samples were collected for measuring metal concentrations (see below). Whole blood samples were collected directly in liquid nitrogen from nestlings at age of 14 days (i.e., after 12 days of treatment) for analyses of DNA methylation status and physiological indices. Samples were stored at −80°C until analysis. Ten unrelated (one nestling/brood) samples from female nestlings in HIGH and CONTROL groups, and eight samples from SMELTER group were selected randomly (total N = 28 samples). The experiment was conducted under licences from the Animal Experiment Committee of the State Provincial Office of Southern Finland (licence number ESAVI/846/ 04.10.03/2011) and the Centre for Economic Development, Transport and the Environment, ELY Centre Southwest Finland (licence number VARELY/149/07.01/2011). The details of the DNA isolation and RRBS library preparation are given in the supplementary material.
Metal analyses
For detailed analyses, see Citation31. Briefly, two faecal samples (one male and one female) from the same brood were combined to assess brood level metal exposure (total N = 35 broods). The determination of metal concentrations (As, Cd, Cu, Ni, Pb) was conducted with ICP-MS with detection limit of 1 ppt (ng/l) and below. The calibration of the instrument was done with a commercial multi-standard from Ultra Scientific, IMS–102, ICP-MS calibration standard 2 and certified reference materials were used for method validation. Data was analysed with GLMs (SAS 9.4) with Tukey post-hoc tests.
Bisulphite sequencing analysis
The initial quality check with Fastqc [Citation59] indicated presence of Illumina universal adapter contamination and low-quality (Q < 20) bases in the 3' end of the raw reads. The adapter sequences were removed with Cutadapt [Citation60] and the low-quality bases were filtered using Condentri [Citation61] with default settings. The quality filtered reads were then mapped against the great tit reference genome (Assembly Parus_major1.0.3; NCBI Bioproject PRJNA208335) [Citation46] using Bismark aligner with default parameters (L, 0, −0.2) allowing 2-3 mismatches or a comparable number of indels per 100 bp read [Citation62]. Methylation information was extracted from alignment files using the bismark_methylation_extractor tool [Citation62]. The resulting methylation levels per base pair were inspected to detect potential methylation bias in the beginning and in the end of read 1 and 2 [Citation63]. There was lower methylation in the beginning and higher in the end of read 2. Therefore, the first four bases and the last base were removed from the read 2 for subsequent analyses (supplementary figure 1). On average, we recovered 16.08 million raw reads (range 13.55–21.15) from each RRBS library and after quality filtering 11.72 million reads remained (range 10.12–15.06). On average 6.36 million (54%) of the quality filtered reads were uniquely mapped against the great tit reference genome. This translates to an average 322.45 million cytosine bases analysed, of which 179.95 million cytocines (56%) were methylated. We estimated the bisulphite conversion rate by aligning the reads against great tit mitochondrial DNA, which is mostly un-methylated [Citation64] and calculated the conversion rate as 1-methylation% in CpG context. The bisulphite conversion rate was 97.7–99.1%.
In order to call methylated CpG sites from the Bismark methylation extractor files, the function readBismarkCoverage in the R package Methylkit [Citation65] was used. Using a minimum coverage threshold of 10, on average 1 309,860 (range 1 062 814–1 545,820) methylated CpG sites were obtained for the CONTROL-HIGH comparison and 1,344,110 (range 1,062,814–1,774,992) CpG sites for the CONTROL-SMELTER comparison. The CpGs were then filtered by extreme coverage to remove e.g., potential PCR duplicates using 99.9% percentile upper threshold as implemented in the function filterByCoverage in R package Methylkit. Methylated CpG sites were also median normalized to take into account differing library sizes using normalizeCoverage function in R package Methylkit. Finally, CpG sites were united such that the data set contained only CpG sites covered by a minimum of seven individuals per group. The subsequent data sets comprised 1,023,725 and 903,449 CpG sites for CONTROL-HIGH and CONTROL-SMELTER comparisons, respectively. 879,056 CpG sites were shared between these two comparisons. The range of mean and median coverage was 25.94–33.31 and 17–27 in the CONTROL- HIGH comparison. The respective statistics were 33.73–41.50 and 27–37 in the CONTROL- SMELTER comparison.
Statistical analyses
Two commonly used methods were used for the identification of differentially methylated CpG sites. First, a generalized linear model was used as implemented in the R package Methylkit. This method assumes that the methylated and unmethylated counts follow a binomial distribution and the effect of group/treatment can be estimated with a log-likelihood test [Citation65]. Second, a generalized linear model assuming beta binomial distribution was used taking into account potential overdispersion by estimating a gene-specific shrinkage operator as implemented in R package dss [Citation66]. Currently, potential overdispersion has not thoroughly been tested in MethylKit and thus was not applied. In both methods, the model was fitted for each CpG site separately and we compared the pairwise methylation differences between the CONTROL and HIGH and CONTROL and SMELTER groups. For beta binomial regression the original p-values were recalculated based on the test statistics as implemented in the R-package fdrtool [Citation67]. Since the binomial regression method implemented in the R package Methylkit does not report test statistics and the method is not recommended to be used with U-shaped p-value distributions [Citation67], the re-estimation of p-values were conducted only for the beta binomial regression. The model fits were evaluated by inspecting the resulting p-value histograms. Under a proper null model one would expect that the p-value histogram follows approximately uniform distribution, but if there is an effect of treatment then a surplus of small p-values is expected [Citation68–70]. Deviations from the uniform distribution may provide information about the misspecification of the model or problems in the data.
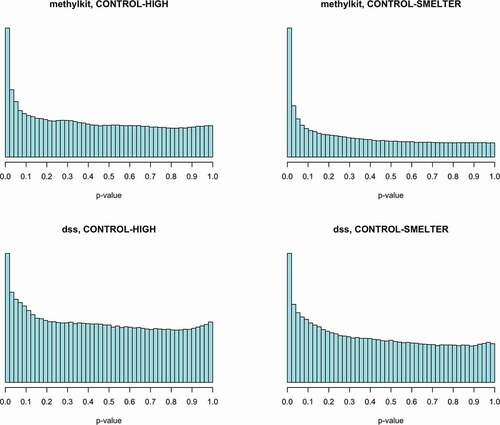
The test statistics of goodness-of-fit test (chi-squared) of the p-value histograms and visual inspection indicated deviations from the uniform distribution in both methods (, ). However, the deviation in the beta binomial regression was smaller than the deviation in the binomial regression and the test statistics were lower when the p-values were re-calculated with fdrtool (). The deviations from the uniform distribution possibly indicate that our data do not fit to model assumptions or problems with the raw data [Citation71, b]. Also, methods for multiple testing assume uniform distribution [Citation71]. Therefore, we further investigated the deviation from uniform distribution by filtering the potentially uninformative CpGs. We used independent filtering approach where those p-values deviating from the uniform are filtered out based on appropriate filter statistics. In gene expression data the mean count for each transcript across all samples has been successfully used as a filter statistics [Citation72]. Using similar approach, we calculated the mean of methylated counts (i.e., Cs) for each CpG across all individuals. Note that the count of C determines relative to the count of T (unmethylated) the methylation level of a given CpG. We applied a threshold for the rank of mean methylated C counts and filtered out those CpGs that were causing the deviation from the uniform distribution (Supplementary figures 5 and 6) by keeping most of the significant CpGs. By removing 30% of the lowest C counts we recovered p-value distribution closer to the uniform distribution and a surplus for small (p < 0.05) p-values (, ). The filtering was carried out using R package genefilter [Citation73]. The filtering approach also increased the number significant CpG sites after controlling for multiple testing (fdr <0.05) in all comparisons ().
Table 1. Metal concentrations (µg/g, dry weight) in faeces of seven-day old Parus major nestlings in the three treatment groups. The values are geometric means with 95% CIs. GLM and Tukey’s test: means with the same letter are not significantly different. N indicates number of broods
Table 2. The number and percentage (in parentheses) of p-values for CpG sites less than 0.05 in different comparisons. Fdr refers to multiple testing correction using Citation98, method. The test statistics of goodness-of-fit test (χ2) of the p-value histograms indicated deviations uniform p-value distribution in unfiltered data, which improved (i.e., lower χ2 values) with filtering (‘filter’)
Figure 1. P-value histograms of the binomial (methylkit, a, b) and beta-binomial regression (dss, c, d) in CONTROL-HIGH and CONTROL-SMELTER comparisons. The p-values of the beta binomial regression were re-calculated based on the test statistics as implemented in the fdrtool R-package (e, f).
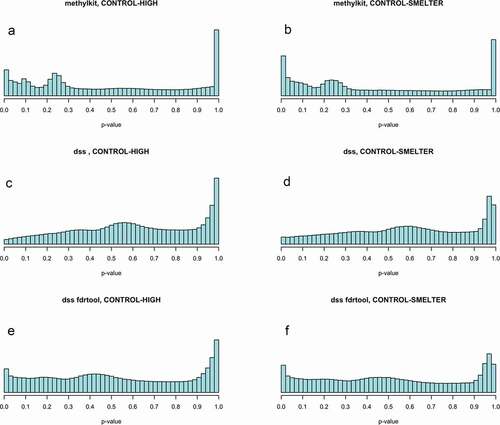
Figure 2. The p-value histograms after low coverage filtering in binomial regression (methylkit) and in beta binomial regression (dss). The p-values in beta binomial regression are based on the re-calculated p-values in fdrtool.
Identification of DMRs
Differentially methylated regions (DMRs) or clusters of differentially methylated CpG sites were identified based on the results of both binomial and beta binomial models. The following criteria were used to identify DMRs: (1) minimum size of a DMR = 50 bp, (2) minimum number of CpGs in the DMR = 3, (3) the percentage of CpGs with fdr <0.05 = 50%, and (4) and more liberally by including the percentage of CpGs with p-value < 0.01 in the cluster = 50%. The identification of DMRs was conducted in the R package dss.
Annotation of differentially methylated regions
The location and association of the all CpGs with a given genomic feature were determined using the great tit genome assembly and annotation 1.1 [Citation46]. More specifically, each CpG was annotated with respect to location in genes and promoter regions, which were defined as 3 kb upstream from the gene start [Citation74]. We excluded alternative transcripts in defining promoters. Some CpGs annotated to both genes and promoters. The annotation was conducted using the IntersectBed option in the BedTools package to identify the only the overlapping genomic features [Citation99]. Altogether, CpGs present in the CONTROL-HIGH and CONTROL-SMELTER comparisons were annotated to 13,364 and 12,972 genes, respectively. These data sets cover 72% and 70% of the total number of the annotated genes (18,550) in the great tit genome. Of all the 1,023,725 CpGs analysed in the CONTROL-HIGH comparison, 683,392 CpGs were found within genes (66.8%) and 451,843 (44.1%) within promoters. Of the 903,449 CpGs in CONTROL-SMELTER comparison 602,997 (66.7%) were located within genes, and 398,381 (44.1%) CpGs within promoters. The annotation includes also the overlapping parts of gene bodies and promoters.
STRING database [Citation75] was used to identify gene ontology categories associated with the DMRs. Annotated genes without generic names i.e., genes with LOC identifier were excluded from the analyses. A hierarchical clustering with a user-specified cut-off value C (0.5) was used as implemented in REVIGO database for merging of semantically similar GO categories corresponding to 1% chance of merging two randomly generated categories [Citation76]. The lowest fdr corrected p-values of the initial enrichment analyses were used to select a representative GO term for each merged category.
Results
Metal exposure
Our dietary Pb treatment (HIGH Pb) significantly increased faecal Pb concentrations compared to the CONTROL (). At the SMELTER site, we found intermediate faecal Pb levels, not significantly different from either HIGH or CONTROL (). In the SMELTER area, concentrations of other measured heavy metals (As, Cu, Cd, Ni) were higher than in CONTROL or HIGH treatment ().
DNA methylation
Descriptive methylation patterns among the treatment groups
The average methylation percentages across all CpGs were 27.97 and 28.01 in CONTROL-HIGH Pb comparison, and 26.82 and 26.67 in CONTROL-SMELTER comparison. The mean differences in methylation in CONTROL-HIGH and CONTROL-SMELTER comparisons were −0.0013% and 0.0015%, respectively. There were no marked differences in the methylation percentage using 2% cut-off between the major chromosomes in either comparison (Supplementary figure 2). Also, there were no clear patterns in sample clustering in either of the comparisons based on hierarchical clustering or principal components analysis (Supplementary figure 3, Supplementary figure 4).
Differentially methylated CpG sites and DMRs in CONTROL HIGH comparison
We identified 96,377 (9.4%) differentially methylated CpGs in the CONTROL-HIGH comparison using binomial GLM () at p-level 0.05, and after fdr correction (<0.05) 9555 CpGs remained. Almost equal proportion of the significant CpGs showed hypomethylation (45.9%) in CONTROL and hypermethylation (54.1%) in HIGH (supplementary figure 5). Beta binomial GLM identified 16,852 (1.6%) differentially methylated CpGs in CONTROL-HIGH comparison at p-level 0.05 () and seven CpGs after fdr correction. Altogether, 336 DMRs were detected in binomial regression and 72 DMRs in beta binomial regression in CONTROL-HIGH comparison.
Differentially methylated CpG sites and DMRs in CONTROL SMELTER comparison
We identified 129,830 (14.4%) CpGs in CONTROL-SMELTER comparison using binomial GLM at p-level 0.05 and 25,222 CpGs remained after fdr correction (). 52.5% of the significant CpGs were hypomethylated and 47.5% were hypermethylated (supplementary figure 5). Beta binomial GLM identified 22,669 (2.5%) CpGs in CONTROL-SMELTER comparison at p-level <0.05 and 33 remained after fdr correction (). Altogether, 781 DMRs were detected in binomial regression and 159 DMRs in beta binomial regression in CONTROL-SMELTER comparison.
The overlap between differentially methylated CpG sites and DMRs between the two comparisons
A total of 2789 (2.9%) of the significant CpGs showing hypomethylation, and 3022 (3.1%) showing hypermethylation were shared between CONTROL-HIGH and CONTROL-SMELTER, respectively (supplementary figure 7). In total, 946 (1.5%) of the significant CpGs showing hypomethylation, and 947 (1.5%) showing hypermethylation were shared between CONTROL-HIGH and CONTROL-SMELTER comparisons (Supplementary figure 7). Using binomial regression, 30 DMRs that had exactly the same starting position were shared between CONTROL-HIGH and CONTROL-SMELTER comparisons. Using beta binomial regression, three DMRs were shared between these two comparisons. Of the DMRs identified in binomial regression, 54% and 40% of were hypomethylated in CONTROL compared to HIGH and SMELTER, respectively. In beta binomial regression 48% and 38% of the DMRs were hypomethylated in CONTROL compared to HIGH and SMELTER, respectively. This suggests that there was no clear pattern of hypo- or hypermethylation in respect to pollution.
Annotation of the DMRs
The mean methylation in DMRs (identified by binomial regression) was higher for gene bodies than promoters in CONTROL (50.4% vs. 25.7%) in HIGH (49.7% vs. 24.9%). Similar pattern was found in DMRs between CONTROL (48.4% vs. 30.1%) and SMELTER (46.7% vs. 26.6%). These differences were also statistically significant (permutation test, 1000 replicates, p = 0.001). The DMRs identified in binomial regression in CONTROL-HIGH were annotated to 123 unique genes and 53 promoter regions excluding predicted genes. CONTROL-SMELTER DMRs were annotated to 281 genes, and 115 promoter regions. The DMRs from the beta binomial regression were annotated to 33 unique genes and, 8 promoter regions in. CONTROL-HIGH and to 66 genes and 34 promoter regions in CONTROL-SMELTER. In CONTROL HIGH comparison, the number of DMRs showing hyper or hypo methylation in gene bodies and promoters were similar. In SMELTER site, gene bodies and promoters shows tendency for hypermethylation (57% of the DMRs in gene bodies and 67% in promoters, respectively).
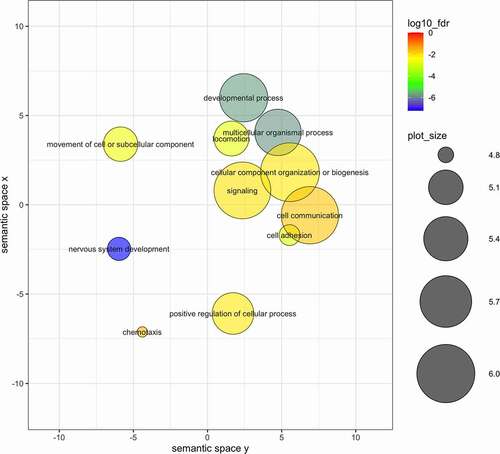
Gene enrichment analyses indicated 15 statistically significant (fdr < 0.05) gene ontologies in CONTROL-HIGH comparison and 62 gene ontologies in CONTROL-SMELTER comparison, when using DMRs from the binomial regression. No statistically significant gene ontologies were found in either comparison among the DMRs identified in beta binomial regression. After merging semantically similar gene ontologies using REVIGO database, 5 and 11 enrichments remained in CONTROL-HIGH and CONTROL-SMELTER comparisons, respectively (, ). Most of the gene ontologies were associated with developmental processes and were described under GO terms such as ‘system development’ or ‘nervous system development’ (, ). Other categories involved cell-cell signalling or categories involved in transmitting information between cell and its surroundings (, ). Finally, we also report 10 DMRs with the largest differences in methylation levels (Supplementary Table 1). These included 12 genes (POMC, ITGA11, LEKR1, USH2A, ZPR1, JMJD1C, ADAMTS3, PDE1C, TBP, PAPD4, GCC1 and UTRN) that may serve as potential candidates for further studies on the effects of pollution on organisms via DNA methylation.
Figure 3. Results of the gene enrichment test for DMRs identified in the binomial regression in the CONTROL-HIGH comparison after merging semantically similar gene ontology categories. Circle size indicates the frequency of the GO term in the underlying GO database (bubbles of more general terms are larger; http://revigo.irb.hr/) and colour scale shows the fdr (log10 scale) of the representative GO term for each merged category.
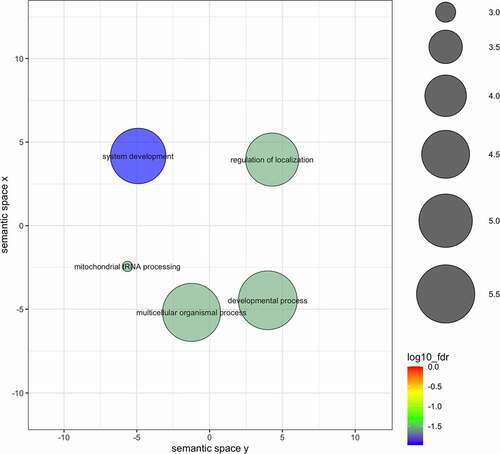
Figure 4. Results of the gene enrichment test for DMRs identified in the binomial regression in the CONTROL-SMELTER comparison after merging semantically similar gene ontology categories. Circle size indicates the frequency of the GO term in the underlying GO database (bubbles of more general terms are larger; http://revigo.irb.hr/) and colour scale shows the fdr (log10 scale) of the representative GO term for each merged category.
Discussion
We studied whether early-life exposure to pollution affects DNA methylation patterns in wild great tit populations. We found evidence that both direct Pb exposure during post-hatching stage and long-term anthropogenic pollution affect methylation levels of a small number (0.25–2.1%) genes from which we were able collect data. The number of CpGs and DMRs varied between binomial and beta binomial regression to a large extent such that binomial regression was more liberal than beta binomial regression. We found that genes associated with early developmental traits were enriched among the DMRs in binomial regression potentially linking methylation differences to biologically meaningful traits in birds living in polluted environments. However, this result was not consistent between the two statistical methods highlighting the difficulty of modelling the variance in the CpGs. Nevertheless, our results suggest that post-hatching, not only prenatal, environment modifies DNA methylation patterns in wild vertebrates.
Causal and direct effects of Pb pollution on DNA methylation: CONTROL-HIGH comparison
Our data on faecal metal levels presented here, as well as data on bone Pb levels (Pb accumulates in bone) from the same broods [Citation31,Citation48], show that the HIGH group was indeed exposed to higher levels of Pb than CONTROL during the post-hatching period. The measurements correspond to observed Pb levels in polluted environments across Europe [Citation49,Citation50,Citation77–79], thus validating the effectiveness and environmental relevance of the Pb exposure treatment.
The HIGH-CONTROL comparison represents direct effects of Pb exposure post-hatching. There were no differences in the general methylation levels (hypo- or hypermethylation) between the two groups in either at the CpG or DMRs, in contrast for example to previous epidemiological studies in humans [Citation21,Citation22]. The identified GO terms that were found to be enriched using the binomial regression analysis suggest that high Pb exposure may affect methylation of genes associated with biological processes such as system development and developmental processes. In previous studies, similar developmental pathways have been identified in rodents, but also sex-specific differences reported [Citation28]. These results makes sense in the light of what is known from previous studies in the same study system. For example, in the HIGH Pb treatment, vitamin A, retinol and stress protein levels were higher than in the CONTROL [Citation31,Citation42]. However, we acknowledge that the patterns that we found in blood tissue can be different in other tissues, but that the majority of the findings are likely to be similar for other tissues, as found previously in the study species [Citation45,Citation47,Citation80,Citation81]. Also, relative little is known about the temporal stability of CpG methylation in great tits or other birds [Citation17]. However, [Citation74] found that the majority of the CpGs showed stabile methylation during the breeding season of an experimental great tit population. We cannot however, rule out the possibility that these changes are transient, and different methylation patterns may emerge in another life stage than 14 day-old offspring. Furthermore, If the observed methylation differences Pb to altered gene expression at the target genes, our results imply that the effects of pollution on such a variable set of genes may alter various developmental and cellular processes and ultimately health and phenotype.
Effects of long-term environmental pollution on DNA methylation: CONTROL-SMELTER comparison
At the SMELTER site, a population residing in an environment with long-term pollution exposure, birds were exposed to various pollutants, such as copper, nickel, cadmium and arsenic, originating from the nearby copper smelter [Citation31], with levels higher compared to CONTROL population. However, importantly, food quality and availability likely differed between CONTROL and SMELTER, as pollution reduces some important food sources such as caterpillars, and other insects in the area [Citation50,Citation82]. Detailed studies on invertebrate abundance at polluted and control sites have shown that especially the amount of nutritious (e.g., rich in carotenoids) caterpillar larvae of moths have decreased in the polluted area [Citation83]. This difference in abundance can be seen in the diet of great tit nestlings: the diet of great tit nestlings contained ca. 20% less (based on biomass) moths and caterpillars as compared to the control area [Citation35]. Decreased caterpillar availability manifest in inferior growth and less yellow plumage of great tit nestlings [Citation51]. The metal concentrations observed at the SMELTER area are generally below the critical levels associated with sub-clinical effects [Citation84], suggesting that indirect pollution effects via lower quality food is more likely [Citation35]. The CONTROL and SMELTER population are not likely to differ genetically given the low genetic differentiation in this species even at European scale, [Citation100] and the habitats are relatively similar. However, at the SMELTER site, individuals are be exposed to pollutants already pre-hatching [Citation48] contrary to experimental birds, but the importance of timing of the exposure is not well understood.
Contrary to predictions we did not find general differences in hypo/hypermethylation in CpGs or DMRs. Only when the DMRs annotated to genes were inspected, a tendency for hypermethylation was detected especially in the promoters of 155 genes (binomial) and 34 genes (beta-binomial) was detected. We detected a signal on differential methylation for genes related to nervous system in CONTROL-SMELTER comparison, which could potentially point to cognitive or behavioural changes. Parallel to our results, both prenatal Pb and malnutrition have recently been found to influence methylation of genes in pathways associated with neuronal proliferation and differentiation in mice and embryonic cell models [Citation27,Citation28,Citation85–88]. In humans, captive animal models and wildlife, both early nutrition and metal exposure, particularly Pb, have well-documented detrimental effects on cognitive abilities and behaviour that persist into adulthood [e.g., impaired learning, memory, increased aggression, hyperactivity Citation48, Citation89–94]. Until now, the role of epigenetic mechanisms underlying such effects has not been thoroughly characterized. Our results can thus stimulate further research on the potential epigenetic mechanisms explaining the long-lasting influences of early-life adverse environment on behavioural and cognitive traits. If the observed methylation differences Pb to altered gene expression at the target genes (see below), they could contribute to the potential developmental problems associated with poor nutrition. For example, we found that SMELTER group showed lower growth rates, higher antioxidant enzyme and stress hormone levels, lower haematocrit and survival probability than CONTROL [Citation31,Citation41,Citation42].
Overlaps between the two comparisons
We found very little overlap (~1-3%) in methylation of individual CpG sites between the CONTROL-HIGH and CONTROL-SMELTER comparisons. However, on the DMR level and their annotations showed some overlap indicating that the exposure to the Pb treatment and metal-polluted at the smelter site can induce similar methylation changes. This suggests some direct effects of metals also at the smelter site. The gene ontology enrichments also mainly pointed that developmental processes were similar in these two comparisons suggesting that the overall effect of pollution is in the same direction. However, the majority of methylation differences in CONTROL and SMELTER are thus likely to be explained by (i) other elements than Pb, (ii) and/or indirect effect of food, (iii) or their combination, or by (iv) SMELTER site birds exposed to metals prenatally, compared to only postnatal exposure in the HIGH group. Currently, we cannot distinguish between these alternatives. In general, the number of DMRs between CONTROL and SMELTER were considerably higher than in CONTROL-HIGH comparison probably reflecting exposure to a more stressful environment, both nutritional stress and direct exposure to pollutants of various types pre and post-natally.
Functional consequences of varying DNA methylation levels?
Importantly, when interpreting the potential functional consequences of the observed methylation differences, one needs to note that not all these genes with DMRs have been characterized in birds and annotation has been done using mainly chicken and zebra finch gene models. Thus, the function of these genes is not well understood. Secondly, the link between DNA methylation and gene expression is not always straightforward depending on the genomic feature where the methylation changes occur [Citation95]. Promoter methylation has been found to be inversely correlated with gene expression [Citation96], but gene body methylation can have similar effects [Citation97]. However, we hypothesize that differential methylation at the observed sites affects gene activity and ultimately multiple cellular, developmental and physiological processes. Indirect evidence for a functional interpretation is provided by a recent great tit study using whole-genome bisulphite and RNA-seq data. This study showed that across all genes, higher CG methylation at transcription start sites and within gene bodies was associated with lower gene expression [Citation46]. Finally, without detailed knowledge on gene function or differences in expression, it is difficult to judge whether the observed changes in methylation cause differences in phenotype and physiology we previously observed between HIGH Pb exposure and CONTROL groups [Citation31,Citation41,Citation42]. Therefore, follow-up studies are needed to investigate how the observed parameters are affected by differential methylation in one or more of the regions.
The performance of the binomial and beta-binomial models
We employed two commonly used methods to detect CpGs and evaluated their performance using p-value histograms. Either one of these methods did not recover uniform p-value histograms in our data when applied to overall coverage threshold of 10x, pointing out that the p-values are not reliable as such. When we applied a filtering approach, developed for gene expression count data, we were able to recover uniform distribution for both methods. Thus, it appears that uninformative counts i.e., low counts for methylated state can induce a clear deviation from the uniform distribution. In other words, the small methylation differences between treatment groups are potentially difficult to model using the two statistical approaches. While we applied an overall coverage threshold of 10x to our data, it seems that another filtering step is needed for C counts to recover uniform p-value distribution at least in our data set.
Overall, the performance of the binomial and beta binomial regression reflects the outcome of previous studies on simulated and empirical data sets: binomial regression has been found to be more liberal in finding CpGs as compared to beta binomial regression [Citation43, Citation101, Citation102], and we also found considerably more CpGs and DMRs in both comparisons using binomial than beta binomial regression. The likelihood of false negatives is higher when stringency of accounting for the number of tests is lower. Also, this is more apparent in the individual CpG site analysis then in the DMR analysis. Yet, in this novel and explorative study, identifying a set of potentially affected CpGs and DMRs, very strict correction for the number of tests would lead to a large type II error and thus failure to recognize differentially methylated sites or regions as significant. Overall, the comparison between the two methods is challenging in empirical data sets but both methods seem to recover uniform p-value distribution when uninformative CpGs are filtered out. We view our analysis as a starting point for further functional validation of our findings.
Conclusions
In this study, we explored the environmental causes of epigenetic variation in an ecological model organism, which is a novel and emerging research field. We found evidence that differentially methylated regions contain genes enriched for biologically meaningful processes and suggest potential targets for future research. Although we used a method that does not cover the whole genome, we were able to analyse methylation patterns covering most of the annotated genes in great tit genome. However, the results were not consistent between binomial and beta binomial regression, which warrants caution when selecting analysis methods and interpreting results using different methods. Finally, the functional consequences of variable methylation patterns found in this study are yet to be discovered and a more comprehensive approach combining other molecular levels as well functional studies is needed.
Data accessibility
The sequence data are deposited in the SRA database under accession number PRJNA589705.
Author contributions
SR, TE and HM designed the study. SR and TE collected the data. HM, SR and KvO designed the sequencing. HM conducted statistical and bioinformatic analyses. KvO provided the genome resources. SR, HM, and KvO interpreted the data. All authors contributed to manuscript preparation.
Supplemental Material
Download MS Word (3.8 MB)Acknowledgments
We thank Miia Rainio, Salla Koskinen, Tarja Pajari, Marjo Aikko, Orsolyia Palfi, Åsa Berglund, and Jorma Nurmi for their efforts in helping us with field work. We thank Veronika Laine and two anonymous reviewers for constructive comments on earlier versions of this manuscript. We also thank Finnish Centre for Scientific Computing (CSC) for providing computational resources, Center for Evolutionary Applications for molecular work and Finnish Functional Genomics Centre for sequencing services.
Disclosure statement
No potential conflict of interest was reported by the author(s).
Supplementary material
Supplemental data for this article can be accessed here.
Correction Statement
This article has been republished with minor changes. These changes do not impact the academic content of the article.
Additional information
Funding
References
- Angers B, Castonguay E, Massicotte R. Environmentally induced phenotypes and DNA methylation: how to deal with unpredictable conditions until the next generation and after. Mol Ecol. 2010;19(7):1283–1295.
- Rosenfeld CS. Animal models to study environmental epigenetics. Biol Reprod. 2010;82(3):473–488.
- Skinner MK, Manikkam M, Guerrero-Bosagna C. Epigenetic transgenerational actions of environmental factors in disease etiology. Trends Endocrinol Metab. 2010;21(4):214–222.
- Faulk C, Dolinoy DC. Timing is everything The when and how of environmentally induced changes in the epigenome of animals. Epigenetics. 2011;6(7):791–797.
- Feil R, Fraga MF. Epigenetics and the environment: emerging patterns and implications. Nat Rev Genet. 2012;13(2):97–109.
- Heijmans BT, Tobi EW, Stein AD, et al. Persistent epigenetic differences associated with prenatal exposure to famine in humans. Proc Natl Acad Sci U S A. 2008;13(44):17046–17049.
- Weaver ICG, Cervoni N, Champagne FA, et al. Epigenetic programming by maternal behavior. Nat Neurosci. 2004;7(8):847–854.
- Cheng TF, Choudhuri S, Muldoon-Jacobs K. Epigenetic targets of some toxicologically relevant metals: a review of the literature. J Appl Toxicol. 2012;32(9):643–653.
- Head JA. Patterns of DNA methylation in animals: an ecotoxicological perspective. Integr Comp Biol. 2014;54(1):77–86.
- Head JA, Dolinoy DC, Basu N. Epigenetics for ecotoxicologists. Environ toxicol chem/SETAC. 2012;31(2):221–227.
- Ray PD, Yosim A, Fry RC. Incorporating epigenetic data into the risk assessment process for the toxic metals arsenic, cadmium, chromium, lead, and mercury: strategies and challenges. Front Genet. 2014;5:201.
- Ruiz-Hernandez A, Kuo CC, Rentero-Garrido P, et al. Environmental chemicals and DNA methylation in adults: a systematic review of the epidemiologic evidence. Clin Epigenetics. 2015;7(1):24.
- Bossdorf O, Richards CL, Pigliucci M. Epigenetics for ecologists. Ecol Lett. 2008;11(2):106–115.
- Liebl AL, Schrey AW, Richards CL, et al. Patterns of DNA methylation throughout a range expansion of an introduced songbird. Integr Comp Biol. 2013;53(2):351–358.
- Riyahi S, Sanchez-Delgado M, Calafell F, et al. Combined epigenetic and intraspecific variation of the DRD4 and SERT genes influence novelty seeking behavior in great tit Parus major. Epigenetics. 2015;10(6):516–525.
- Rubenstein DR, Skolnik H, Berrio A, et al. Sex-specific fitness effects of unpredictable early life conditions are associated with DNA methylation in the avian glucocorticoid receptor. Mol Ecol. 2016;25(8):1714–1728.
- Sepers B, van den Heuvel K, Lindner M, et al. Avian ecological epigenetics: pitfalls and promises. J Ornith. 2019;160(4):1183–1203.
- Verhoeven KJF, Vonholdt BM, Sork VL. Epigenetics in ecology and evolution: what we know and what we need to know INTRODUCTION. Mol Ecol. 2016;25(8):1631–1638.
- Wenzel MA, Piertney SB. Fine-scale population epigenetic structure in relation to gastrointestinal parasite load in red grouse (Lagopus lagopus scotica). Mol Ecol. 2014;23(17):4256–4273.
- Bihaqi SW. Early life exposure to lead (Pb) and changes in DNA methylation: relevance to Alzheimer’s disease. Rev Environ Health. 2019;34(2):187–195.
- Pilsner JR, Hu H, Ettinger A, et al. Influence of prenatal lead exposure on genomic methylation of cord blood DNA. Environ Health Perspect. 2009;117(9):1466–1471.
- Wright RO, Schwartz J, Wright RJ, et al. Biomarkers of lead exposure and DNA methylation within retrotransposons. Environ Health Perspect. 2010;118(6):790–795.
- Faulk C, Barks A, Liu K, et al. Early-life lead exposure results in dose- and sex-specific effects on weight and epigenetic gene regulation in weanling mice. Epigenomics. 2013;5(5):487–500.
- Faulk C, Liu K, Barks A, et al. Longitudinal epigenetic drift in mice perinatally exposed to lead. Epigenetics. 2014;9(7):934–941.
- Luo M, Xu Y, Cai R, et al. Epigenetic histone modification regulates developmental lead exposure induced hyperactivity in rats. Toxicol Lett. 2014;225(1):78–85.
- Nakayama SMM, Nakata H, Ikenaka Y, et al. One year exposure to Cd- and Pb-contaminated soil causes metal accumulation and alteration of global DNA methylation in rats. Environ Pollut. 2019;252:1267–1276.
- Sanchez-Martin FJ, Lindquist DM, Landero-Figueroa J, et al. Sex- and tissue-specific methylome changes in brains of mice perinatally exposed to lead. Neurotoxicology. 2015;46:92–100.
- Singh G, Singh V, Wang ZX, et al. Effects of developmental lead exposure on the hippocampal methylome: influences of sex and timing and level of exposure. Toxicol Lett. 2018;290:63–72.
- Wu J, Basha MR, Brock B, et al. Alzheimer’s disease (AD)-like pathology in aged monkeys after infantile exposure to environmental metal lead (Pb): evidence for a developmental origin and environmental link for AD. J Neurosci. 2008;28(1):3–9.
- Burger J, Gochfeld M. Effects of lead on birds (Laridae): a review of laboratory and field studies. J Toxicol Environ Health B Crit Rev. 2000;3(2):59–78.
- Eeva T, Rainio M, Berglund A, et al. Experimental manipulation of dietary lead levels in great tit nestlings: limited effects on growth, physiology and survival. Ecotoxicology. 2014;23(5):914–928.
- Koivula MJ, Eeva T. Metal-related oxidative stress in birds. Environ Pollut. 2010;158(7):2359–2370.
- Boyd RS. Heavy metal pollutants and chemical ecology: exploring new frontiers. J Chem Ecol. 2010;36(1):46–58.
- Eeva T, Lehikoinen E. Rich calcium availability diminishes heavy metal toxicity in Pied Flycatcher. Funct Ecol. 2004;18(4):548–553.
- Eeva T, Ryoma M, Riihimaki J. Pollution-related changes in diets of two insectivorous passerines. Oecologia. 2005;145(4):629–639.
- Choi SW, Friso S. Epigenetics: a new bridge between nutrition and health. Adv Nutr. 2010;1(1):8–16.
- Konycheva G, Dziadek MA, Ferguson LR, et al. Dietary methyl donor deficiency during pregnancy in rats shapes learning and anxiety in offspring. Nutr Res. 2011;31(10):790–804.
- Aagaard-Tillery KM, Grove K, Bishop J, et al. Developmental origins of disease and determinants of chromatin structure: maternal diet modifies the primate fetal epigenome. J Mol Endocrinol. 2008;41(2):91–102.
- Burdge GC, Hanson MA, Slater-Jefferies JL, et al. Epigenetic regulation of transcription: a mechanism for inducing variations in phenotype (fetal programming) by differences in nutrition during early life? Br J Nutr. 2007;97(6):1036–1046.
- Eeva T, Lehikoinen E, Pohjalainen T. Pollution-related variation in food supply and breeding success in two hole-nesting passerines. Ecology. 1997;78(4):1120–1131.
- Rainio MJ, Eeva T, Lilley T, et al. Effects of early-life lead exposure on oxidative status and phagocytosis activity in great tits (Parus major). Comparative Biochemistry and Physiology Part C: Toxicology & Pharmacology. 2015b;167:24–34.
- Ruiz S, Espin S, Rainio M, et al. Effects of dietary lead exposure on vitamin levels in great tit nestlings - An experimental manipulation. Environ Pollut. 2016;213:688–697.
- Wreczycka K, Gosdschan A, Yusuf D, et al. Strategies for analyzing bisulfite sequencing data. J Biotechnol. 2017;261:105–115.
- Zhang Y, Baheti S, Sun ZF. Statistical method evaluation for differentially methylated CpGs in base resolution next-generation DNA sequencing data. Brief Bioinform. 2018;19(3):374–386.
- Derks MFL, Schachtschneider KM, Madsen O, et al. Gene and transposable element methylation in great tit (Parus major) brain and blood. Bmc Genomics. 2016;17(1):13.
- Laine VN, Gossmann TI, Schachtschneider KM, et al. Evolutionary signals of selection on cognition from the great tit genome and methylome. Nature Commun. 2016;s 7:32.
- Verhulst EC, Mateman AC, Zwier MV, et al. Evidence from pyrosequencing indicates that natural variation in animal personality is associated with DRD4 DNA methylation. Mol Ecol. 2016;25(8):1801–1811.
- Ruuskanen S, Eeva T, Kotitalo P, et al. No delayed behavioral and phenotypic responses to experimental early-life lead exposure in great tits (Parus major). Environ Sci Pollut Res. 2015;22(4):2610–2621.
- Belskii EA, Bezel VS, Polents EA. Early stages of the nesting period of hollow-nesting birds under conditions of industrial-pollution. Russ J Ecol. 1995b;26:38–43.
- Eeva T, Lehikoinen E. Growth and mortality of nestling great tits (Parus major) and pied flycatchers (Ficedula hypoleuca) in a heavy metal pollution gradient. Oecologia. 1996;108(4):631–639.
- Eeva T, Sillanpää S, Salminen J-P. The effects of diet quality and quantity on plumage colour and growth of great tit Parus major nestlings: a food manipulation experiment along a pollution gradient. J Avian Biol. 2009;40(5):1–9.
- DauweT, Bervoets, L, Blust, R,et al. Can Excrement and Feathers of Nestling Songbirds Be Used as Biomonitors for Heavy Metal Pollution? Archives of Environmental Contamination and Toxicology, 2000;39(4), 541–546.
- Dauwe, T, Janssens, E, Bervoets, L,et al. Relationships between metal concentrations in great tit nestlings and their environment and food. Environmental Pollution, 2004;131(3), 373–380.
- Nyholm NEI. Heavy metal tissue levels, impact on breeding and nestling development in natural populations of pied flycatchers (Aves) in the pollution gradient from a smelter. In: Donker M, Eijsackers H, Heimback F, editors. Ecotoxicology of soil organisms. Boca Raton: Lewis Publishers; 1994. p. 373–382.
- Berglund, ÅMM, Ingvarsson, PK, Danielsson, H, et al. Lead exposure and biological effects in pied flycatchers (Ficedula hypoleuca) before and after the closure of a lead mine in northern Sweden. Environmental Pollution, 2010;158(5), 1368–1375.
- Berglund, ÅMM, Rainio, MJ, & Eeva, T. (2015). Temporal Trends in Metal Pollution: Using Bird Excrement as Indicator. PLOS ONE, 10(2), e0117071.
- Griffiths R, Double MC, Orr K, et al. A DNA test to sex most birds. Mol Ecol. 1998;7(8):1071–1075.
- Rainio MJ, Eeva T, Lilley T, et al. Effects of early-life lead exposure on oxidative status and phagocytosis activity in great tits (Parus major). Comparative Biochemistry and Physiology Part C: Toxicology & Pharmacology. 2015a;167:24–34.
- Andrews S 2010. FastQC: a quality control tool for high throughput sequence data . Available online at: http://www.bioinformatics.babraham.ac.uk/projects/fastqc.
- MARTIN, Marcel. Cutadapt removes adapter sequences from high-throughput sequencing reads. EMBnet.journal, [S.l.], v. 17, n. 1, p. pp. 10–12, may 2011. ISSN 2226–6089.
- Smeds, L., & Künstner, A. (2011). ConDeTri - A Content Dependent Read Trimmer for Illumina Data. PLoS ONE, 6(10), e26314.
- Krueger F, Andrews SR. Bismark: a flexible aligner and methylation caller for Bisulfite-Seq applications. Bioinformatics. 2011;27(11):1571–1572.
- Hansen KD, Langmead B, Irizarry RA. BSmooth: from whole genome bisulfite sequencing reads to differentially methylated regions. Genome Biol. 2012;13.
- Mechta M, Ingerslev LR, Fabre O, et al. Evidence suggesting absence of mitochondrial DNA methylation. Front Genet. 2017;8:9.
- Akalin A, Kormaksson M, Li S, et al. methylKit: a comprehensive R package for the analysis of genome-wide DNA methylation profiles. Genome Biol. 2012;13(10):9.
- Feng H, Conneely KN, Wu H. A Bayesian hierarchical model to detect differentially methylated loci from single nucleotide resolution sequencing data. Nucleic Acids Res. 2014;42(8):11.
- Strimmer K. Fdrtool: a versatile R package for estimating local and tail area-based false discovery rates. Bioinformatics. 2008b;24(12):1461–1462.
- Barton SJ, Crozier SR, Lillycrop KA, et al. Correction of unexpected distributions of P values from analysis of whole genome arrays by rectifying violation of statistical assumptions. Bmc Genomics. 2013;14.
- Fodor AA, Tickle TL, Richardson C. Towards the uniform distribution of null p-values on Affymetrix microarrays. Genome Biol. 2007;8.
- Garamszegi LZ, de Villemereuil P. Perturbations on the uniform distribution of p-values can lead to misleading inferences from null-hypothesis testing. Trends Neurosci Educ. 2017;8-9: 18–27.
- Strimmer K. A unified approach to false discovery rate estimation. Bmc Bioinformatics. 2008a;9(1):14.
- Bourgon R, Gentleman R, Huber W. Independent filtering increases detection power for high-throughput experiments. Proc Natl Acad Sci U S A. 2010;107(21):9546–9551.
- Gentleman CV, Huber W, F H. genefilter: methods for filtering genes from high-throughput experiments. In: R package version 1.64.0. 2018.
- Viitaniemi HM, Verhagen I, Visser ME, et al. Seasonal variation in genome-wide DNA methylation patterns and the onset of seasonal timing of reproduction in great tits. Genome Biol Evol. 2019;11(3):970–983.
- Szklarczyk D, Franceschini A, Wyder S, et al. STRING v10: protein-protein interaction networks, integrated over the tree of life. Nucleic Acids Res. 2015;43(D1):D447–D452.
- Supek F, Bosnjak M, Skunca N, et al. REVIGO summarizes and visualizes long lists of gene ontology terms. Plos One. 2011;6(7):6.
- Belskii EA, Bezel VS, Lyakhov AG. Characteristics of the reproductive indexes of birds nesting in tree hollows under conditions of technogenic pollution. Russ J Ecol. 1995a;26:126–131.
- Belskii EA, Lugas’kova NV, Karfidova AA. Reproductive parameters of adult birds and morphophysiological characteristics of chicks in the pied flycatcher (Ficedula hypoleuca Pall.) in technogenically polluted habitats. Russ J Ecol. 2005;36(5):329–335.
- Berglund AMM, Nyholm NEI. Slow improvements of metal exposure, health- and breeding conditions of pied flycatchers (Ficedula hypoleuca) after decreased industrial heavy metal emissions. SciTotal Environ. 2011;409(20):4326–4334.
- Husby A. On the use of blood samples for measuring DNA methylation in ecological epigenetic studies. Integr Comp Biol. 2020;60(6):1558–1566.
- Lindner M, Verhagen I, Viitaniemi HM, et al. Temporal changes in DNA methylation and RNA expression in a small song bird: within- and between-tissue comparisons. BMC Genomics. 2021;22(1):1–16.
- Eeva T, Lehikoinen E, Nikinmaa M. Pollution-induced nutritional stress in birds: an experimental study of direct and indirect effects. Ecol Appl. 2003;13(5):1242–1249.
- Sillanpää S, Salminen J-P, Eeva T. Breeding success and lutein availability in Great tit (Parus major). Acta Oecologica. 2009;35(6):805–810.
- Berglund AMM, Rainio MJ, Eeva T. Decreased metal accumulation in passerines as a result of reduced emissions. Environ Toxicol Chem. 2012;31(6):1317–1323.
- Dou JF, Farooqui Z, Faulk CD, et al. Perinatal Lead (Pb) exposure and cortical neuron-specific DNA methylation in male mice. Genes (Basel). 2019;10(4):15.
- Senut MC, Cingolani P, Sen A, et al. Epigenetics of early-life lead exposure and effects on brain development. Epigenomics. 2012;4(6):665–674.
- Senut MC, Sen A, Cingolani P, et al. Lead Exposure disrupts global DNA methylation in human embryonic stem cells and alters their neuronal differentiation. Toxicol Sci. 2014;139(1):142–161.
- Weng XL, Zhou DZ, Liu FT, et al. DNA methylation profiling in the thalamus and hippocampus of postnatal malnourished mice, including effects related to long-term potentiation. BMC Neurosci. 2014;25(1):8.
- Arnold KE, Ramsay SL, Donaldson C, et al. Parental prey selection affects risk-taking behaviour and spatial learning in avian offspring. Proceedings of the Royal Society B: Biological Sciences. 2007;274(1625):2563–2569.
- Brown S, Dragann, Vogel WH, et al. Effects of lead acetate on learning and memory in rats. Archives of Environmental Health: An International Journal. 1971;22(3):370–&.
- Burger J, Gochfeld M. Effects of lead on learning in herring gulls: an avian wildlife model for neurobehavioral deficits. Neurotoxicology. 2005;26(4):615–624.
- Carere C, Drent PJ, Koolhaas JM, et al. Epigenetic effects on personality traits: early food provisioning and sibling competition. Behaviour. 2005;142(9–10):1329–1355.
- Chen JF, Chen YH, Liu W, et al. Developmental lead acetate exposure induces embryonic toxicity and memory deficit in adult zebrafish. Neurotoxicol Teratol. 2012;34(6):581–586.
- Morgan RE, Levitsky DA, Strupp BJ. Effects of chronic lead exposure on learning and reaction time in a visual discrimination task. Neurotoxicol Teratol. 2000;22(3):337–345.
- Jones PA. Functions of DNA methylation: islands, start sites, gene bodies and beyond. Nat Rev Genet. 2012;13(7):484–492.
- Lou SK, Lee HM, Qin H, et al. Whole-genome bisulfite sequencing of multiple individuals reveals complementary roles of promoter and gene body methylation in transcriptional regulation. Genome Biol. 2014;15(7):21.
- Dixon G, Liao Y, Bay LK, et al. Role of gene body methylation in acclimatization and adaptation in a basal metazoan. Proc Natl Acad Sci U S A. 2018;115(52):13342–13346.
- Benjamini Y, Hochberg Y. Controlling the false discovery rate - a practical and powerful approach to multiple testing. J R Stat Soc Ser B Stat Methodol. 1995;57:289–300.
- Quinlan AR, Hall IM. BEDTools: a flexible suite of utilities for comparing genomic features. Bioinformatics. 2010;26(6):841–2.
- Lemoine, M., Lucek, K., Perrier, C., et. al. Low but contrasting neutral genetic differentiation shaped by winter temperature in European great tits. Biological Journal of the Linnean Society, 2016;118(3):668–685.
- Dolzhenko, E., & Smith, A. D. (2014). Using beta-binomial regression for high-precision differential methylation analysis in multifactor whole-genome bisulfite sequencing experiments. BMC Bioinformatics, 15(1):1–8.
- Park, Y., & Wu, H. (2016). Differential methylation analysis for BS-seq data under general experimental design. Bioinformatics. 32(10):1446–1453.