
ABSTRACT
DNA methylation (DNAm) is vulnerable to dysregulation by environmental exposures during epigenetic reprogramming that occurs in embryogenesis. Sexual dimorphism in environmentally induced DNAm dysregulation has been identified and therefore it is important to understand sex-specific DNAm patterns. DNAm at several autosomal sites has been consistently associated with sex in cord blood and placental foetal tissues. However, there is limited research comparing sex-specific DNAm across tissues, particularly differentially methylated regions (DMRs). This study leverages DNAm data measured using the Illumina HumanMethylation450 BeadChip in cord blood (N = 179), placenta (N = 229), and umbilical artery samples (N = 229) in the PRogramming of Intergenerational Stress Mechanisms (PRISM) cohort to identify autosomal DMRs and differentially methylated positions (DMPs). A replication analyses was conducted in an independent cohort (GEO Accession GSE129841). We identified 183, 257, and 419 DMRs and 2119, 2281, and 3405 DMPs (pBonferroni < 0.05) in cord blood, placenta, and artery samples, respectively. Thirty-nine DMRs overlapped in all three tissues, overlapping with genes involved in spermatogenesis (NKAPL, PIWIL2 and AURKC) and X–inactivation (LRIF1). In replication analysis, 85% of DMRs overlapped with those identified in PRISM. Overall, DMRs and DMPs had higher methylation levels among females in cord blood and artery samples, but higher methylation levels among males in placenta samples. Further research is necessary to understand biological mechanisms that contribute to differences in sex-specific DNAm signatures across tissues, as well as to determine if sexual dimorphism in the epigenome impacts response to environmental stressors.
Introduction
DNA methylation (DNAm) represents the most studied epigenetic marker reflecting prior and current environmental exposures and future disease risks. The epigenome is particularly vulnerable to dysregulation by environmental exposures during embryogenesis, a time of rapid cellular differentiation and extensive epigenetic reprogramming [Citation1]. Demethylation across functional elements occurs after fertilization, followed by remethylation after implantation [Citation2]. As conceptualized in the developmental origins of health and disease hypothesis, conditions during development, including nutrition, stress, and environmental chemicals, can alter epigenetic marks resulting in health consequences throughout the lifespan [Citation3]. For example, in epidemiological studies, in utero dietary factors and exposure to environmental pollutants have been associated with changes in DNAm of foetal tissues [Citation4] which have been shown to persist into adulthood [Citation5,Citation6]. Methylation patterns differ between foetal tissues; embryos have an overall bimodal distribution of DNAm and the placenta exhibits a higher proportion of loci with intermediate DNAm levels [Citation2,Citation7], particularly within gene bodies [Citation8].
Epidemiological studies document sexual dimorphism in environmentally induced disorders [Citation9–12], DNAm dysregulation [Citation13–15], and gestational epigenetic age acceleration measured in placenta [Citation16]. Epigenetics represents a potential mechanism through which sexually dimorphic in utero programming effects manifest [Citation17]. Foetal sex is increasingly recognized as a key modulator of placental development and adaptation to environmental conditions throughout pregnancy [Citation14,Citation17–20]. Sex differences in the methylome are well established; however, it is less understood how these differences translate across foetal tissues. DNAm is involved in X inactivation in females, a mechanism for dosage compensation [Citation21]. In addition, epigenome-wide association studies (EWAS) have found sex differences in autosomal DNAm patterns of foetal tissues [Citation22–24]. For example, an EWAS of cord blood (N = 111) measuring DNAm using the Illumina Infinium HumanMethylation450 BeadChip (450K) identified 3,031 differentially methylated positions (DMPs) (false discovery rate (FDR)-adjusted p < 0.05), with predominantly (83%) higher methylation among females [Citation22]. Similarly, a study of cord blood (N = 71) identified 2,332 autosomal DMPs, 66% of which had higher methylation among females [Citation25]. Conversely, an EWAS of placenta samples (N = 84) identified 91 DMPs (p < 1 × 10⁻⁷) including 82% with lower methylation in females compared to males [Citation24]. This finding has been corroborated in a study of four placentas using whole-genome oxidative bisulphite sequencing in which Gong et al. observed global hypermethylation among males [Citation8].
Although sex differences appear to occur throughout the autosomal methylome and sex-specific associations between environmental exposures and differentially methylated regions (DMRs) have been reported [Citation26], fewer studies have reported sex-associated DMRs. Yousefi et al. identified 2,471 sex-associated DMRs annotated to autosomes in cord blood, which predominantly (83%) had higher mean methylation levels among females [Citation22]. Maschietto et al. assessed DMRs by preidentified and tiling regions, identifying 171, 131, 127 and 333 DMRs in CpG islands, promotors, genes, and tiling regions, respectively, all of which had a larger proportion of higher methylation among females [Citation25]. Gong et al. conducted DMR analysis of placenta DNAm by 5kb tiles, identifying a cluster of DMRs located on chromosome 8 near the gene CSMD1 with higher mean methylation levels among males (72% in males vs. 36% in females) [Citation8].
Investigating sex differences in the methylome, particularly across tissues, is important in understanding the role of epigenetic regulation in determining phenotype, as well as in understanding sex-specific effects of environmental exposures on epigenetic dysregulation, particularly during development. Sex-specific regional methylation patterns may provide more biological insight than individual DMPs because DNAm measured at individual loci is subject to measurement error, DNAm is correlated over short distances [Citation27], and CpG islands commonly occur in functionally relevant chromosomal regions including promoters [Citation28]. Considering this motivation, our primary objective was to identify and compare DMRs associated with infant sex in cord blood, placenta, and umbilical artery samples by leveraging DNAm data measured using the Illumina Infinium HumanMethylation450 BeadChip as part of the PRogramming of Intergenerational Stress Mechanisms (PRISM) pregnancy cohort. These tissues have distinct roles in foetal development which may influence epigenetic signatures; the umbilical cord connects the foetus to the placenta and the umbilical artery transports blood from the foetus to the placenta. To determine if results replicated in an independent cohort, we analysed DMRs in a publicly available cord blood dataset from the Gene Expression Omnibus (GEO) repository (GEO Accession GSE129841). We also conducted an EWAS to identify DMPs in each tissue.
Methods
Study population:
The PRISM pregnancy cohort has been previously described [Citation29]. Briefly, PRISM is a cohort of mother-child pairs designed to investigate associations between perinatal stress, other environmental exposures, and child development. Women ≥18 years old and in the first or second trimester of pregnancy were recruited from the Beth Israel Deaconess Medical Center in Boston, MA from March 2011 to August 2012 and from the Icahn School of Medicine at Mount Sinai in New York City from November 2012 to August 2014. Additional inclusions criteria were having a singleton birth and English or Spanish speaking. Exclusion criteria were HIV+, reported drinking ≥7 alcoholic drinks/week before pregnancy recognition, or any alcohol during pregnancy. Maternal sociodemographics was collected at the first visit.
Ethics:
The PRISM study protocol was approved by the Institutional Review Boards at Brigham and Women’s Hospital (BWH) and the Icahn School of Medicine at Mount Sinai. All participants provided written informed consent in their primary language.
Sample collection:
Sample collection and DNAm measurement of cord blood and placenta tissues has previously been described [Citation30,Citation31]. Immediately following birth, cord blood, umbilical cord, and placenta samples were collected. Cord blood was separated into plasma and buffy coat using centrifugation and stored at −20°C. Blood was drained from cord samples, and samples were stored in saline solution at 4°C. Within 24 hours, samples were dissected by separating the arteries and vein, and stored at −80°C until DNA isolation. Immediately after birth, the placenta was collected [Citation32]. Four ~1 cm3 samples were extracted from the foetal side ~4 cm from the cord insertion site and 1–1.5 cm below the foetal membrane, and the decidua and foetal membranes were removed. Samples were rinsed in a cold phosphate-buffered saline bath, cut into ~0.1 cm3 pieces, and placed in RNAlater RNA Stabilization Reagent (Quiagen, Germantown, MD) for ≤ 24 hours; excess RNAlater was then removed and samples were stored at −80°C until DNA isolation.
DNA was isolated using the Gentra Puregene kit (Quiagen, Germantown, MD) according to the manufacturer’s instructions and quantified using an Implen Nanophotometer Pearl (Westlake Village, CA).
Epigenome-wide DNAm analysis:
DNAm measurement:
Sufficient DNA was available from 181, 234, 231 cord blood, placenta, and artery samples, respectively (Supplemental Figure 1). DNA was bisulphite converted and DNAm was measured using the 450K array (Illumina, San Diego, CA) according to the manufacturer’s instructions by the Partners HealthCare Translational Genomics Core Labs. The 450K array measures single nucleotide-resolution DNAm at >485,000 methylation sites [Citation33]. To minimize batch effects, stratified randomization was used to randomize samples to chips and plates; the position of samples within plates was also determined by randomization.
Quality control and DNAm data processing:
Raw methylation .idat files were processed using the R package ewastools [Citation34,Citation35]. The following quality control steps were implemented: samples that were outliers in principal components analysis (PCA) and potentially contaminated samples were removed, genetic fingerprinting using 65 Illumina SNP probes was performed and compared across tissues from the same donor, sex was confirmed using X and Y chromosome probe intensities, and dye bias was corrected for using RELIC [Citation36]. One cord blood sample, one placenta sample, and two artery samples were removed in quality control checks. Observations with detection p-values < 0.05 were removed [Citation35]. Density distributions of Beta-values were examined and samples that did not follow the expected bimodal distribution were removed (cord blood n = 1; placenta n = 4) (Supplemental Figure 1). Technical replicates from 6, 5 and 4 for cord blood, placenta, and artery samples, respectively, were included across chips and plates. DNAm levels of replicated samples were highly correlated, indicating good precision (cord blood rPearson range: 0.98–0.99; placenta rPearson range: 0.98–0.99; placenta rPearson range: 0.98–1.00).
Beta-values were transformed into M-values using the formula log2(Beta/(1-Beta)). PCA was performed and the top PCs were plotted to identify batch effects of plate, row, well, and column. Missing values were imputed as the probe median M-value, data were adjusted for batch effects of plate using the ComBat [Citation37] implemented in the sva package [Citation38], and imputed values were replaced as missing.
Our analyses focused on autosomal chromosomes; probes annotated to X and Y chromosomes (11,648) were removed. In addition, probes previously identified as cross-reactive (29,233) by Chen et al. [Citation39], probes located within 10 base pairs of a known SNP with minor allele frequency ≥ 0.05 in an American admixture population (34,167), and probes with missing values in ≥ 10% of samples were dropped (cord blood: 559; placenta: 426; artery: 401). The number of samples and probes available for analysis were 179 and 414,940 for cord blood, 229 and 415,073 placenta, and 229 and 415,092 for artery samples, respectively (Supplemental Figure S1).
Four ancestry-related PCs were estimated using EPISTRUCTURE [Citation40]. Cell type heterogeneity was adjusted for using ReFactor, a reference-free approach that uses PCA implemented on a sparse set of methylation sites to estimate components that can serve as a proxy for cell-type proportion estimates [Citation41]. Before implementing ReFactor, missing values were imputed as the probe median M-value and M-values were transformed to Beta-values. The number of ReFactor components (k) was selected based on the ratio between adjacent eigenvalues, which provides information on axes of variance in data, as implemented by the estimate_k function (plots of the eigenvalue ratios are provided in Supplemental Figures S6–S8). We used six components for cord blood, eight components for placenta, and six components for artery. We used 500 sites (i.e., number of informative features: t) to calculate refactor components. The selected value of t was confirmed using the estimate_t function. For sensitivity analyses, cell-type proportions of cord blood samples was estimated using the Houseman projection method [Citation42] implemented through ewastools using the Gervin et al. [Citation43] and Bakulski et al. [Citation44] cord blood reference datasets. The Gervin et al. reference set provides estimates for the proportions of CD8 + T cells, CD4 + T cells, natural killer (NK) cells, B cells, monocytes, and granulocytes, whereas the Bakulski et al. reference set also includes nucleated red blood cell (nRBC) estimates. As described in Gervin et al. [Citation43] nRBC DNAm profiles are not fully characterized and may have substantial inter-individual variability, which could contribute to decreased validity of estimated nRBC proportions. For placenta samples, the proportions of trophoblasts, stromal cells, Hofbauer cells, endothelial cells, nRBC, and syncytiotrophoblasts were estimated using the minfi projectCellType function and the third trimester (term) Yuan et al. placenta reference dataset [Citation45]. The reference dataset includes 600 CpGs with methylation level measured using the Illumina EPIC methylation array and therefore 574 probes common to our placenta data and the reference dataset were used as input. Reference datasets are not available for artery.
Data analysis:
Descriptive statistics:
We calculated descriptive statistics (medians and IQRs for continuous variables, frequencies for categorical variables) for all covariates. Differences between tissues in the characteristics of mother-infant pairs were assessed using the Mann–Whitney test for continuous variables and χ2 test for categorical variables. Pearson correlations for DNAm levels across tissues were calculated for each individual with DNAm available for multiple tissues.
Differentially methylated regions:
Differentially methylated positions were identified using the R package DMRcate [Citation46]. This method fits a linear model to all probes and applies a Gaussian kernel smoother to test statistics within λ base pairs. Smoothed test statistics and p-values are calculated using the Satterthwaite method and significant probes are determined after an FDR adjustment [Citation47]. Significant probes within λ base pairs are grouped to determine DMRs. DMRcate is agnostic to the direction of association at individual probes between DNAm and the predictor. We implemented DMRcate on M-values with λ = 1,000, the FDR cut-off = 0.01, and the minimum number of probes in a DMR = 10. We selected a more stringent FDR cut-off and greater number of probes to define a DMR than the default parameters to allow us to identify DMRs more likely to have biological relevance. In our primary analysis, models were adjusted for ReFactor components.
Differentially methylated positions:
We identified DMPs associated with sex using the R package limma which implements linear models with empirical Bayes smoothing of standard errors. Limma was applied to M-values adjusting for ReFactor components. We applied a Bonferroni correction to p-values using the p.adjust function in R with calculates adjusted p-values as p × the number of tests (i.e., pi,Bonferroni = pi × N).
Gene ontology analysis:
GO analysis was conducted using the GOregion [Citation48] function for DMRs or the GOmeth [Citation49] function for DMPs in the missMethyl package [Citation50]. GOregion and GOmeth identify GO terms with an overrepresentation of genes containing DMPs accounting for differences in the a priori probabilities of genes to include differential methylation based on representation on the 450K array. For each tissue, all probes tested and DMRs or DMPs (pBonferroni < 0.05) were used as arguments.
Sensitivity analyses:
Although we did not observe associations between infant sex and maternal age, race/ethnicity, or gestational age (), sensitivity analyses were performed adding these variables as precision covariates to the DMRcate and limma models. We also performed sensitivity analyses adjusting for cell-type proportions estimated using the Gervin et al. [Citation43] and Bakulski et al. [Citation44]. reference datasets for cord blood and the Yuan et al. reference dataset for placenta [Citation45]. To determine if differences among infants with data of each tissue type may affect results, we performed analyses restricted to infants with data available for all three tissues.
Table 1. PRISM participant characteristics by tissue and associations with infant sex.
Replication analysis:
We tested for DMRs associated with sex in an independent cord blood dataset (GEO Accession GSE129841) including DNAm from 60 males and 54 female infants. Data were imported to R using GEOquery and minfi, and Beta-values were extracted from the GenomicRatioSet. Data were processed as previously described by Kadakia et al. [Citation51]. Briefly, samples with > 5% of probes with detection p-values > 0.01 were dropped. Probes with detection p-values > 0.01 in > 5% of samples, probes measuring SNPs or non-CpG sites, probes located near SNPs, and probes located on sex chromosomes were removed. Data were corrected for background noise and channel colour bias and quantile normalized. Batch effects were adjusted for using ComBat. We additionally removed cross-reactive probes identified by Chen et al. [Citation39]. and probes with minor allele frequencies > 0.05 located < 10 base pairs from the target site, resulting in 390,729 probes for analysis. ReFactor was applied to estimate six cell type-related components. DMRs were identified using DMRcate adjusting for ReFactor components with the FDR cut-off = 0.01, λ = 1,000, and the minimum number of CpGs = 10. DMPs were identified using limma adjusting for ReFactor components. We evaluated overlap between DMRs and DMPs (pBonferroni < 0.05) identified in the GEO and the PRISM cord blood analyses. In addition, we used a lookup approach to assess replication of PRISM cord blood DMPs with an FDR adjustment for multiple comparisons among probes included in both analyses.
All analysis were conducted in R 4.0.0 [Citation52].
Results
Participant characteristics:
For these analyses, DNAm was available from N = 179 cord blood, N = 229 placenta, and N = 229 umbilical artery samples (Supplemental Figure S1). Overlap between tissues was 165 mother-infant pairs for cord blood and placenta, 169 for cord blood and artery, and 218 for placenta and artery; 159 mother-infant pairs had data available for all tissues. The median age of mothers at delivery was 31.3–32.0 years for each tissue (). Approximately 40% of mothers were Black, one-third were White, and one-quarter were Hispanic or other. Slightly over half of infants were male (cord blood: 54%; placenta: 55%; artery: 54%), and less than 10% were preterm or had low birth weight (cord blood: 6%; placenta: 7%; artery: 6%). Maternal age at delivery, education, race, gestational age, and birth weight were not significantly different between sexes or tissues (p < 0.05).
We assessed associations between infant sex and cell-type related components (i.e., ReFactor components) (Supplemental Excel Table S1). Infant sex was associated with the second component in cord blood (female vs. male: B = −3.15, p = 0.046), the seventh component in placenta samples (B = 0.35, p = 0.037), and the fifth component in artery samples (B = 0.42, p = 0.021). Using cellular proportions estimated using the Houseman regression calibration method, infant sex was associated with the proportion of CD8 + T cells (Bakulski et al. reference set Citation44 B = −0.02, p = 0.002) in cord blood, and with the proportion of trophoblasts (Yuan et al. reference dataset Citation45 B = 0.02, p = 0.037), Hofbauer cells (B = −0.003, p = 0.007), and syncytiotrophoblasts (B = −0.02, p = 0.034).
DNAm levels within individuals were highly correlated across tissues. For cord blood and placenta samples, the range of rPearson was 0.82–0.88 (N = 165; p < 0.001); for cord blood and artery samples, the range of rPearson was 0.88–0.93 (N = 169; p < 0.001); and for placenta and artery samples, the range of rPearson was 0.85–0.90 (N = 218; p < 0.001).
Differentially methylated regions:
In models adjusted for cellular heterogeneity, we identified 183, 257, and 419 DMRs in cord blood, placenta, and artery samples, respectively (summarized in ) The top-10 significant DMRs for each tissue are listed in and all DMRs are included in Supplemental Excel Tables S2-S4. DMRs were located on all chromosomes except chromosome 9. Within all three tissues, the highest proportion of DMRs was located in chromosome 6 (cord blood: 32, 17%; placenta: 52, 20%; artery: 57, 14%). DMRs also included multiple imprinted genes (cord blood: PLAGL1, INS); placenta: TP73, HOXA4, DLX5, GNAS, LRRTM1, OSBPL5, CDKN1C; artery: PLAGL1, DLK1, DLX5, KCNQ1, CMTM1, ATP10A, NNAT) [Citation53]. Although the direction of association may not be consistent across a DMR, DMRs identified in cord blood and artery samples showed a trend towards higher methylation levels in females compared to males (cord blood mean difference in methylation for females vs. males > 0 in 163 DMRs (89%); artery mean difference in methylation > 0 in 391 DMRs (93%)) (). However, DMRs in placenta samples tended to have higher methylation among males compared to females (mean difference in methylation for females vs. males > 0 in 100 DMRs (39%)).
Table 2. Summary of differentially methylation regions (DMRs) and positions (DMPs) associated with infant sex. DMRs identified using DMRcate with the FDR cut-off = 0.01, λ = 1,000, and the minimum number of CpGs = 10. DMPs identified using limma applied to M-values. All models adjusted for cellular heterogeneity using ReFactor components.
Table 3. Ranking of top-10 DMRs associated with infant sex. DMRs identified using DMRcate modelling females vs. males adjusting for ReFactor components with the FDR cut-off = 0.01, λ = 1,000, and the minimum number of CpGs = 10. DMRs ordered by Fisher combined probability transform of the individual CpG FDRs.
Figure 1. Overlap between DMRs in cord blood, placenta, and artery samples associated with infant sex. DMRs identified using DMRcate modelling females vs. males and adjusting for ReFactor components with the FDR cut-off = 0.01, λ = 1,000, and the minimum number of CpGs = 10. DMRs with consistently higher mean methylation among females are represented in Orange, DMRs with consistently higher mean methylation among males are represented in purple, and DMRs with different mean directions of association between tissues are represented in grey. Mean differences in % methylation for each DMR are displayed in the scatter plot. Cord blood: N = 179; placenta: N = 229; artery: N = 229.
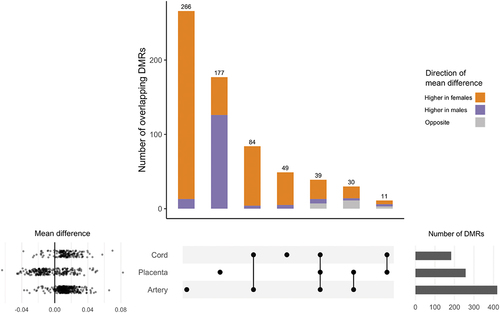
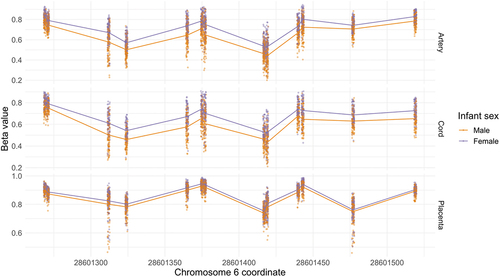
The number of DMRs that overlapped between tissues (i.e., share at least one CpG) are shown in . We identified 39 DMRs overlapping across all cord blood, placenta, and artery samples (). The direction of association between mean methylation levels and infant sex was consistent across tissues for 32 overlapping DMRs, with 26 having consistently higher methylation among females and 6 having higher methylation among males (). Eight (21%) the DMRs overlapping across tissues were located on chromosome 6, including 6 DMRs within the human leukocyte antigen (HLA) region (chr6:28,477,797–33,448,354). To illustrate this trend in association, Beta-values of the DMR chr6:28,601,269–28,601,519 are plotted in .
Table 4. Overlapping differentially methylated regions (DMRs) associated with infant sex in cord blood, placenta, and artery samples. DMRs identified using DMRcate modelling females vs. males adjusting for ReFactor components with the FDR cut-off = 0.01, λ = 1,000, and the minimum number of CpGs = 10. DMRs ordered by chromosomal coordinate.
Figure 2. Scatter plot of DMR chr6: 28,601,269–28,601,519.
Results of GO analyses are summarized in ; a complete list of significant GO terms is included in Supplemental Excel Table S5. In cord blood, we identified one GO term with on overrepresentation of genes including DMRs (homophilic cell adhesion via plasma membrane adhesion molecules), and in placenta samples, we identified nine closely related GO terms involving organ and skeletal system morphogenesis (pFDR < 0.05). A total of 39 GO terms were identified for artery samples, including embryo development; organ, skeletal system, and eye morphogenesis; male meiotic nuclear division; DNA binding and regulation of gene expression by RNA polymerase II; and chromosome and chromatin (pFDR < 0.05).
Table 5. Summary of Gene Ontology (GO) analyses of differentially methylated regions (DMRs) and positions (DMPs). One, 3, and 39 GO terms were identified with an overrepresentation of DMRs associated with infant sex in cord blood, placenta, and artery samples, respectively (pFDR < 0.05). Twenty-eight and 9 GO terms were identified with an overrepresentation of DMPs associated with infant sex in cord blood in placenta and artery samples, respectively (pFDR < 0.05). No GO terms were associated to infant sex in cord blood (pFDR > 0.05). Closely related GO terms have been combined; for a complete list of sex-associated GO terms, see Supplemental Tables S2 and S4.
Table 6. Top-10 DMPs associated with infant sex ranked by p-value. DMPs identified using limma applied to M-values modelling females vs. males and adjusting for ReFactor components. Effect size estimates from limma applied to Beta-values. Bolded CpGs were identified in more than one tissue.
Sensitivity analyses:
Results of sensitivity analyses are summarized in Supplemental Excel Table S6, including the total number of DMRs identified and DMRs overlapping with our primary analyses. Overall, the number of DMRs identified and directions of association were consistent with our primary analyses. Including the covariates of ancestry-related PCs, maternal age, and gestational age, we identified 179, 277, and 421 DMRs in cord blood, placenta, and artery samples, respectively, of which 96%, 88%, and 95% overlapped with DMRs in our primary analyses. In analyses limited to infants with data available for all three tissues (N = 159), we identified fewer DMRs than analyses including all samples but with high overlap (cord blood: 169 DMRs with 90% overlapping with primary analyses; placenta: 183 DMRs with 89% overlapping; artery: 226 DMRs with 98% overlapping).
We also conducted sensitivity analyses for cellular heterogeneity corrections in cord blood and placenta by estimating the cell proportions using the Houseman regression calibration method[Citation42]. In cord blood, adjusting for CD8 + T cells, CD4 + T cells, NK cells, B cells, monocytes, and granulocytes, we identified 159 DMRs (90% overlapping with primary analyses); including nRBCs, we identified 202 DMRs (77% overlapping). In placenta samples, adjusting for trophoblasts, stromal cells, Hofbauer cells, endothelial cells, nRBCs, and syncytiotrophoblasts, we identified 162 DMRs (81% overlapping).
Replication analysis:
We conducted analyses to identify DMRs in a cord blood DNAm dataset from an independent cohort (GEO Accession GSE129841)[Citation51]. In analyses adjusted for ReFactor components, we identified 47 DMRs associated with infant sex (Supplemental Excel Table S7). As observed in our primary analyses, 44 DMRs (94%) had higher mean methylation levels among females, and the highest proportion (19%) were located in chromosome 6. There was substantial overlap between DMRs identified in the GEO analyses and analyses of associations in PRISM cord blood samples; 40 (85%) of GEO DMRs overlapped with DMRs identified in PRISM, 38 of which had consistent median mean methylation differences between sexes and 16 of which had complete overlap between cohorts.
Differentially methylated positions:
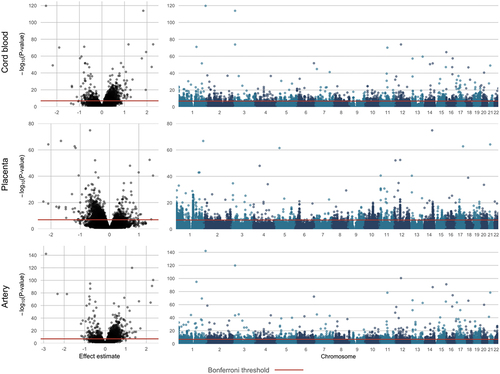
In our primary analyses adjusted for cellular heterogeneity using ReFactor components, we identified 2,119 DMPs associated with infant sex in cord blood, 2,281 DMPs in placenta, and 3,405 DMPs in artery samples (pBonferroni < 0.05, ). Quality checks and results visualization for each tissue are in Supplemental Figures S2-S4 and ; DMPs (pBonferroni < 0.05) are in Supplemental Excel Tables S8-S10. In cord blood and artery samples, DMPs predominantly had higher methylation levels among females compared to males (92% and 93%, respectively); however, in placenta samples, only 13% of DMPs had higher methylation among females compared to males. The highest proportion of DMPs were located near transcription start sites (TSS200 or TSS1500, cord blood: 34%; placenta: 23%; artery: 34%) or in gene bodies (cord blood: 29%; placenta 34%; artery: 30%), followed by untranslated regions (5ʹ or 3ʹ UTR, cord blood: 14%; placenta: 16%; artery: 14%) and exons (cord blood: 7%; placenta: 6%; artery: 6%). Across tissues, approximate 30% of DMPs were located in intergenic regions (cord blood: 29%; placenta: 33%; artery: 28%).
Figure 3. Volcano and Manhattan plots for DMPs associated with infant sex.
The top-10 most significant DMPs in each tissue are listed in ; estimates from models of Beta-values are included to ease results interpretation. Notably, in cord blood and artery samples, a smaller proportion of the top-10 most significant DMPs had higher methylation among females (5 DMPs in cord blood, 3 DMPs in placenta, and 4 in artery samples). cg12691488, located in an intergenic region of chromosome 1, was the most significant DMP in cord blood and artery samples and the second most significant DMP in placenta samples (cord blood: pBonferroni = 8.75 × 10−115; placenta: pBonferroni = 6.50 × 10−62; artery: pBonferroni = 3.05 × 10−137). Additional highly significant DMPs identified across tissues were annotated to FOXN3 (cg02325951, placenta: pBonferroni = 5.85 × 10−70; artery: pBonferroni = 7.37 × 10−82), RFTN1 (cg11643285, cord blood: pBonferroni = 6.27 × 10−109; artery: pBonferroni = 5.48 × 10−115), KRT77 (cg03691818, cord blood: pBonferroni = 4.51 × 10−69; placenta: pBonferroni = 1.58 × 10−47; artery: pBonferroni = 1.08 × 10−95), RNASEH2C (cg25294185, cord blood: pBonferroni = 2.87 × 10−65; artery: pBonferroni = 2.67 × 10−73), AMDHD2 (cg26921482, cord blood: pBonferroni = 6.01 × 10−60; artery: pBonferroni = 3.27 × 10−86), and GABPA; ATP5J (cg17612569, placenta: pBonferroni = 2.69 × 10−59; artery: pBonferroni = 1.65 × 10−73). For each of these DMPs, the direction of association was consistent across tissues.
We observed overlap of DMPs across tissues, with the largest overlap (805 DMPs) in cord blood and artery samples (Supplemental Figure S5). A total of 127 DMPs were common across all three tissues. Substantially higher overlap was observed among the most significant DMPs. When comparing the top 100 DMPs ranked by p-value for each tissue, 29 DMPs were identified in all three tissues, and an addition 37 DMPs were identified in both cord blood and artery samples.
In GO analysis, no GO term was associated with infant sex in cord blood (pFDR > 0.05). However, 28 and 9 GO terms had an overrepresentation of DMPs in placenta and artery samples, respectively (pFDR < 0.05) (summarized in ; complete results listed in Supplemental Excel Table S11). GO terms associated with sex in placenta samples were related to development, particularly of the epithelium, and immune function (e.g., chemokine-mediated signalling pathways), whereas significant GO terms in artery samples were related to transcription regulation, including DNA binding by RNA polymerase II.
Sensitivity analyses:
Sensitivity analyses of DMPs are summarized in Supplemental Table S6. In models including ancestry-related PCs, maternal age at delivery, and gestational age, we identified 2,086 DMPs in cord blood (pBonferroni < 0.05; 93% identified in our primary analyses); 2,805 DMPs in placenta samples (79% identified in our primary analyses); and 3,210 DMPs in artery samples (98% identified in our primary analyses). Restricting analyses to infants with data available for all three tissues, we identified fewer DMPs but observed substantial overlap with DMPs in our primary analyses: of the 2,012, 1,416, and 1,586 DMPs (pBonferroni < 0.05) in cord blood, placenta, and artery, respectively, 95%, 92%, and 97% were identified in our primary analyses. Similar to our primary analyses, among the top-100 DMPs, 29 were common to cord blood, placenta, and artery analyses; however, among all DMPs, only 69 were common across tissues.
Overall results were consistent when adjusting for Houseman-estimated cell-type proportions. For analyses of cord blood including the proportions of CD8 + T cells, CD4 + T cells, NK cells, B cells, monocytes, and granulocytes we identified 2,192 DMPs (pBonferroni < 0.05), of which 83% were also significant in ReFactor-adjusted analyses (pBonferroni < 0.05). Using estimates from the Bakulski et al. dataset [Citation44], which includes nRBC proportions, we found 2,114 DMPs (pBonferroni < 0.05), including 84% overlapping with DMPs identified in ReFactor-adjusted analyses (pBonferroni < 0.05). In placenta analyses, including the proportions of trophoblasts, stromal cells, Hofbauer cells, endothelial cells, nRBCs, and syncytiotrophoblasts, we identified fewer DMPs than in ReFactor-adjusted analyses (1,325 vs. 2,281, pBonferroni < 0.05); however, 96% of these DMPs were also identified in our ReFactor-adjusted analyses.
Replication analysis:
We identified 514 DMPs in the GEO cord blood dataset using linear models adjusted for ReFactor components (pBonferroni < 0.05; Supplemental Excel Table S12), of which 432 (84%) were significant in cord blood in PRISM (pBonferroni < 0.05). As we observed in PRISM cord blood analyses, DMPs primarily had higher methylation among females (441; 86%). Additionally, we used a lookup approach of the 2,029 PRISM cord blood DMPs included in the replication analysis. Among these probes, 1,941 (96%) were significant at pFDR < 0.05 (corrected for 2,029 comparisons) and 2,027 had a consistent direction of association between cohorts.
Consistency with previous studies:
We compared our results to DMPs reported previously reported in 450K-based EWAS of cord blood and placenta samples reported by Yousefi et al., Maschietto et al., and Martin et al. [Citation22,Citation24,Citation25]. A total of 4,562 unique DMPs were identified in cord blood and placenta tissues in these three studies. Among 4,473 DMPs identified in cord blood by Yousefi et al. and Maschietto et al., 4,715 were included in our analyses of cord blood in PRISM, 2,679 (50%) of which were significant at pBonferroni < 0.05 and 4,870 (91%) were nominally significant at p < 0.05. Among the 91 DMPs identified in placenta samples by Martin et al., all were significant at pBonferroni < 0.05 in our analyses of placenta samples in PRISM.
Discussion
This study of differential methylation levels by infant sex is unique in assessing epigenetic patterns across three birth tissues. We identified 183, 257, and 419 DMRs in cord blood, placenta, and artery samples, respectively. We replicated analyses in cord blood DNAm data from an independent cohort (GEO Accession GSE129841); 85% of DMRs overlapped with those identified in PRISM.
There was substantial overlap between DMRs across tissues, with 39 overlapping DMRs identified in all three tissues, 84 identified in cord blood and artery samples, 30 identified in placenta and artery samples, and 11 identified in cord blood and placenta samples. Among DMRs overlapping across tissues, several were annotated to autosomal genes related to characteristics of sexual dimorphism. The TSS200 and TSS1500 regions of genes involved in spermatogenesis, including NFkB activating protein-like (NKAPL)[Citation54], fidgetin-like1 (FIGNL1) [Citation55], piwi like RNA-mediated gene silencing 2 (PIWIL2) [Citation56], and aurora kinase C (AURKC) [Citation57] were annotated to DMRs common across all three tissues with consistently higher mean methylation among females. Similarly, male meiotic nuclear division was a significant GO term for DMRs in artery samples (pFDR < 0.05). A DMR overlapping with ligand dependent nuclear receptor interacting factor 1 (LRIF1) [Citation58], involved in X–inactivation, was also identified in all tissues with higher methylation in cord blood and artery and lower methylation in placenta among females. In addition, sex-associated GO terms for placenta and artery regional analyses were related to organ and skeletal system development.
We also identified 2,119, 2,281, and 3,405 sex-associated DMPs in cord blood, placenta, and artery samples, respectively (pBonferroni < 0.05). In replication analyses in the GEO cord blood dataset, 84% of DMPs were significant in PRISM (pBonferroni < 0.05). Our results were also consistent with DMPs previously identified in EWAS of foetal tissues [Citation22,Citation24,Citation25]; 50% and 100% of previously-reported DMPs in cord blood and placenta samples, respectively, were significant in our study (pBonferroni < 0.05). We observed greater overlap in DMPs across tissues and with previous studies among the most significant sites. Of the 127 DMPs (pBonferroni < 0.05) common to cord blood, placenta, and artery samples, 29 were among the top-100 significant sites in all three tissues. In addition, among the top-10 significant cord blood DMPs, seven were among the top-10 found in artery samples and six were among the top-10 identified in cord blood by Yousefi et al. [Citation22].This proportion of overlap among highly significant DMPs with large effect sizes may indicate a strong epigenetic signature of sex at specific CpGs. However, two of these DMPs (cg17238319 and cg25294185) may also be a technical artefact caused by cross-hybridization of sex chromosomes to array probes target autosomal regions, as previously suggested [Citation59].
Although we observed overlap in DMRs and DMPs across tissues, the trend in directions of association was not consistent. Overall, higher mean methylation was observed among females compared to males in cord blood and artery samples. DNAm of placenta samples was highly and positively correlated with that of cord blood and artery samples; however, higher mean methylation of DMRs and DMPs in placenta samples was observed among males compared to females. This direction of association in placenta has previously been reported [Citation24] however, the biological reason is not understood. The placenta is unique as a maternal-foetal interface that functions in nutrient and waste transfer, thermo-regulation, and gas exchange. As the organ involved in foetal growth and resource allocation with balance between the maternal and paternal genomes, the placenta has high expression of paternal imprinted genes [Citation60]. Considering the invasive nature of foetal extravillous trophoblasts, HLA genes expressed by the placenta are involved in moderating maternal immune tolerance [Citation61]. Higher expression of autosomal immune-regulating genes in female placentas has also been observed, including interleukin 2 receptor, beta (IL2RB) and C-X-C motif chemokine ligand 1 (CXCL1) [Citation62]. Although we did not observe differential methylation of imprinted genes previously reported as differentially expressed in the placenta [Citation63], we did identify placental sex-related DMRs annotated the imprinted genes TP73, HOXA4, DLX5, GNAS, LRRTM1, OSBPL5, CDKN1C. In addition, we identified a DMP annotated to IL2RB (cg21307484, pBonferrni = 0.012; mean difference in methylation for females vs. males B = −3.76), and GO analysis of DMPs indicated an overrepresentation of GO terms related to chemokine activity among placenta DMPs, including chemokine-mediated signalling pathway (GO:0070098) and chemokine receptor binding (GO:0042379).
This study had several limitations. We were not able to assess sex differences in gene expression, which may provide more information about the biological relevance of differential methylation. In addition, use of bisulphite conversion to measure DNAm does not allow for differentiation between 5-methylcytosine and 5-hydroxymethylcytosine, an intermediate nucleotide modification in active demethylation [Citation64]. 5-hydroxymethylcytosine is substantially less abundant in the human genome [Citation65], but may provide information about the dynamics of DNAm patterns, particularly during periods of epigenetic reprogramming. Our study was also limited by the use of the 450K array to measure DNAm levels. Although this array includes over 99% of RefSeq genes [Citation33], probes are not evenly distributed throughout the genome. Biases in representation could impact analyses of DMRs, particularly when restricted to regions containing a higher number of CpGs. It should also be noted that our choice of DMRcate for analysing regional associations may affect results. There are currently several available methods for detecting DMRs but no established gold-standard. Although DMRcate may have lower power than other approaches, evaluations have shown good control of Type-I errors [Citation66] and greater performance measured using the area under the precision–recall curve than other methods [Citation46]. Our replication analysis was limited in being restricted to cord blood due to publicly available DNAm datasets with sufficient sample sizes for other foetal tissue types. In addition, different preprocessing methods were applied to our cord blood dataset and the GEO replication dataset (e.g., quantile normalization was applied to GEO Accession GSE129841). Although this could limit replication, consistency in results between our primary and replication analyses demonstrates robustness of our findings.
The study was novel in including DNAm measured in multiple foetal tissues from the same cohort, allowing us to compare sex-associated DMRs and DMPs identified in cord blood, placenta, and artery samples. In addition, this was the first study to our knowledge to report associations between sex and DNAm measured in artery samples. Our study was strengthened by having a larger sample size than previous EWAS of infant sex in cord blood [Citation22,Citation25] or placenta samples [Citation24], which increased statistical power. Furthermore, results of sensitivity analyses adjusting for maternal age, ancestry, and gestational age or Houseman cell-type proportions, as well as results of replication analyses in an independent birth cohort, were consistent with our primary analyses, indicating robustness of our findings.
Further research is necessary to understand biological mechanisms that may contribute to differences in DNAm signatures across tissues, as well as to determine if sexual dimorphism in the epigenome is related to differences in gene expression and response to environmental stressors.
Author contributions
Anne Bozack: conceptualization, methodology, formal analysis, investigation, writing – original draft, visualization; Elena Colicino: methodology, writing – review & editing; Allan Just: data curation; Robert Wright: writing – review & editing; Andrea Baccarelli: writing – review & editing; Rosalind Wright: conceptualization, writing – review & editing, supervision, project administration, funding acquisition; Alison Lee: conceptualization, writing – review & editing, supervision.
Supplemental Material
Download Zip (1.2 MB)Acknowledgments
We would like to thank Dr. Andres Cardenas from the UC Berkeley School of Public Health for his expertise in analytical methods for conducting epigenome-wide association studies.
Disclosure statement
No potential conflict of interest was reported by the author(s).
Data Availability
R script for analysis of replication analyses using GEO Accession GSE129841 is available at https://github.com/annebozack/GEO_infant_sex_rep_analysis. Additional data available upon request to the corresponding author.
Supplementary material
Supplemental data for this article can be accessed here
Additional information
Funding
Related Research Data
References
- Reik W, Dean W, Walter J, et al. Epigenetic reprogramming in mammalian development. Science. 2001;293(5532):1089–1093.
- Li C, Fan Y, Li G, et al. DNA methylation reprogramming of functional elements during mammalian embryonic development. Cell Discov. 2018;4(1):1–12.
- Heindel JJ, Vandenberg LN. Developmental origins of health and disease: a paradigm for understanding disease cause and prevention. Curr Opin Pediatr. 2015;27(2):248–253.
- Perera F, Herbstman J. Prenatal environmental exposures, epigenetics, and disease. Reprod Toxicol. 2011;31(3):363–373.
- Wiklund P, Karhunen V, Richmond RC, et al. DNA methylation links prenatal smoking exposure to later life health outcomes in offspring. Clin Epigenetics. 2019;11(1). DOI:10.1186/s13148-019-0683-4.
- Richmond RC, Suderman M, Langdon R, et al. DNA methylation as a marker for prenatal smoke exposure in adults. Int J Epidemiol. 2018;47(4):1120–1130.
- Schroeder DI, Blair JD, Lott P, et al. The human placenta methylome. Proc. Natl. Acad. Sci. U. S. A. 2013;110(15):6037–6042.
- Gong S, Johnson MD, Dopierala J, et al. Genome-wide oxidative bisulfite sequencing identifies sex-specific methylation differences in the human placenta. Epigenetics. 2018;13(3):228–239.
- Chiu YM, Hsu HL, Wilson A, et al. Prenatal particulate air pollution exposure and body composition in urban preschool children: examining sensitive windows and sex-specific associations. Environ Res. 2017;158:798–805.
- Lee A, Leon Hsu -H-H,Chiu YM, et al. Prenatal fine particulate exposure and early childhood asthma: effect of maternal stress and fetal sex. J. Allergy Clin. Immunol. 2018;141(5):1880–1886.
- Bose S, Rosa MJ, Mathilda Chiu Y-H, et al. Prenatal nitrate air pollution exposure and reduced child lung function: timing and fetal sex effects. Environ. Res. 2018;167:591–597.
- Rosenfeld CS, Trainor BC. Environmental health factors and sexually dimorphic differences in behavioral disruptions. Curr. Environ. Heal. Reports. 2014;1(4):287–301.
- Miura R, Araki A, Minatoya M, et al. An epigenome-wide analysis of cord blood DNA methylation reveals sex-specific effect of exposure to bisphenol A. Sci. Rep. 2019;9(1):1–13.
- Alvarado-Cruz I, Alegría-Torres JA, Montes-Castro N, et al. Environmental epigenetic changes, as risk factors for the development of diseases in children: a systematic review. Ann. Glob. Heal. 2018;84(2):212–224.
- Martin EM, Fry RC. Environmental influences on the epigenome: exposure- associated DNA methylation in human populations. Annu Rev Public Health. 2018;39(1):309–333.
- Dieckmann L, Lahti-Pulkkinen M, Kvist T, et al. Characteristics of epigenetic aging across gestational and perinatal tissues. Clin Epigenetics. 2021;13(1):1–17.
- McCabe C, Anderson OS, Montrose L, et al. Sexually dimorphic effects of early-life exposures to endocrine disruptors: sex-specific epigenetic reprogramming as a potential mechanism. Curr. Environ. Heal. Reports. 2017;4(4):426–438.
- Rosenfeld CS. Sex-specific placental responses in fetal development. Endocrinology. 2015;156(10):3422–3434.
- Nugent BM, Bale TL. The omniscient placenta: metabolic and epigenetic regulation of fetal programming. Front Neuroendocrinol. 2015;39:28–37.
- Bale TL. Sex differences in prenatal epigenetic programing of stress pathways. Stress. 2011;14(4):348–356.
- Sharp AJ, Stathaki E, Migliavacca E, et al. DNA methylation profiles of human active and inactive X chromosomes. Genome Res. 2011;21(10):1592–1600.
- Yousefi P, Huen K, Davé V, et al. Sex differences in DNA methylation assessed by 450 K BeadChip in newborns. BMC Genomics. 2015;16(1). DOI:10.1186/s12864-015-2034-y.
- Maschietto M, Bastos LC, Tahira AC, et al. Sex differences in DNA methylation of the cord blood are related to sex-bias psychiatric diseases. Sci. Rep. 2017;7(1):1–11.
- Martin E, Smeester L, Bommarito PA, et al. Sexual epigenetic dimorphism in the human placenta: implications for susceptibility during the prenatal period. Epigenomics. 2017;9(3):267–278.
- Maschietto M, Bastos LC, Tahira AC, et al. Sex differences in DNA methylation of the cord blood are related to sex-bias psychiatric diseases. Sci. Rep. 2017;7(1).
- Cardenas A, Rifas-Shiman SL, Agha G, et al. Persistent DNA methylation changes associated with prenatal mercury exposure and cognitive performance during childhood. Sci. Rep. 2017;7(1). DOI:10.1038/s41598-017-00384-5.
- Eckhardt F, Lewin J, Cortese R, et al. DNA methylation profiling of human chromosomes 6, 20 and 22. Nat. Genet. 2006;38(12):1378–1385.
- Jaenisch R, Bird A. Epigenetic regulation of gene expression: how the genome integrates intrinsic and environmental signals. Nat. Genet. 2003;33(S3):245–254.
- Brunst KJ, Wright RO, DiGioia K, et al. Racial/ethnic and sociodemographic factors associated with micronutrient intakes and inadequacies among pregnant women in an urban US population. Public Health Nutr. 2014;17(9):1960–1970.
- De Carli MM, Baccarelli AA, Trevisi L, et al. Epigenome-wide cross-tissue predictive modeling and comparison of cord blood and placental methylation in a birth cohort. Epigenomics. 2017;9(3):231–240.
- Brunst KJ, Tignor N, Just A, et al. Cumulative lifetime maternal stress and epigenome-wide placental DNA methylation in the PRISM cohort. Epigenetics. 2018;13(6):665–681.
- Janssen BG, Byun H-M, Gyselaers W, et al. Placental mitochondrial methylation and exposure to airborne particulate matter in the early life environment: an ENVIRONAGE birth cohort study. Epigenetics. 2015;10(6):536–544.
- Illumina. Infinium HumanMethylation450 BeadChip data sheet. 2012.
- Heiss JA, Just AC. Identifying mislabeled and contaminated DNA methylation microarray data: an extended quality control toolset with examples from GEO. Clin Epigenetics. 2018;10(1). DOI:10.1186/s13148-018-0504-1
- Heiss JA, Just AC. Improved filtering of DNA methylation microarray data by detection p values and its impact on downstream analyses. Clin Epigenetics. 2019;11(1). DOI:10.1186/s13148-019-0615-3
- Xu Z, Langie SAS, De Boever P, et al. RELIC: a novel dye-bias correction method for Illumina Methylation BeadChip. BMC Genomics. 2017;18(1). DOI:10.1186/s12864-016-3426-3
- Johnson WE, Li C, Rabinovic A. Adjusting batch effects in microarray expression data using empirical Bayes methods. Biostatistics. 2007;8(1):118–127.
- Leek JT, Johnson WE, Parker HS, et al. The sva package for removing batch effects and other unwanted variation in high-throughput experiments. Bioinformatics. 2012;28(6):882–883.
- Chen Y, Lemire M, Choufani S, et al. Discovery of cross-reactive probes and polymorphic CpGs in the Illumina Infinium HumanMethylation450 microarray. Epigenetics. 2013;8(2):203–209.
- Rahmani E, Shenhav L, Schweiger R, et al. Genome-wide methylation data mirror ancestry information. Epigene Chromat. 2017;10(1). DOI:10.1186/s13072-016-0108-y.
- Rahmani E, Zaitlen N, Baran Y, et al. Sparse PCA corrects for cell type heterogeneity in epigenome-wide association studies. Nat Methods. 2016;13(5):443–445.
- Houseman EA, Accomando WP, Koestler DC, et al. DNA methylation arrays as surrogate measures of cell mixture distribution. BMC Bioinformatics. 2012;13(1). DOI:10.1186/1471-2105-13-86.
- Gervin K, Page CM, Aass HCD, et al. Cell type specific DNA methylation in cord blood: a 450K-reference data set and cell count-based validation of estimated cell type composition. Epigenetics. 2016;11(9):690–698.
- Bakulski KM, Feinberg JI, Yang J, et al. DNA methylation of cord blood cell types: applications for mixed cell birth studies. Epigenetics. 2016;11(5):354–362.
- Yuan V, Hui D, Yin Y, et al. Cell-specific characterization of the placental methylome. BMC Genomics. 2021;22(1):6.
- Peters TJ, Buckley MJ, Statham AL, et al. De novo identification of differentially methylated regions in the human genome. Epigenetics & Chromatin. 2015;8(1):6.
- Benjamini Y, Hochberg Y. Controlling the false discovery rate: a practical and powerful approach to multiple testing. J R Stat Soc. 1995;57:289–300.
- Maksimovic J, Oshlack A, Phipson B. Gene set enrichment analysis for genome-wide DNA methylation data. Genome Biol. 2021;22(1). DOI:10.1186/s13059-021-02388-x
- Geeleher P, Hartnett L, Egan LJ, et al. Gene-set analysis is severely biased when applied to genome-wide methylation data. Bioinformatics. 2013;29(15):1851–1857.
- Phipson B, Maksimovic J, Oshlack A. missMethyl: an R package for analyzing data from Illumina’s HumanMethylation450 platform. Bioinformatics. 2016;32(2):286–288.
- Kadakia R, Zheng Y, Zhang Z, et al. Association of cord blood methylation with neonatal leptin: an epigenome wide association study. PLoS One. 2019;14(12):e0226555.
- R Core Team. R: A Language and Environment for Statistical Computing. https://www.r-project.org/ (2015).
- Jirtle R. Geneimprint. http://www.geneimprint.com/.
- Okuda H, Kiuchi H, Takao T, et al. A novel transcriptional factor Nkapl is a germ cell-specific suppressor of notch signaling and is indispensable for spermatogenesis. PLoS One. 2015;10(4):e0124293.
- L'Hôte D, Vatin M, Auer J, et al. Fidgetin-like 1 is a strong candidate for a dynamic impairment of male meiosis leading to reduced testis weight in mice. PLoS One. 2011;6(11):e27582.
- Bak CW, Yoon T-K, Choi Y. Functions of PIWI proteins in spermatogenesis. Clin. Exp. Reprod. Med. 2011;38(2):61.
- Ben Khelifa M, Zouari R, Harbuz R, et al. A new AURKC mutation causing macrozoospermia: implications for human spermatogenesis and clinical diagnosis. Mol Hum Reprod. 2011;17(12):762-8.
- Nozawa R-S, Nagao K, Igami K-T, et al. Human inactive X chromosome is compacted through a PRC2-independent SMCHD1-HBiX1 pathway. Nat. Struct. Mol. Biol. 2013;20(5):566–573.
- Price ME, Cotton AM, Lam LL, et al. Additional annotation enhances potential for biologically-relevant analysis of the Illumina Infinium HumanMethylation450 BeadChip array. Epigene Chromat. 2013;6(1). DOI:10.1186/1756-8935-6-4.
- Wang X, Miller DC, Harman R, et al. Paternally expressed genes predominate in the placenta. Proc. Natl. Acad. Sci. U. S. A. 2013;110(26):10705–10710.
- Tilburgs T, Crespo ÂC, van der Zwan A, et al. Human HLA-G+ extravillous trophoblasts: immune-activating cells that interact with decidual leukocytes. Proc. Natl. Acad. Sci. 2015;112(23):7219–7224.
- Sood R, Zehnder JL, Druzin ML, et al. Gene expression patterns in human placenta. Proc. Natl. Acad. Sci. U. S. A. 2006;103(14):5478–5483.
- Pilvar D, Reiman M, Pilvar A, et al. Parent-of-origin-specific allelic expression in the human placenta is limited to established imprinted loci and it is stably maintained across pregnancy. Clin Epigenetics. 2019;11(1). DOI:10.1186/s13148-019-0692-3
- Klug M, Schmidhofer S, Gebhard C, et al. 5-Hydroxymethylcytosine is an essential intermediate of active DNA demethylation processes in primary human monocytes. Genome Biol. 2013;14(5):R46.
- Li W, Liu M, Li W, et al. Distribution of 5-hydroxymethylcytosine in different human tissues. J. Nucleic Acids. 2011;2011:1–5.
- Lent S, Cardenas A, Rifas-Shiman SL, et al. Detecting differentially methylated regions with multiple distinct associations. Epigenomics. 2021;13(6):451–464.