
ABSTRACT
A complex interplay of genetic and environmental risk factors influence global brain structural alterations associated with brain health and disease. Epigenome-wide association studies (EWAS) of global brain imaging phenotypes have the potential to reveal the mechanisms of brain health and disease and can lead to better predictive analytics through the development of risk scores.
We perform an EWAS of global brain volumes in Generation Scotland using peripherally measured whole blood DNA methylation (DNAm) from two assessments, (i) at baseline recruitment, ~6 years prior to MRI assessment (N = 672) and (ii) concurrent with MRI assessment (N=565). Four CpGs at baseline were associated with global cerebral white matter, total grey matter, and whole-brain volume (Bonferroni p≤7.41×10⁻⁸, βrange = −1.46x10⁻⁶ to 9.59 × 10⁻⁷). These CpGs were annotated to genes implicated in brain-related traits, including psychiatric disorders, development, and ageing. We did not find significant associations in the meta-analysis of the EWAS of the two sets concurrent with imaging at the corrected level.
These findings reveal global brain structural changes associated with DNAm measured ~6 years previously, indicating a potential role of early DNAm modifications in brain structure. Although concurrent DNAm was not associated with global brain structure, the nominally significant findings identified here present a rationale for future investigation of associations between DNA methylation and structural brain phenotypes in larger population-based samples.
Introduction
Global brain structure is influenced by genetic and environmental factors, and has previously been associated with health and disorder traits across the lifetime [Citation1–3]. For instance, changes in global grey and white matter have been observed in a number of psychiatric and neurological disorders, including schizophrenia [Citation4], major depressive disorder (MDD) [Citation3], bipolar disorder [Citation5], Rett syndrome [Citation6], and Alzheimer’s disease [Citation7]. Previous studies have also found age-related reductions in both grey and white matter [Citation8,Citation9].
Such global brain structural changes in both health and disease may reflect genetic and environmental factors and their impact. While previous studies have focussed on revealing the genetic architecture of brain structure, there are now opportunities to explore genetic and environmental risk factors through epigenetics, which correlate with changes in gene expression by modulating the genome in different cell types, without altering the underlying genome sequence [Citation10]. One such process, DNA methylation (DNAm), implicates the covalent addition of a methyl group to a cytosine nucleotide followed by guanine in DNA, resulting in Cytosine-phosphate-Guanine (CpG) sites [Citation10].
DNAm is modulated by both genetic and environmental factors, and may thus aid in identifying genetic and environmental contributions to health and disease [Citation11]. Several brain- related traits and diseases are associated with variation in DNAm. MDD, a moderately heritable disorder, has been associated with differential methylation at several CpG sites, with a methylation risk score explaining 1.75% of the variance in the disorder [Citation12]. Further, in an epigenome-wide association study (EWAS) using blood, CpG sites associated with depressive symptoms were annotated to genes involved in axonal guidance [Citation13]. Schizophrenia has been associated with epigenetic variation at multiple loci that contribute to the polygenicity of the disorder [Citation14,Citation15]. Finally, growing evidence has shown that DNAm can act as a proxy for the biological age of multiple tissues across life [Citation16]. These studies indicate that it may be possible, in future, to utilize DNAm modifications as biomarkers for brain-related healthy traits and diseases and to identify novel mechanisms contributing to these traits.
In recent years, increasing efforts have been made to identify epigenetic correlates of brain phenotypes, using both blood and brain tissue [Citation17,Citation18]. To maximize statistical power, previous studies have focused on candidate genes and candidate epigenetic markers in relation to specific brain regions of interest, such as subcortical volumes in the hippocampus and amygdala, as well as cortical thickness and volume in Freesurfer-derived brain regions [Citation18], although consistency between study findings is modest. Recent advances in high- throughput array technologies that can identify DNAm levels at over 450 K and 850 K locations along the genome have enabled researchers to identify DNAm-brain associations using a hypothesis-free approach using EWAS [Citation19]. DNAm modifications in relation to brain phenotypes have also been identified in patients as opposed to healthy individuals, including in the frontal cortex in schizophrenia [Citation20,Citation21], hippocampal volume in MDD [Citation22], in the cerebral cortex in Alzheimer’s disease [Citation23], and in the frontal cortex in Parkinson’s disease [Citation24]. Structural brain measures may therefore function as endophenotypes that can be used to assess the association between epigenetic modifications and brain health and disease.
The pathogenesis of psychiatric and neurodegenerative disorders has been associated with a multitude of cortical and subcortical brain regions with inconsistent results across studies [Citation3,Citation25–27], potentially indicating a role for whole-brain abnormalities in these disorders. Peripheral DNAm alterations associated with clinically relevant global brain structure may therefore further our mechanistic understanding of brain anatomy in both health and disease, may help to identify modifiable risk factors and may form a basis for the development of more accurate predictive risk scores capturing a wider array of potential influences.
The majority of the studies mentioned above used whole blood as a surrogate tissue for the brain due to inaccessibility of the brain ante-mortem. Although DNAm is reported to be tissue- and cell type-specific, similarities between blood and brain DNAm have also been identified [Citation28]. In addition, whole blood has successfully been used in the past to identify meaningful epigenetic differences in brain-related traits, as shown above [Citation18].
Here, we sought to assess DNAm associations with Magnetic Resonance Imaging (MRI) global brain structural phenotypes, including cerebral white matter, total grey matter, and whole-brain volume using the Illumina Infinium MethylationEPIC array, capturing DNAm at approximately 850 K CpG sites [Citation29]. Using DNAm measured ~6 years prior to MRI data collection, we examined whether CpG sites were associated with global brain structure at a later timepoint in N = 672 individuals. We then investigated whether concurrently measured DNAm was associated with global brain structure in N = 565 individuals.
Methods
Study population: Generation Scotland: Scottish Family Health Study (GS:SFHS)
GS:SFHS is a large, family-based epidemiological study aiming to investigate the genetics of health and disease in approximately 24,000 individuals aged 18–98 years across Scotland. Data collected between 2006 and 2011 consists of genetic, DNA methylation, and environmental variables [Citation30,Citation31]. GS:SFHS received ethical approval from NHS Tayside Research Ethics Committee (REC reference number 05/S1401/89) and has Research Tissue Bank Status (reference: 20/ES/0021). Written informed consent was obtained from all participants.
A total of N = 9,618 participants from GS responded when re-contacted at a later timepoint, and further data on mental health, specifically depression, was obtained. N = 1,188 were recruited for brain scanning, and approximately N = 700 with both DNAm and neuroimaging data were available at the time of the current study. Details of recruitment and study information have been reported previously [Citation32,Citation33]. The study was supported by the Wellcome Trust through a Strategic Award (reference 104036/Z/14/Z). Written consent at each stage of the study was obtained from all participants.
Two timepoints were used for the current study: blood samples were collected at baseline measurement (2006–2011), and concurrently with neuroimaging data (2015–2019).
Phenotypes
Global brain volumes
T1 images were processed using standard ENIGMA protocols [Citation34] with FreeSurfer 5.3 and all output was visually quality checked. Manual edits were applied as required to correct for inclusion of skull tissue, exclusion of brain tissue or for errors in parcellation. Global measures were extracted from the final output following all edits. Manual editing, although necessary, did introduce a degree of subjective bias, therefore ‘editing’ was included as a binary covariate (values: yes/no). Further, as the complete set of T1s was processed, quality checked and edited in two parts, ‘batch’ was also included as a covariate.
We used 3 global volume measures in the current study. Total cerebral white matter includes hyperintensities and excludes anything that is not white matter. Total grey matter is rendered by the sum of the cortex within the left and right hemispheres, as well as subcortical and cerebellar grey matter. Finally, whole-brain volume includes both grey and white matter, and corresponds to brain volume without the brain stem, ventricles, cerebrospinal fluid, and choroid plexus.
Baseline lifestyle factors and MDD status
Body mass index (BMI) was calculated using height (m) and weight (kg) as measured by clinical staff at baseline recruitment. Participants were asked to report the number of units of alcohol consumed during the past week and their smoking status (never, former, current); pack years was used to measure heaviness of smoking in current smokers by multiplying the number of cigarette packs (20 cigarettes/pack) smoked per day by the number of years a person has smoked [Citation35]. MDD status was assessed at baseline using the Structured Clinical Interview of the Diagnostic and Statistical Manual, version IV (SCID) [Citation36]. Participants with no MDD were defined as those individuals who did not fulfil criteria for a current or previous MDD diagnosis following the SCID interview.
Concurrent lifestyle factors and MDD status
At the follow-up assessment, participants were sent study packages that included questionnaires. Here, BMI was calculated using height (m) and weight (kg). Participants also recorded the number of units consumed during the past week, whether they were current, former, or non-smokers, and (if they smoked) the number of cigarettes smoked in an average week. Finally, MDD status was ascertained through the Composite International Diagnostic Interview-Short Form (CIDI-SF) [Citation37], and participants with no MDD were those individuals who did not fulfil criteria for current or previous MDD diagnoses based on responses.
DNA methylation
Baseline DNAm data was pre-processed and quality-checked for all individuals by Amador et al. in 2019 [Citation38]. At the concurrent timepoint, samples were placed on the array at two different time points and were therefore processed separately. The main difference between processing and analysis pipelines related to how key covariates were adjusted for. At baseline these were regressed out during pre-processing, whereas for the concurrent batches they were included as covariates in downstream analyses. However, across all batches, standard quality check (QC) and pre-processing steps with regards to sample and probe exclusions were identical (see below). We note however that differences in the processing resulted in different numbers of final CpG sites included for analysis.
Cross-reactive (N = 42,558) and polymorphic (N = 10,971) CpGs, obtained from McCartney et al. (2016) were removed from both the baseline and concurrent DNAm datasets [Citation39] .
Baseline DNA methylation
Genome-wide DNAm data profiled from whole blood samples was available for 9,873 individuals in GS:SFHS using the Illumina Human-MethylationEPIC BeadChip [Citation29]. Samples were obtained and DNA was extracted between 2006–2011. DNAm profiling using the Illumina Human-MethylationEPIC BeadChip [Citation29] was performed in two sets (in 2016, set AN = 5101; in 2019, set BN = 4,450) and pre-processing and QC was conducted once the second set was released, as detailed in Amador et al. [Citation38,Citation40,Citation41]. Participants were removed due to a number of reasons, including sex mismatch (Nremoved =24), having more than 1% CpG sites with a detection p-value>0.05 (Nremoved=52), being an outlier for bisulphite conversion control probes (Nremoved=1), having a median methylated signal intensity more than 3 standard deviations lower than expected (Nremoved=74), and other technical and dataset-specific issues (Nremoved=602, see Supplementary Materials). A total of 10,495 CpG sites were removed due to low beadcount, poor detection p-value, and sub-optimal binding.
R package ‘minfi’ was used to read in the IDAT files, compute M and beta values, and remove probes with large detection p-values, and to compute principal components (PC) of control probes. Correction was then applied for [Citation1] technical variation, where M values were included as outcome variables in a mixed linear model adjusting for appointment date and Sentrix ID (random effects), jointly with Sentrix position, batch, clinic, year, weekday, and 10 PCs (fixed effects); and [Citation2] biological variation by fitting residuals of [Citation1] as outcome variables in a second mixed linear model adjusting for genetic and common family shared environmental contributions (random effects classed as G: common genetic; K: kinship; F: nuclear family; C: couple; and S: sibling) and sex, age, and estimated cell type proportions (CD8T, CD4T, NK, Bcell, Mono, Gran) (fixed effects) [Citation42]. The final number of CpG sites that converged for these analyses was 674,246 across the 22 autosomes.
Concurrent DNA methylation
Genome-wide DNAm data profiled from whole blood samples was available for a total of 710 individuals using the Illumina Human-MethylationEPIC BeadChip [Citation29]. Pre-processing was carried out in two separate sets (Nset 1=404; Nset 2=306) intended as discovery and replication datasets, by Walker et al. [Citation43,Citation44]. Meffil [Citation45] was use to remove samples if: there was a mismatch between self-reported and methylation-predicted sex and if >0.5% of probes failed the detection p- value threshold (>0.01); probes were removed if >1% samples failed the detection p- value >0.01 and if >5% of samples failed the beadcount threshold (N = 3). In addition, samples were removed if they showed evidence of dye bias and they were outliers for the bisulphite conversion control probes. ShinyMethyl [Citation46] was then used to plot the log median intensity of methylated and unmethylated signals per array and inspect the output from the control probes; outlying samples detected by visual inspection were excluded. Meffil [Citation45] was then used again to remove any additional samples who had a sex mismatch. PC plots were made using the first two methylation principal components and any additional outlying samples on the basis of these plots were removed. Finally, data were normalized using the dasen method in wateRmelon, and M-values were generated using the beta2m function in lumi [Citation47]. The final number of CpG sites after pre-processing was N = 768,068 (set 1) and N = 765,695 (set 2) across the 22 autosomes.
Statistical methods
Epigenome-wide association
We used the ‘limma’ package [Citation48] in R to run linear regression models for both baseline and concurrent DNAm data, where each CpG was included as an outcome variable. Brain cortical volumes, specifically cerebral white matter, total grey matter, and whole brain volume were included as predictor variables in separate EWAS at each DNAm timepoint. The R code for these analyses is available in the Supplementary Materials.
Covariates for each model using baseline DNAm were MRI site (to account for different data collection sites; see Supplementary Materials), age, age2, sex, intracranial volume, and set (to account for different DNAm data pre-processing sets). Due to the impact of lifestyle factors on DNAm [Citation49–52], BMI, alcohol units, smoking status, and pack years were also included as covariates. Lastly, due to the increased prevalence of MDD in the dataset, MDD status was included as a covariate in all models. Technical (batch, appointment date) and biological (relatedness, cell type estimations, methylation principal components) variables were regressed out during pre-processing and were not included as covariates in downstream analyses. After QC, there were 674,246 CpGs and epigenome-wide significance was determined by a Bonferroni correction (0.05/674,246, p ≤ 7.41 × 10⁻⁸).
For both sets at the concurrent DNAm timepoint, covariates for each model were DNAm batch, 5 cell type proportion estimations (granulocytes, natural killer cells, B- lymphocytes, CD4 + T-lymphocytes and CD8 + T-lymphocytes), MRI site, age, age2, sex, intercranial volume, BMI, smoking status, number of cigarettes smoked/week, alcohol units, MDD status, and 20 methylation PCs. Bonferroni correction was applied based on the number of CpGs remaining in each set after QC (set 1: 0.05/768,068 CpGs, p ≤ 6.51x10⁻⁸; set 2: 0.05/765,695 CpGs, p ≤ 6.52x10⁻⁸).
The Blood Brain DNA Methylation Comparison Tool [Citation53] (http://epigenetics.essex.ac.Uk/bloodbrain/) investigates the correlation between DNAm from whole blood and four brain regions (prefrontal cortex, entorhinal cortex, superior temporal gyrus, and cerebellum) for all probes on the Illumina 450 K array [Citation54]. We used this resource to investigate the strength of correlation between the two tissues for CpGs identified here.
Meta-analysis using METAL – concurrent timepoint
At the concurrent timepoint, in set 1, N = 331 individuals were available with global volume and methylation data after QC and N = 234 were available in set 2. Meta-analysis of these two datasets was performed in METAL [Citation55] using p-value based analysis (N = 565). The meta-analysis was based on N = 769,263 CpGs across both sets and a Bonferroni correction (0.05/769,263) was used to define epigenome-wide significance (p ≤ 6.49x10⁻⁸).
Pathway analysis
We annotated CpG sites to genes through the Infinium MethylationEPIC BeadChip database [Citation29]. The database provides information about genes, chromosome location, start and end sites, and other features.
We used missMethyl [Citation56], accessed via methylGSA [Citation57], to assess pathway enrichment for differentially-methylated CpG sites. The package allows correction for biases in the representation of genes on the Infinium BeadChip. Gene Ontology (GO) terms were accessed using the msigdbr package [Citation58]. Pathways included in the analysis were all GO pathways of size 1–250 genes inclusive. CpG sites included in the analysis were those significant at a threshold of p < 1x10⁻⁵, as used in previous studies [Citation59]. Information on GO pathways can be accessed via www.geneontology.org using Gene Ontology identifiers, comprised of ‘GO’ followed by a string of numbers (e.g., GO:0000000).
Power analysis – concurrent timepoint
Since the concurrent data was formed by two smaller samples of pre-processed data, we additionally conducted power analysis to determine whether our concurrent samples had sufficient power to detect a significant effect. This was conducted using effect sizes from the baseline data to inform the power calculations. We used the ‘pwr.f2.test’ function in package ‘pwr’ in R and the set parameters were as follows:
1. Regression coefficients: DNAm batch, 5 cell type estimations (granulocytes, natural killer cells, B-lymphocytes, CD4 + T-lymphocytes and CD8 + T-lymphocytes), MRI site, age, age2, sex, intercranial volume, BMI, smoking status, number of cigarettes smoked/week, alcohol units, MDD status, 20 methylation principal components.
2. Effect size: we input the largest effect size identified in EWAS at baseline (N = 672) for each global volume.
3. Significance level: to adjust for multiple testing correction (FDR), the p-value for a single potential test was set based on the number of CpG sites in each dataset (set 1: 0.05/768,068 = 6.51x10⁻⁸; set 2: 0.05/765,695 = 6.53x10⁻⁸).
4. Power: to observe different power percentages, we input 60%, 80%, 90%, 95% and 99% power.
Results
Demographic characteristics
There were N = 672 individuals in the baseline EWAS, N = 331 in the set 1 concurrent EWAS, and N = 234 in the set 2 concurrent EWAS. Demographic characteristics for all individuals are presented in . Further descriptive characteristics regarding global volumes are presented in Supplementary .
Table 1. Demographic characteristics for individuals with global volume data, including lifestyle variables and MDD. “-“ indicates that there was no data of the sort for the respective dataset. Former smokers at the baseline measurement were split into those who quit less than a year ago and those who quit more than a year ago; at the concurrent timepoint, this division is not made.
Baseline EWAS
Baseline EWAS identified 1, 3, and 2 CpG sites that were associated with cerebral white matter, total grey matter, and whole-brain volume, respectively (p ≤ 7.41x10⁻⁸). Both CpGs associated with whole brain volume were also associated with total grey matter and were significantly hypermethylated. One CpG site associated with cerebral white matter and one associated with total grey matter were hypomethylated. As shown in , CpG associations with grey matter were stronger than with white matter. Information about each CpG site is shown in .
Figure 1. Manhattan plots showing the results from EWASs of cerebral white matter (1A), total grey matter (1B), and whole-brain volume (1 C), using baseline DNAm data (N = 672). The black line defines the threshold for epigenome-wide significance (p ≤ 7.41x10⁻⁸) and the dotted line defines CpG sites at p ≤ 1x10⁻⁵. Epigenome-wide significant hits for each phenotype are labelled on the graph.
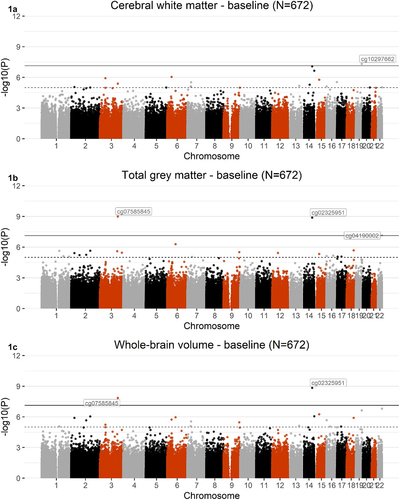
Table 2. CpG sites significantly associated with cerebral white matter, total grey matter, and whole-brain volume (N = 672), along with gene annotations (Gene), chromosome (c), standardized effect size (β), nominal (P-value) and multiple comparison-corrected p-values (P-corr). Traits previously associated with each CpG site were extracted from EWAS catalogues (http://www.ewascatalog.org/, association between traits and CpGs on Illumina 450 K array at p ≤ 1.0x10⁻⁴; and http://www.bioapp.org/ewasdb/ [Citation60],), association between traits and CpGs on Illumina 450 K and EPIC arrays at p ≤ 1.0x10⁻³). Gene information was extracted from the GWAS catalogue (https://www.ebi.ac.uk/gwas/; associations between traits and SNPs at p < 1.0x10− 5). All associations included in the table from these two catalogues are genome-wide significant.
Correlation between whole blood DNAm and four brain regions
We used the Blood Brain DNA Methylation Comparison Tool [Citation53] to investigate the correlation between blood and brain methylation measurements for two of the CpGs identified here, located on the 450 K array, and four brain regions. cg04190002 was strongly correlated with prefrontal cortex (r = 0.579, p = 6.55x10⁻⁸), entorhinal cortex (r = 0.564, p = 2.94x10⁻⁷), superior temporal gyrus (r = 0.598, p = 1.5x10⁻⁸), and cerebellum (r = 0.663, p = 3.02x10⁻¹⁰), while cg02325951 was strongly correlated with prefrontal cortex (r = 0.858, p = 1.73x10⁻²²), entorhinal cortex (r = 0.868, p = 1.19x10⁻²²), and superior temporal gyrus (r = 0.871, p = 3.32x10⁻²⁴).
Baseline pathway analysis
Enrichment of differentially methylated regions in biological pathways was analysed using missMethyl [Citation56], where an over-representation analysis of GO pathways was performed for sets of genes annotated to CpG sites differentially expressed at p<1x10⁻⁵ (N cerebral white matter: 19, N total grey matter: 22, N whole-brainvolume: 21).
There were no over-represented pathways after multiple correction. A number of brain-related biological processes, molecular functions, and cellular components were included in the top 10 significant pathways (Supplementary ). For instance, guanylate kinase-associated protein clustering, which facilitates assembly of post-synaptic density of neurons (GO:0097117), was found to be over-represented for all three imaging phenotypes (cerebral white matter nominal p-value = 0.0007; total grey matter nominal p-value = 0.001; whole-brain volume nominal p-value = 0.0009). Positive regulation of synapse structural plasticity (GO:0051835) was over-represented in both cerebral white matter (nominal p-value = 0.002) and total grey matter (nominal p-value = 0.002). Finally, forebrain generation of neurons (GO:0021872; nominal p-value = 0.001) was over-represented for cerebral white matter.
Concurrent EWAS
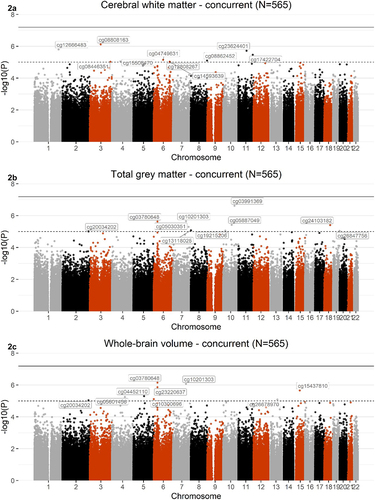
Meta-analysis of EWAS across the two concurrent sets did not reveal any Bonferroni-corrected CpG sites associated with any of the global volumes (). A list of the top 10 CpGs associated with cerebral white matter (EWASset 1 βrange=4.71x10⁻⁶- 6.53x10⁻⁶; EWASset 2βrange=1.02x10⁻⁵−8.75x10⁻⁶) total grey matter (EWASset 1 βrange=6.71x10⁻⁶−8.03x10⁻⁶; EWASset 2βrange=1.03x10⁻⁵−8.84x10⁻⁶), and whole-brain volume (EWASset 1βrange=2.69x10⁻⁶−4.05x10⁻⁶; EWASset 2 βrange= 6.23x10⁻⁶ −6.69x10⁻⁶), is presented in Supplementary Tables 3–5. Genes annotated to these top 10 CpGs have previously been implicated in brain-related phenotypes, including psychiatric disorders (MDD [Citation65–68], schizophrenia [Citation69]), neurodegenerative disorders (neurofibrillary tangles and PHF-tau measurement in Alzheimer’s Disease [Citation70]), and cognitive traits (mathematical ability, self- reported educational attainment [Citation71]). Results reported here are nominal and should be supported by further large-scale cohorts.
Figure 2. Manhattan plots showing meta-analysis of EWAS of cerebral white matter (2A), total grey matter (2B), and whole-brain volume (2 C), across the 2 concurrent sets (Nset 1=331; Nset 2=234; Ntotal=565). The black line defines the threshold for epigenome-wide significance (p ≤ 6.5x10⁻⁸) and the dotted line defines p ≤ 1x10⁻⁵. CpGs that met a significance of p ≤ 1x10⁻⁵ are labelled on the graph.
Concurrent pathway analysis
As above, enrichment of differentially methylated regions in specific pathways was assessed using missMethyl [Citation50] for sets of genes annotated to CpG sites differentially expressed at p<1x10⁻⁵ (Ncerebral white matter: 10, Ntotal grey matter: 10, Nwhole-brainvolume: 9). There were no over-represented pathways following FDR adjustment for multiple comparisons. The top 10 most significant pathways for each phenotype indicated a pattern of phenotype-specific biological processes, molecular functions, and cellular components (Supplementary Table 6). For instance, over-represented pathways in cerebral white matter included myelination (GO:0042552; nominal p-value = 0.002), ensheathment of neurons (GO:0007272; nominal p-value = 0.002), axon ensheathment (GO:0008366; nominal p-value = 0.001), glial cell development (GO:0021782; nominal p-value = 0.001) and glial cell differentiation (GO:0010001; nominal p-value = 0.004). Total grey matter over-represented pathways included glutamate catabolic process to aspartate (GO:0019550; nominal p-value = 0.0009) and to 2-oxoglutarate (GO:0019551; nominal p-value = 0.0009). Finally, over-represented pathways in whole-brain volume included several MHC-related biological processes, including regulation (GO:0002586; nominal p-value = 0.001) and negative regulation (GO:0002587; nominal p-value = 0.0009) of antigen processing and presentation of peptide antigen via MHC class II, negative regulation of antigen processing and presentation of peptide or polysaccharide antigen via MHC class II (GO:0002581; nominal p-value = 0.001), as well as N- acetyllactosaminide beta-1,3-N-acetylglucosaminyltransferase (GO:0008532, molecular function, nominal p-value = 0.001), an enzyme encoded by the gene B3GNT2, which is highly expressed in whole-brain, hippocampus, amygdala, cerebellum, and caudate nucleus (https://www.uniprot.org/uniprot/Q9Z222).
Power curves for concurrent data
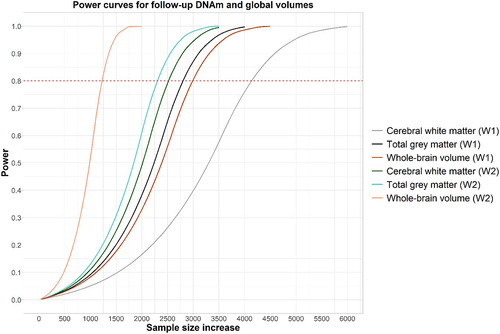
Power curves for the three imaging phenotypes are presented in . Further details, including effect size for each phenotype, are included in Supplementary Tables 7 and 8. These indicate that approximately 1,000–6,000 individuals (depending on phenotype) would be needed to detect an effect after multiple correction.
Figure 3. Power curves for cerebral white matter, total grey matter, and whole-brain volume calculated separately for set 1 and set 2. The x-axis indicates how many participants would be needed to detect an effect with 60%, 80%, 90%, 95% or 99% power at p < 6.51x10⁻⁸ (set 1 (W1)) and p < 6.53x10⁻⁸ (set 2 (W2)) with 36 regression coefficients included in the linear model. Effect sizes were calculated based on the largest effect size obtained in EWAS for each phenotype at baseline.
Discussion
We report a number of significant associations between DNAm measured ~6 years prior to MRI data collection and cerebral white matter (Nsignificant CpGs=1), total grey matter (Nsignificant CpGs=3), and whole-brain volume (Nsignificant CpGs=2) (N=672), annotated to genes involved in brain-related traits. There were no significant associations between DNAm collected concurrently with MRI data (N = 565). In addition, pathway analysis did not uncover any significant findings for either the baseline or concurrent analyses. Power analysis of the concurrent data using baseline data for effect size confirmed that approximately 1,000–6,000 individuals (depending on phenotype) would be needed to detect a statistically significant effect.
For the analysis of associations between DNAm measured at baseline and cortical volumes ~6 years later, one CpG associated with cerebral white matter, cg10297662, was annotated to PNKP. This CpG site has not previously been associated with any other traits, to the best of our knowledge. PNKP is involved in DNA repair following ionizing radiation or oxidative damage [Citation72] and is expressed in a number of tissues, including the brain. Mutations in this gene have been associated with a number of neural conditions, including microcephaly, developmental delay, seizures, and cerebellar ataxia [Citation73,Citation74]. These mutations have been shown to lead to white matter defects, which is the phenotype investigated here [Citation75]. Previous evidence also indicates that loss of PNKP strongly impacts oligodendrocytes, leading to white matter abnormalities [Citation76]. Efforts should be made to identify whether the relationship between PNKP mutations and defects in white matter is mediated by differential DNAm at specific sites.
Two CpGs, cg07585845 and cg02325951, were associated with both total grey matter and whole-brain volume. cg07585845 has not been previously associated with any traits nor annotated to any genes. cg02325951 was previously associated with sex in a study investigating methylation trajectories across human foetal brain development (p = 2x10−54 [Citation77];). The gene to which cg02325951 is annotated, FOXN3, is involved in several physiological processes, such as development, ageing, obesity, and cancer and is expressed in multiple tissues, including the forebrain and midbrain. Further, animal studies show that mutations within the gene have been associated with craniofacial defects [Citation78]. In addition, FOXN3 has previously been associated with several brain-related phenotypes in previous GWAS, including intelligence (p = 1x10⁻¹¹ [Citation79];), self-reported educational attainment (p = 8x10⁻¹¹), cognitive function measurement (p = 2x10⁻⁹), and mathematical ability (p = 3x10⁻⁹) [Citation80]. These cognition-related phenotypes have previously been associated with whole brain volume, where higher cognition was associated with a larger brain size [Citation72]. Future studies should investigate whether DNAm localized to FOXN3 plays a role in cognition development through modifications in whole-brain volume.
Finally, in addition to the two CpGs above, total grey matter was also associated with cg04190002, a CpG previously associated with sex in newborns (p = 5.4x10⁻¹⁹ [Citation81];). The CpG is annotated to SHANK3, which encodes multidomain scaffold proteins of the postsynaptic density connecting neurotransmitter receptors, among other membrane proteins and is expressed in the cerebral cortex and the cerebellum. The gene has previously been associated with a host of brain disorders and traits, including self- reported educational attainment (p = 2x10⁻²⁰), mathematical ability (p = 1x10⁻¹⁷), cognitive function measurement (p = 3x10⁻¹²) [Citation80] and schizophrenia (p = 3x10⁻⁹ [Citation82];), and mutations have previously been associated with autism spectrum disorder [Citation83]. These disorders in turn have been associated with changes in grey matter [Citation84], and future studies should investigate whether these psychiatric disorders are also associated with differential DNAm at cg04190002, and other probes localized to SHANK3, as well as explore whether associations are mediated by global brain phenotypes.
Blood and brain methylation measures for both cg02325951 and cg04190002 (both CpGs on the 450 K array) were strongly correlated, indicating that whole blood is a suitable proxy tissue for investigating associations with brain phenotypes, at least for these probes. Future studies exploring DNAm in relation to global brain phenotypes and associated traits may therefore benefit from whole blood DNAm measurements.
DNAm profiled at a different timepoint to phenotype measurement has previously yielded interesting results. Barbu et al. (2020) found that a methylation risk score calculated from DNAm profiled 4–11 years prior to MDD diagnosis was significantly associated with incident cases who were well at DNAm measurement but went on to develop MDD [Citation12]. Clark et al. (2020) similarly associated DNAm profiled in MDD patients at baseline with MDD status 6 years later [Citation85]. These previous findings indicate that DNAm measured prior to phenotype measurement may provide meaningful insight into phenotype development and change across time. The findings above relating DNAm measured previously to MRI scans may therefore aid in the investigation of epigenetic differences in brain-related disease and health at a later timepoint, although further longitudinal replication is needed to verify these associations.
Associations between DNAm measured concurrently to MRI scans did not yield any significant findings. Power calculations using the baseline data to derive effect size showed that approximately 1,000–6,000 participants (depending on phenotype) would be needed to uncover a significant effect at epigenome-wide level. This number is supported by previous studies, such as Jia et al. (2019), who analysed 3,337 individuals across 11 cohorts as part of ENIGMA to find 2 CpGs significantly associated with hippocampal volume [Citation19]. This may indicate that null findings were due to lack of power at the concurrent timepoint. Null findings here should serve as a stimulus for larger collaborations and meta-analyses in future.
Further, effect sizes for both timepoints were much smaller than those identified in previous studies that analysed larger sample sizes in specific brain regions [Citation19] (largest baseline effect size: 1.46x10⁻⁶; largest concurrent effect size: 1.06 × 10⁻⁶), which suggests that findings here should be interpreted with caution. The results here indicate that global associations with DNAm may be weaker than those at a regional level. Future studies may therefore benefit from focussing on lobe- and region-specific correlates of DNAm.
At the concurrent timepoint, DNAm data was pre-processed and quality-checked in 2 sets, resulting in a different number of final CpGs (NCpG set 1=768,068; NCpG set 2=765,695). Pearson’s correlations between the EWAS betas from set 1 and set 2 across all CpGs were r = 0.02 (95% C.I. = 0–0.102), r = 0.04 (95% C.I. = 0–122), and r = 0.03 (95% C.I. = 0–0.112) for cerebral white matter, total grey matter, and whole brain volume, respectively. When restricting CpGs to those with a nominal p-value (≤0.05), the beta correlations were slightly higher, although not strong: r = 0.17 (95% C.I. = 0.089–0.249), r = 0.18 (95% C.I. = 0.099–0.259), and r = 0.22 (95% C.I. = 0.14–0.297) for cerebral white matter, total grey matter, and whole-brain volume, respectively. The low effect size correlations may be a further reflection of the small sample investigated here.
There are limitations to the current study. Firstly, we report DNAm changes in whole blood, which may not be representative of brain phenotypes. However, two of the CpGs identified here, located on the 450 K array, were strongly correlated with DNAm in four brain regions [Citation53]. Although previous studies have shown that there is considerable agreement between blood and brain [Citation28], future studies should explore DNAm changes in the brain in post-mortem samples where possible to uncover biological mechanisms underpinning brain structure within the same tissue. Further, findings at baseline may indicate that some DNAm changes lie upstream of brain structural changes, although effect sizes for each CpG were small compared to previous concurrent EWAS of brain regions [Citation18,Citation19]. In addition, we cannot test the direction of association between brain structural changes and DNAm. In future, studies may apply Mendelian Randomization to investigate whether DNAm may be on the causal path to brain structure alterations in brain health and disease. Finally, in the current study we focussed on global brain phenotypes to explore whether global brain-related changes, previously associated with psychiatric and neurological disorders, are associated with DNAm alterations. Previous evidence includes DNAm associations at both global and regional level [Citation18], and it may be that DNAm may provide more insight into region-specific alterations in relation to brain health and disease.
In conclusion, we report an EWAS of global cortical brain volumes using DNAm data collected ~6 years prior to MRI data collection in 672 individuals and an EWAS meta-analysis of cortical brain volumes using DNAm measured concurrently to MRI data in 565 individuals, both part of a large, population-based cohort. Using baseline DNAm data, we find four CpGs significantly associated with cortical brain volumes ~6 years later, all of which are annotated to genes implicated in brain-related phenotypes. We did not find significant associations at the concurrent timepoint. Findings here should be interpreted with caution, and future studies should aim to determine further links between DNAm changes and brain structure and function, to highlight our understanding of this relationship in health and disease
Supplemental Material
Download MS Word (186.6 KB)Acknowledgments
Generation Scotland received core support from the Chief Scientist Office of the Scottish Government Health Directorates [CZD/16/6] and the Scottish Funding Council [HR03006] and is currently supported by the Wellcome Trust [216767/Z/19/Z]. Generation Scotland is currently supported by the Wellcome Trust [216767/Z/19/Z] and by the Wellcome Trust Investigator Award in Science 01/06/2021 to 31/05/26 ‘Exploiting genomic approaches to identify the environmental basis of depression’. (Reference: 220857/Z/20/Z) to McIntosh AM (PI). Genotyping of the GS:SFHS samples was carried out by the Genetics Core Laboratory at the Edinburgh Clinical Research Facility, University of Edinburgh, Scotland and was funded by the Medical Research Council UK and the Wellcome Trust (Wellcome Trust Strategic Award “STratifying Resilience and Depression Longitudinally” (STRADL) Reference 104036/Z/14/Z). The DNA methylation profiling and data preparation was supported by Wellcome Investigator Award 220857/Z/20/Z and Grant 104036/Z/14/Z (PI for both grants: McIntosh AM) and through funding from NARSAD (Ref: 27404; PI: Dr DM Howard and Ref: 21956; PI Dr Kathryn Evans) and the Royal College of Physicians of Edinburgh (Sim Fellowship; PI: Dr HC Whalley). MCB is supported by a Guarantors of Brain Non-clinical Post-Doctoral Fellowship. AMM is supported by the Wellcome Trust (104036/Z/14/Z, 216767/Z/19/Z, 220857/Z/20/Z) and UKRI MRC (MC_PC_17209, MR/S035818/1). KLE is supported by the NARSAD Independent Investigator Award (Grant ID: 21956). JMW is supported by UK Dementia Research Institute which is funded by the MRC, Alzheimer’s Research UK and Alzheimer’s Society, by the Fondation Leducq (16 CVD 05), and the Row Fogo Centre for Research Into Ageing and the Brain (BRO- D.FID3668413). This work is part of a project that has received funding from the European Union’s Horizon 2020 research and innovation programme under grant agreement No 847776.
Disclosure statement
No potential conflict of interest was reported by the author(s).
Supplementary material
Supplemental data for this article can be accessed here
Additional information
Funding
References
- DeYoung CG, Hirsh JB, Shane MS, et al. Testing predictions from personality neuroscience. Brain structure and the big five. Psychological Science. 2010;21(6):820–828.
- Zatorre RJ, Fields RD, Johansen-Berg H. Plasticity in gray and white: neuroimaging changes in brain structure during learning. Nat Neurosci Europe PMC Funders. 2012;15:528–536.
- Shen X, Reus LM, Cox SR, et al. Subcortical volume and white matter integrity abnormalities in major depressive disorder: findings from UK Biobank imaging data. Sci Rep. 2017;7(1).
- Höistad M, Segal D, Takahashi N, et al. Linking white and grey matter in schizophrenia: oligodendrocyte and neuron pathology in the prefrontal cortex. Front Neuroanatomy Frontiers Media SA; 2009.
- Favre P, Pauling M, Stout J, et al. Widespread white matter microstructural abnormalities in bipolar disorder: evidence from mega- and meta-analyses across 3033 individuals. Neuropsychopharmacology. 2019;44(13):2285–2293.
- Mahmood A, Bibat G, Zhan AL, et al. White matter impairment in rett syndrome: diffusion tensor imaging study with clinical correlations. Am J Neuroradiol. 2010;31(2):295–299.
- Serra L, Cercignani M, Lenzi D, et al. Grey and white matter changes at different stages of Alzheimer’s disease. J Alzheimer’s Dis. 2010;19(1):147–159.
- Salat DH, Buckner RL, Snyder AZ , et al. Thinning of the cerebral cortex in aging. Cereb Cortex. 2004;14(7):721–730.
- Cox SR, Ritchie SJ, Tucker-Drob EM, et al. Ageing and brain white matter structure in 3,513 UK Biobank participants. Nat Commun. 2016;7.
- Bird A. Perceptions of epigenetics. Nature Nature Publishing Group. 2007;447:396–398.
- C Greenberg MV, Bourchis D. The diverse roles of DNA methylation in mammalian development and disease.Nat Rev Mol Cell Biol.
- Barbu MC, Shen X, Walker RM, et al. Epigenetic prediction of major depressive disorder Mol Psychiatry. 2020;11:1–12.
- Jovanova OS, Nedeljkovic I, Spieler D, et al. DNA methylation signatures of depressive symptoms in middle-aged and elderly persons: meta-analysis of multiethnic epigenome-wide studies. JAMA Psychiatry. 2018;75(9):949–959.
- Hannon E, Dempster E, Viana J, et al. An integrated genetic-epigenetic analysis of schizophrenia: evidence for co-localization of genetic associations and differential DNA methylation. Genome Biology. 2016;17(1):176.
- Montano C, Taub MA, Jaffe A, et al. Association of DNA methylation differences with schizophrenia in an epigenome-wide association study. JAMA Psychiatry. 2016;73(5):506–514.
- Horvath S, Raj K. DNA methylation-based biomarkers and the epigenetic clock theory of ageing. Nat Rev Genet. 2018;19(6):371–384.
- Ladd-Acosta C, Pevsner J, Sabunciyan S, et al. DNA methylation signatures within the human brain. The American Journal of Human Genetics. 2007;81(6):1304–1315.
- Wheater ENW, Stoye DQ, Cox SR, et al. DNA methylation and brain structure and function across the life course: a systematic review. Neuroscience and Biobehavioral Reviews Elsevier Ltd. 2020;113:133–156.
- Jia T, Chu C, and Liu Y, et al. Epigenome-wide meta-analysis of blood DNA methylation and its association with subcortical volumes: findings from the ENIGMA epigenetics working group. Mol Psychiatry. 2019;26:3884–3895 .
- Wockner LF, Noble EP, Lawford BR, et al. Genome-wide DNA methylation analysis of human brain tissue from schizophrenia patients. Translational Psychiatry. 2014;4(1):339.
- Liu J, Siyahhan Julnes P, Chen J, et al. The association of DNA methylation and brain volume in healthy individuals and schizophrenia patients. Schizophrenia Research. 2015;169(1–3):447–452.
- Davis EG, Humphreys KL, McEwen LM, et al. Accelerated DNA methylation age in adolescent girls: associations with elevated diurnal cortisol and reduced hippocampal volume. Transl Psychiatry [Internet]. 2017;7(8):e1223.
- De Jager PL, Srivastava G, Lunnon K, et al. Alzheimer’s disease: early alterations in brain DNA methylation at ANK1, BIN1, RHBDF2 and other loci. Nat Neurosci. 2014;17(9):1156–1163.
- Masliah E, Dumaop W, Galasko D, et al. Distinctive patterns of DNA methylation associated with Parkinson disease: identification of concordant epigenetic changes in brain and peripheral blood leukocytes. Epigenetics. 2013;8(10):1030–1038.
- van Erp TGM, Walton E, Hibar DP, et al. Cortical brain abnormalities in 4474 individuals with Schizophrenia and 5098 control subjects via the enhancing neuro imaging genetics through meta analysis (ENIGMA) consortium. Biological Psychiatry. 2018;84(9):644–654.
- Schmaal L, Pozzi E CHT, and van Velzen LS, et al. ENIGMA MDD: seven years of global neuroimaging studies of major depression through worldwide data sharing. Translational Psychiatry Springer Nature. 2020;10:1–19 .
- Wright IC, Rabe-Hesketh S, Woodruff PWR, et al. Meta-analysis of regional brain volumes in schizophrenia. Am J Psychiatry. 2000;157(1):16–25.
- Walton E, Hass J, Liu J, et al. Correspondence of DNA methylation between blood and brain tissue and its application to schizophrenia research. Schizophrenia Bulletin. 2016;42(2):406–414.
- Hansen K. IlluminaHumanMethylationEPICanno.ilm10b2.hg19: annotation for Illumina’s EPIC methylation arrays R Packag Version 060. 2016. https://bitbucket.com/kasperdanielhansen/Illumina_EPIC
- Smith BH, Campbell H, Blackwood D, et al. Generation Scotland: the scottish family health study; a new resource for researching genes and heritability. BMC Medical Genetics. 2006;7(1):74.
- Smith BH, Campbell A, Linksted P, et al. Cohort profile : generation Scotland : scottish family health study (GS : SFHS). The study, its participants and their potential for genetic research on health and illness. Int J Epidemiol. 2013;42:689–700.
- Navrady LB, Wolters MK, MacIntyre DJ, et al. Cohort profile: stratifying resilience and depression longitudinally (STRADL): a questionnaire follow-up of generation Scotland: scottish family health study (GS: SFHS). Int J Epidemiol. 2018;47(1):13–14.
- Habota T, Sandu A-L, Waiter GD, et al. Cohort profile for the stratifying resilience and depression longitudinally (STRADL) study: a depression-focused investigation of generation Scotland, using detailed clinical, cognitive, and neuroimaging assessments. Wellcome Open Research. 2019;4:185.
- Zugman A, Harrewijn A, Cardinale EM, et al. Mega-analysis methods in ENIGMA: the experience of the generalized anxiety disorder working group. human brain mapping John Wiley and Sons Inc. 2020.
- Leffondré K. Modeling smoking history: a comparison of different approaches. American Journal of Epidemiology. 2002;156(9):813–823.
- First MB, Spitzer RL, Gibbon M, et al. The structured clinical interview for DSM-III-R personality disorders (SCID-II). Part II: multi-site test-retest reliablity study. Journal of Personality Disorders. 1995;9(2):92–104.
- Gigantesco A, Morosini P. Development, reliability and factor analysis of a self-administered questionnaire which originates from the world health organization’s composite international diagnostic interview - short form (CIDI-SF) for assessing mental disorders Clinical Practice and Epidemiology in Mental Health 2008.
- Amador C, Zeng Y, Barber M, et al. Genome-wide methylation data improves dissection of the effect of smoking on body mass index bioRxiv. 2021.
- McCartney DL, Walker RM, Morris SW, et al. Identification of polymorphic and off-target probe binding sites on the Illumina Infinium MethylationEPIC BEADCHIP. Genomics Data. 2016;9:22–24.
- Zeng Y, Amador C, Gao C, et al. Lifestyle and genetic factors modify parent-of-origin effects on the human methylome bioRxiv. 2021. https://www.biorxiv.org/content/10.1101/2021.06.28.450122v1
- Barbu M, Huider F, Campbell A, et al. Methylome-wide association study of antidepressant use in generation Scotland and the Netherlands Twin register implicates the innate immune system medRxiv 2020.
- Xia C, Amador C, Huffman J, et al. Pedigree- and SNP-associated genetics and recent environment are the major contributors to anthropometric and cardiometabolic trait variation. PLOS Genetics. 2016;12(2):e1005804
- Gadd DA, Hillary RF, McCartney DL, et al. Epigenetic scores for the circulating proteome replicate protein-disease predictions as tools for biomarker discovery. 2021;8: 12.01.404681.
- Gadd DA, Hillary RF, McCartney DL, et al. Epigenome and phenome study reveals circulating markers pertinent to brain health. 2021. https://www.medrxiv.org/content/10.1101/2021.09.03.21263066v1
- Min JL, Hemani G, Smith GD, et al. Meffil: efficient normalization and analysis of very large DNA methylation datasets. Bioinformatics. 2018;34(23):3983–3989.
- Fortin J-P, Fertig E, Hansen K. shinyMethyl: interactive quality control of Illumina 450k DNA methylation arrays in R. F1000Research. 2014;3: 175.
- Du P, Kibbe WA, Lin SM. lumi: a pipeline for processing Illumina microarray. Bioinformatics. 2008;24(13):1547–1548.
- Ritchie ME, Phipson B, Wu D, et al. Limma powers differential expression analyses for RNA-sequencing and microarray studies. Nucleic Acids Res. 2015;43(7):e47.
- McCartney DL, Hillary RF, Stevenson AJ, et al. Epigenetic prediction of complex traits and death. Genome Biol. 2018;19(1):136.
- Mendelson MM, Marioni RE, and Joehanes R, et al. Association of body mass index with DNA methylation and gene expression in blood cells and relations to cardiometabolic disease : a mendelian randomization approach. PLOS Med. 2017;14:1–30.
- Liu C, Marioni RE, Hedman AK, et al. A DNA methylation biomarker of alcohol consumption. Mol Psychiatry [Internet]. 2018;23(2):422–433.
- Joehanes R, Just AC, Marioni RE, et al. Epigenetic signatures of cigarette smoking. Circulation: Cardiovascular Genetics. 2016;9(5):436–447.
- Hannon E, Lunnon K, Schalkwyk L, et al. Interindividual methylomic variation across blood, cortex, and cerebellum: implications for epigenetic studies of neurological and neuropsychiatric phenotypes. Epigenetics. 2015;10(11):1024–1032.
- Hansen K. IlluminaHumanMethylation450kanno. ilmn12. hg19: annotation for Illumina’s 450k methylation arrays. 2016.
- Willer CJ, Li Y, Abecasis GR. METAL: fast and efficient meta-analysis of genomewide association scans. Bioinformatics. 2010;26(17):2190–2191.
- Phipson B, Maksimovic J, Oshlack A. MissMethyl: an R package for analyzing data from Illumina’s HumanMethylation450 platform. Bioinformatics. 2016;32(2):286–288.
- Ren X, Kuan PF. methylGSA: a bioconductor package and shiny app for DNA methylation data length bias adjustment in gene set testing. Bioinformatics. 2019;35(11):1958–1959.
- Dolgalev I. msigdbr: mSigDB gene sets for multiple organisms in a tidy data format. R Package Version 7. 2020. https://cran.r-project.org/web/packages/msigdbr/index.html.
- Chu AY, Tin A, Schlosser P, et al. Epigenome-wide association studies identify DNA methylation associated with kidney function. Nat Commun. 2017;8(1):1–12. www.nature.com/naturecommunications
- Liu D, Zhao L, Wang Z, et al. EWASdb: epigenome-wide association study database. Nucleic Acids Research. 2019;47:989–993.
- Lv H, Zhang M, Shang Z, et al. Genome-wide haplotype association study identify the FGFR2 gene as a risk gene for acute myeloid leukemia. Oncotarget. 2017;8(5):7891–7899.
- Kichaev G, Bhatia G, Loh PR, et al.,Leveraging polygenic functional enrichment to improve GWAS power. The American Journal of Human Genetics. 2019 Jan 3 [cited 2021 Sep 16];104(1):65–75.
- Liu M, Jiang Y, Wedow R, et al. Association studies of up to 1.2 million individuals yield new insights into the genetic etiology of tobacco and alcohol use. Nature Genetics Nature Publishing Group 2019;51:237–244.
- Karlsson Linnér R, Biroli P, Kong E, et al. Genome-wide association analyses of risk tolerance and risky behaviors in over 1 million individuals identify hundreds of loci and shared genetic influences. Nature Genetics. 2019;51(2):245–257.
- Howard DM, Adams MJ, and Clarke T-K, et al. Genome-wide meta-analysis of depression identifies 102 independent variants and highlights the importance of the prefrontal brain regions. Nature Neuroscience. 2019;22:343–352.
- Day FR, Ong KK, Perry JRB. Elucidating the genetic basis of social interaction and isolation. Nat Commun. 2018;9(1).
- Nagel M, Jansen PR, Stringer S, et al. Meta-analysis of genome-wide association studies for neuroticism in 449,484 individuals identifies novel genetic loci and pathways. Nat Genet. 2018;50(7):920–927.
- Baselmans BM, Jansen R,IHF, van de Weijer MP, et al., Multivariate genome-wide analyses of the well-being spectrum. Nature Genetics. 2019;51(3):445–451.
- Meta-analysis of GWAS of over 16,000 individuals with autism spectrum disorder highlights a novel locus at 10q24.32 and a significant overlap with schizophrenia. Molecular Autism. 2017;8:21.
- Wang H, Yang J, Schneider JA, et al. Genome-wide interaction analysis of pathological hallmarks in Alzheimer’s disease. Neurobiology of Aging. 2020;93:61–68.
- Lee JJ, Wedow R, Okbay A, et al. Gene discovery and polygenic prediction from a genome-wide association study of educational attainment in 1.1 million individuals. Nat Genet. 2018;50(8):1112–1121.
- Jilani A, Ramotar D, Slack C, et al. Molecular cloning of the human gene, PNKP, encoding a polynucleotide kinase 3'-phosphatase and evidence for its role in repair of DNA strand breaks caused by oxidative damage. J Biol Chem. 1999;274(34):24176–24186.
- Shen J, Gilmore EC, Marshall CA, et al. Mutations in PNKP cause microcephaly, seizures and defects in DNA repair. Nature Genetics. 2010;42(3):245–249
- Gatti M, Magri S, Nanetti L, et al. From congenital microcephaly to adult onset cerebellar ataxia: distinct and overlapping phenotypes in patients with PNKP gene mutations. American Journal of Medical Genetics Part A. 2019;179(11):2277–2283.
- Dumitrache LC, McKinnon PJ. Polynucleotide kinase-phosphatase (PNKP) mutations and neurologic disease. Mechanisms of Ageing and Development. 2017;161(Pt A):121–129.
- Shimada M, Dumitrache LC, Russell HR, et al. Polynucleotide kinase–phosphatase enables neurogenesis via multiple DNA repair pathways to maintain genome stability. EMBO J. 2015;34(19):2465–2480.
- Spiers H, Hannon E, Schalkwyk LC, et al. Methylomic trajectories across human fetal brain development. Genome Research. 2015;25(3):338–352.
- Samaan G, Yugo D, Rajagopalan S, et al. Foxn3 is essential for craniofacial development in mice and a putative candidate involved in human congenital craniofacial defects. Biochemical and Biophysical Research Communications. 2010;400:60–65.
- Hill WD, Marioni RE, Maghzian O, et al. A combined analysis of genetically correlated traits identifies 187 loci and a role for neurogenesis and myelination in intelligence. Mol Psychiatry. 2019;24(2):169–181.
- Lee JJ, Wedow R, Okbay A, et al., Gene discovery and polygenic prediction from a genome-wide association study of educational attainment in 1.1 million individuals. Nature Genetics. 2018;50(8):1112–1121.
- Yousefi P, Huen K, Davé V, et al. Sex differences in DNA methylation assessed by 450K BeadChip in newborns. BMC Genomics. 2015;16(1):911.
- Lam M, Hill WD, Trampush JW, et al. Pleiotropic meta-analysis of cognition, education, and schizophrenia differentiates roles of early neurodevelopmental and adult synaptic pathways. The American Journal of Human Genetics. 2019;105(2):334–350.
- Moessner R, Marshall CR, Sutcliffe JS, et al. Contribution of SHANK3 mutations to autism spectrum disorder. The American Journal of Human Genetics. 2007;81(6):1289–1297.
- Mancuso L, Fornito A, Costa T, et al. A meta-analytic approach to mapping co-occurrent grey matter volume increases and decreases in psychiatric disorders. Neuroimage 2020;15(222):117220.
- Clark SL, Hattab MW, Chan RF, et al. A methylation study of long-term depression risk. Mol Psychiatry. 2020;25(6):1334–1343.