
ABSTRACT
Aberrant DNA methylation is an epigenetic hallmark of malignant tumours. The DNA methylation level is regulated by not only DNA methyltransferases (DNMTs) but also Ten-Eleven Translocation (TET) family proteins. However, the exact role of TET genes in breast cancer remains controversial. Here, we uncover that the ERα-positive breast cancer patients with high TET2 mRNA expression had better overall survival rates. Consistently, knockout of TET2 promotes the tumorigenesis of ERα-positive MCF7 breast cancer cells. Mechanistically, TET2 loss leads to aberrant DNA methylation (gain of 5mC) at a large proportion of enhancers, accompanied by significant reduction in H3K4me1 and H3K27ac enrichment. By analysing the epigenetically reprogrammed enhancers, we identify oestrogen responsive element (ERE) as one of the enriched motifs of transcriptional factors. Importantly, TET2 loss impairs 17beta-oestradiol (E2)-induced transcription of the epigenetically reprogrammed EREs-associated genes through attenuating the binding of ERα. Taken together, these findings shed light on our understanding of the epigenetic mechanisms underlying the enhancer reprogramming during breast cancer pathogenesis.
KEYWORDS:
Introduction
Breast cancer is the most prevalent malignant tumour and one of the leading causes of cancer death for women [Citation1]. In addition to the well-recognized genetic factors, epigenetic dysregulations also contribute to the development and progression of breast cancer [Citation2]. In general, aberrant epigenetic modifications (e.g., DNA hyper- and hypo-methylation) and alterations to chromatin structure can affect the transcriptional programmes that contribute to the malignant phenotypes observed in breast cancer.
TET (Ten-Eleven Translocation) family proteins (TET1/2/3) play a key role in the dynamic process of DNA demethylation [Citation3]. The dysregulation of TET genes and aberrant 5mC oxidation have been described in both haematopoietic malignancies and solid tumours [Citation4,Citation5]. Yang et al. reported that TET1/2/3 mRNA and global 5hmC levels were decreased in several types of tumour tissues (including breast cancer) when compared to tumour-adjacent normal tissues [Citation5]. Shao and colleagues found that TET1/2/3 mRNA levels were positively associated with clinical outcome in breast cancer patients [Citation6]. Tsai et al. reported that low 5hmC level (an indicator of TET catalytic activity) is correlated with poor prognosis only in ERα-negative breast cancer but not ERα-positive breast cancer [Citation7]. Conversely, Belmonte and colleagues demonstrated that high TET1/3 expression predict poor prognosis of patients with breast cancer [Citation8].
Several labs have provided many evidences that TET genes play a tumour suppressive role in breast cancer pathogenesis. For instance, TET1 can inhibit growth, invasion and metastasis of breast cancer cells through demethylating the promoter regions of tumour suppressor genes, such as TIMP2/3 and HOXA9, ultimately leading to their expression and activation [Citation9,Citation10]. Chen et al. found that TET2 could inhibit the migration and invasion of breast cancer cells through the demethylation of EpCAM and E-cadherin, again preceding their expression and activation [Citation11]. Pandolfi and colleagues revealed that TET1/2/3 expression can be inhibited by miR22, resulting in the hypermethylation of miRNA200a/b/c promoters and transcriptional repression of these miRNAs, leading to a series of malignant phenotypes such as uncontrolled cell growth, epithelial–mesenchymal transition (EMT), and metastasis [Citation12]. Wu et al. confirmed that TET2 suppresses breast cancer stem cells (CSC) through the regulation of the miRNA200c/PKCζ axis [Citation13]. In contrast, a few studies indicated that TET1 and TET3 might exhibit oncogenic roles in breast cancer [Citation8,Citation14,Citation15]. Moreover, a recent work revealed that TET2 could function as a co-activator of oestrogen receptor α (ERα) in breast cancer cells [Citation16]. The authors uncovered that depletion of TET2 impairs the E2-stimulated cell growth of MCF7 cells. These paradoxical results suggest that the role of TET genes in breast cancer is still not fully understood.
Here, we provide evidences that TET2 functions as a tumour suppressor in ERα-positive breast cancer. Mechanistically, TET2 can safeguard a subgroup of enhancers (e.g., oestrogen response elements (ERE)) from aberrant DNA methylation and fine-tune the transcription of associated genes through maintaining the binding of transcriptional factors (e.g., ERα) to enhancers.
Materials and methods
Kaplan-meier analysis of survival rates
The Kaplan–Meier survival plots for ERα-positive and negative breast cancer patients were generated and downloaded from www.kmplot.com. Breast cancer patients were divided to ERα positive and negative groups using IHC. High-TETs group and low-TETs groups were quantified and identified by using the JetSet best probe set. Breast cancer patients were splitted by an auto-selected cut-off, which was achieved by computing all possible cut-off values between the lower and higher quartiles, and the best performing threshold is used as the final cut-off. PAM50 classifier was used to divide the breast cancer patients into Luminal A, Luminal B, HER2 positive, Basal like, and Normal like subtypes.
Cell culture
MCF-7 cells were cultured in Dulbecco’s Modified Eagle’s Medium (DMEM) (Hyclone) supplemented with 10% foetal bovine serum (FBS)(Gibco) and 100 U/ml penicillin/streptomycin (Invitrogen). For oestrogen stimulation, MCF-7 cells were cultured in phenol red-free RPMI 1640 medium (Hyclone) plus 10% charcoal-depleted FBS (Biological Industries) for 5 days and followed by EtOH or E2 (1 nM) (Sigma) treatment for 24 hours.
Generation of TET2 knockout cell line
TET2 knockout cells were generated by CRISPR method according to previous paper [Citation17,Citation18]. Forty-eight hours post transfection, the single-cell wells were obtained through serial dilution in 96-well plate. Ten days later, the single-cell colonies were picked and expanded for identification and future experiments. Among them, two representative TET2 KO cell lines generated with different sgRNAs (sg#1 and sg#2) were used in this study. The TET2 knockout efficiency of these colonies was examined by western blot analysis of TET2 protein expression and DNA sequencing of genomic DNA for indels around the sgRNA targeting region. The following target sequences on TET2 exon 3 were used for sgRNA design: sg#1: AGGACTCACACGACTATTC; sg#2: GGAGAAAGACGTAACTTCG.
Western blot analysis
All these experiments were carried out strictly as previously described [Citation19]. The following antibodies were used this study: anti-TET2 (Cell Signalling Technology,18950S), anti-LaminB1 (Proteintech, 66,095-1-Ig).
Adherent and soft agar cell growth assays
2 × 10³ cells were seeded in 96-well plate and the cell viability at day 0 and day 2 were measured using CellTiter-Lumi™ Luminescent Cell Viability Assay Kit (Beyotime Biotechnology Ltd., Nantong, China). The Luminescence(RLU) values of certain cells at day 2 were normalized with that of corresponding wells at day 0 and expressed as Fold change. Luminescence (RLU) values were detected by Multi-Detection Microplate Reader (Synergy HT). Soft agar growth assay was performed as previously published [Citation20].
Xenograft tumour assay
The animal protocols were approved by the Animal Welfare Committee of Fudan University. 1 × 10⁷ cells (WT and TET2 KO MCF7) were subcutaneously inoculated into the immunodeficient NOD/SCID mice (n = 3 for each group) which were subcutaneously planted with oestrogen pill. The sizes of tumours were measured on day 9, 12, 16, and 19 after initial injection. Tumours were excised on day 19 and photographed.
Dot blot and HPLC/MS analysis
Genomic DNA was extracted from cells using Dneasy blood & tissue kit (QIAGEN). Dot blot analysis of 5hmC and 5mC levels in genomic DNA was performed as previously described [Citation21]. For DNA treatment and mass spectrometric analysis, we refer to previous descriptions [Citation19].
Whole genome bisulphite sequencing (WGBS)
DNA (1 ug) with 0.5% non-methylated DNA spike-in was sheared by Covaris M220 instrument to an average size of 350 bp in length. DNA was then end-repaired, dA-tailed, and ligated with methylated adaptors. Bisulphite conversion was carried out using an EpiTect fast bisulphite conversion kit (Qiagen) according to the manufacturer’s instructions. Twenty minutes were used in both conversion steps. Bisulphite-converted DNA was then amplified with five PCR cycles to obtain the final library. The WGBS libraries were performed on a X10 platform (Illumina), WuXi App Tec. Low-quality bases and adapter-containing reads were trimmed from raw data by trim_galore with default parameters. Bsmap v2.74 was used to align reads to the reference genome (hg19) under the parameters: – w 100 – v 0.1. The coverage depth and methylation level of each cytosine were extracted by methratio.py from bam files (Table S1). Only CpG dinucleotides were analysed, information from both strands were combined, and a coverage of at least five reads was required, which were filtered from methratio.py output by awk. For hyper-DM and hypo-DM CpG sites, we used the cut-off of 20% methylation difference. Distribution analysis of DNA methylation on enhancers and EREs were performed using transformed DNA methylation data, which came from our home-made smooth algorithm.
ChIP-seq
Chromatin immunoprecipitation was performed as previously described [Citation22,Citation23]. Following antibodies were used for ChIP (anti-H3K4me1, Active Motif #39,297; anti-H3K27Ac, Active Motif #39,133; anti-ERα, Cell Signalling Technology #8644S). Library preparation and sequencing procedures were carried out as described previously according to Illumina protocols with minor modifications (Illumina, San Diego).
Firstly, same as we did for RNA-seq and WGBS-seq data, Low-quality bases and adapter-containing reads were also trimmed from raw data using trim-galore package under default parameters, trimmed reads were mapped to reference genome (hg19) using bowtie2 (v2.3.3.1) under default parameters. Duplicate reads were removed with samtools rmdup (v1.9) to get the unique mapped reads, then the mapped unique and monoclonal reads were extended to 150 bp to match the average length of insert DNA fragments of our ChIP-seq libraries (Table S1). Extended mapped unique and monoclonal reads were transformed to bedGraph files and bigWig files, which were used to calculate tag density under 50-bp resolution.
RT-qPCR and RNA-seq
Total RNA from cell lines were extracted using TRIzol reagent (Invitrogen). The concentration of isolated total RNA was measured by NanoDrop 2000 spectrophotometer (Thermo scientific). The total RNA was reverse-transcribed into cDNA using PrimerScript RT kit (Takara) according to the manufacturer’s protocol. The qPCR reactions were carried out on an Roche LightCycler 480 II system using the SYBR green Mix (Roche). The real-time PCR reactions were performed in triplicate. Gene expression was normalized to GAPDH.
For RNA-seq, barcoded RNA-seq libraries were constructed using NEBNext ultra-directional RNA library prep kit for Illumina according to the manufacturer’s instructions (New England Biolabs). Non-strand-specific pair-end 150 bp sequencing was performed on a X10 platform (Illumina), WuXi App Tec.
Low-quality bases and adapter-containing reads were trimmed from raw data by trim-galore with default parameters. Then remaining trimmed sequence were mapped against the reference genome (hg19) with hisat2, which allowed mapping across splicing junctions by read segmentation. All programs were performed with default settings unless otherwise specified. The expression level of each gene was quantified with normalized FPKM with FPKM_count.pl in RSeQC software. Differentially expressed genes were identified using DESeq2 package, Log2(Fold change) ≥1 and adjusted p value ≤ 0.05 are used to define up-regulated genes; Log2(Fold change) ≤-1 and adjusted p value ≤ 0.05 are used to define down-regulated genes (Table S1).
Integrative analysis
Identification of enhancer regions or EREs with differential H3K4me1, H3K27ac and ERα binding
The MultiBigwig Summary was used to compute the average scores of H3K4me1, H3K27ac and ERα with normalized ChIP-seq bigwig files on enhancer regions or EREs. Enhancers or EREs with gain average scores(log2(Foldchange)≥1, P-value≤0.05) or lost average scores(log2(Foldchange)≤-1, P-value≤0.05) were defined as increased(or gain) H3K4me1, H3K27ac or ERα peaks, or decreased(or lost) H3K4me1, H3K27ac or ERα peaks.
Motif enrichment
To find the possible motifs of transcription factors that were significantly enriched in the ‘gain of 5mC’ enhancers, we extracted genomic DNA sequences on ‘gain of 5mC’ enhancers from the hg19 genome FASTA file using getfasta module in bedtools tool. Then, the genomic sequences were further analysed with TRAP algorithm to identify enriched motifs, compared to JASPAR vertebrates with human promoters as the control, and Benjamini-Hochberg as the correction [Citation24].
TF prediction
To identify the upstream transcriptional factors that involve in mediating TET2KO induced gene regulation, we performed an integrative analysis on the DEGs identified by RNA-seq using Lisa in WT and TET2KO MCF7 cells as described [Citation25].
Gene set enrichment analysis
Gene set enrichment analyses (GSEA) were performed according to the instructions. To generate a custom gene set associated with ‘gain of 5mC,’ ‘gain of ERα,’ ‘loss of 5mC,’ and ‘loss of ERα’ EREs, we assigned these genes with the EREs in the 100kb regions of TSS as ERE-associated genes. Gene sets for oestrogen early response genes and oestrogen late response genes were obtained from Molecular Signatures Database.
GO analysis
GO analysis for differentially expressed genes were performed on the annotation, visualization and integrated discovery (DAVID) website (https://david.ncifcrf.gov/).
GREAT analysis
GREAT analysis for the ‘gain of 5mC’ enhancers and the ‘reduced ERα binding’ EREs were performed on the GREAT website (http://bejerano.stanford.edu/great/public/html/).
Statistical analysis
All graphs were analysed using GraphPad Prism Software. Data were presented as an average of at least three independent experiments. For all experiments with error bars, standard deviation (S.D.) was calculated and presented as mean ± SD. P-values less than 0.05 were considered statistically significant (*, p < 0.05; **, p < 0.01; ***, p < 0.001; ****, p < 0.0001; ns, not significant). Comparisons between two groups were analysed by unpaired student t-test.
Results
TET2 acts as a tumour suppressor in ERα-positive breast cancer
To evaluate the clinical significance of TET genes’ expression in breast cancer, the breast cancer patients were split into high-TETs group and low-TETs group, and be used to compare their relapse-free survival rates by Kaplan–Meier analysis [Citation26]. Interestingly, we determined that the mRNA level of TET2 was positively correlated with the patient survival rates, with higher levels of TET2 predicting better patient outcome (Fig. S1b). On the other hand, we found that TET1 was not significantly correlated with patient outcome, and TET3 displayed slightly negative correlation with the patient survival rates (Fig. S1a, and Fig. S1c). Additionally, the positive correlation between TET2 and patient survival was found to exist only in ERα-positive or Luminal A, Luminal B and HER2-positive breast cancers patients, but not the patients with ERα-negative or Basal-like and Normal-like breast cancer (Fig. S1e, and Fig. S1k). This phenomenon was similarly observed for the negative correlation between TET3 and patient survival (Fig. Sd-i, and Fig. Sj-l).
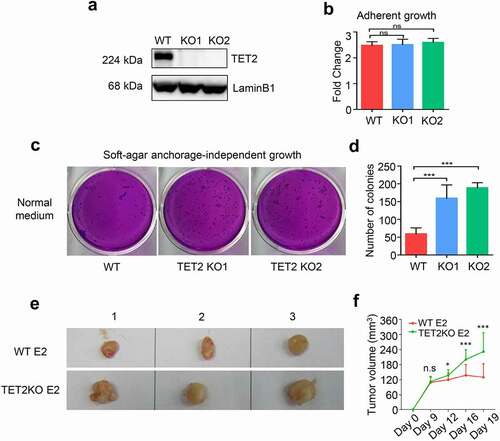
To assess the functional role of TET2 in ERα-positive breast cancer, we generated TET2-knockout (KO) MCF7 cell lines with two different sgRNAs using the CRISPR/Cas9 approach. Western blot analysis of TET2 protein expression and DNA sequencing of TET2 exon 3 (the target site of sgRNAs) confirmed the successful depletion of TET2 expression in two MCF7 single-cell clones (, and Fig. S2). WT and TET2 KO MCF7 cells displayed similar adherent proliferative properties (). Such dispensable effect of TET2 depletion on adherent cell growth was also observed in another ERα-positive breast cancer cell line, T47D cells (Fig. S3). However, TET2 KO MCF7 cells formed more colonies than WT MCF7 cells in soft-agar assays (-d). Moreover, the xenograft experiment in immunodeficient NOD/SCID mice showed that TET2 KO MCF7 cells led to remarkably larger tumours compared to WT MCF7 cells (-f). Collectively, these findings support a tumour suppressive role of TET2 in ERα-positive breast cancer.
Figure 1. TET2 acts as a tumour suppressor in ERα-positive breast cancer. (a) Western blot analysis of TET2 expression in wild-type (WT) and TET2 KO MCF7 cells. KO1 and KO2 are two representative TET2 KO clones. (b) Effect of TET2 depletion on adherent growth of WT and TET2 KO MCF7 cells. n = 3, ns: no significant difference. (c) Representative graphs of soft-agar growth assay for WT and TET2 KO cells. (d) Quantitative data of the numbers of colonies in soft-agar growth assay (D). n = 3, *** P < 0.001. (e) Xenograft tumour assay of WT and TET2 KO MCF7 cells in NOD-SCID female mice, tumours were excised at day 19 after initial injection, n = 3 for each group. (f) Measurement of xenograft tumour volume. ***p < 0.001.
TET2 loss results in DNA hyper-methylation within a subgroup of enhancers
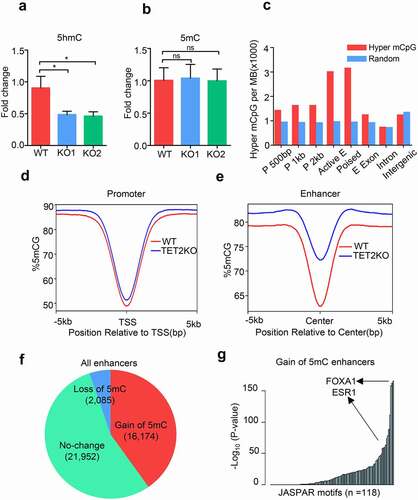
Given the importance of TET proteins in the regulation of DNA methylation dynamics, we examined the effect of TET2 deletion on DNA hydroxy-methylation (5hmC) and methylation (5mC). Dot blot and HPLC/MS analysis showed a decrease of the global 5hmC level in MCF7 cells upon TET2 depletion while the global 5mC level was not significantly altered (Fig. S4a, and -b). To identify the CpG sites affected by TET2 depletion, we conducted whole-genome bisulphite sequencing (WGBS) to profile the DNA methylomes of WT and TET2 KO MCF7 cells. Although WGBS detects both 5mC and 5hmC, our unpublished oxBS-seq and hMeDIP-seq data revealed that the major WGBS signals in MCF7 cells come from 5mC instead of 5hmC due to the lower abundance of 5hmC (data not shown). Thus, we refer to the values obtained from WGBS as 5mC in this analysis. Interestingly, TET2 depletion results in not only DNA methylation but also DNA demethylation on many CpG sites in MCF7 cells (Fig. S4b-c). Using a cut-off of 20% DNA methylation difference [Citation27], 3,882,103 and 2,848,962 CpG sites were identified to be methylated and demethylated in TET2KO MCF7 cells, respectively (Fig. S4d). Unexpectedly, we observed dramatic DNA demethylation in many large-scale intergenic regions (Fig. S4e, h). Consistent to recent reports, DNA methylation mainly occurred on the CpG sites within enhancers as well as promoters albeit in lower frequency (-e, and Fig. S4f-g). Differential methylated CpG sites analysis revealed 16,174 ‘gain of 5mC’ enhancers (~40% of total 40,211 enhancers) and 2,085 ‘loss of 5mC’ enhancers in MCF7 cells upon TET2 depletion (, and Table S2). TRAP analysis showed that the pioneer factor FOXA1 and hormone receptor ERα were among the list of TF motifs overrepresented on these ‘gain of 5mC’ enhancers (). GREAT analysis demonstrated that the ‘gain of 5mC’ enhancers-associated genes are enriched in the items of ‘Cellular response to decreased oxygen levels,’ ‘Cytoskeleton-dependent intracellular transport,’ ‘Regulation of Notch signaling pathway,’ and ‘Mammary gland alveolus development’ (Fig. S4i). Collectively, our data suggest that TET2 is required for the maintenance of DNA hypo-methylated status within a subset of enhancers in breast cancer cells.
Figure 2. TET2 depletion results in aberrant DNA methylation within a subgroup of enhancers. (a-b) HPLC/MS analysis of the global 5hmC (a) and 5mC (b) levels in WT and TET2 KO cells. (c) Histogram plots showing the relative enrichment of the hypermethylated CpG sites at several genomic features. ‘P 500bp’ indicates promoter defined as transcription start site ± 500 bp. ‘Active and Poised E’ denotes active and poised enhancer were defined with public H3K4me1 and H3K27ac ChIP-seq data. Random consists of random samplings of genomic loci. (d-e) Profile plot of the average 5mC signal on all promoters (d) and all enhancers (e) in WT (red line) and TET2 KO (blue line) MCF7 cells. (f) Pie chart showing the percentage of ‘gain of 5mC,’ ‘loss of 5mC’ and ‘no change’ enhancers in TET2 KO MCF7 cells. (g) Representation of TF binding motifs overrepresented on the ‘gain of 5mC’ enhancers. Human promoters were used as the comparison library.
TET2 loss leads to alteration of histone modifications on gain-of-5mC enhancer
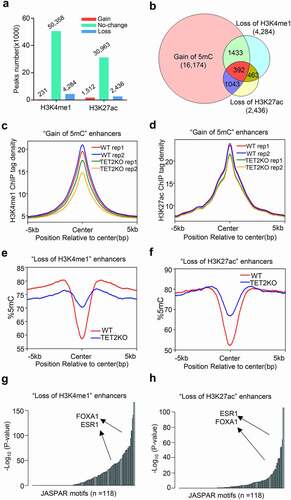
Since DNA methylation has tight crosstalk with histone modifications, we further performed ChIP-seq analysis of the enhancer histone modifications (H3K4me1 and H3K27ac) in WT and TET2 KO MCF7 cells (Fig. S5). Overall, we identified 4,284 ‘gain of H3K4me1,’ 231 ‘loss of H3K4me1,’ 2,436 ‘gain of H3K27ac,’ and 1,512 ‘loss of H3K27ac’ peaks in MCF7 cells upon TET2 depletion (, Table S3, and Table S4). Venn diagram analysis showed significant overlap between ‘gain of 5mC’ and ‘loss of H3K4me1 or H3K27ac’ enhancers that 58.9% ‘loss of H3K27ac’ and 42.6% ‘loss of H3K4me1’ enhancers undergo ‘gain of 5mC’ in TET2 KO MCF7 cells (), which was not observed for ‘gain of H3K4me1 or H3K27ac’ enhancers (Fig. S6a-c). As expected, the averaged signal of H3K4me1 and H3K27ac on the ‘gain of 5mC’ enhancers in TET2 KO MCF7 cells were lower than those in WT MCF7 cells (-d, and Fig. S6d-e). Consistently, the averaged 5mC levels across the ‘loss of H3K4me1’ and ‘loss of H3K27ac’ peaks were significantly higher in TET2 KO MCF7 cells when compared with WT MCF7 cells (-f, and Fig. S6f-g). The influence of TET2 deletion on H3K27ac modification of two example enhancers near IGFBP4 and KCNK6 were confirmed by ChIP-qPCR (Fig. S6h-i). Similarly, TRAP analysis also revealed that pioneer factor FOXA1 and hormone receptor ERα were also in the list of TF motifs overrepresented on these reprogrammed enhancers, especially on the ‘loss of H3K27ac’ enhancers (. G-H). These findings suggested that TET2 deletion leads to dramatic epigenetic reprogramming of enhancers (especially ‘gain of 5mC’ enhancer).
Figure 3. TET2 depletion leads to epigenetic reprogramming of enhancers. (a) Bar plot showing the numbers of differential enriched H3K4me1 and H3K27ac peaks in TET2 KO MCF7 cells compared with WT MCF7 cells. (b) Venn diagram showing the overlapping of ‘gain of 5mC’ enhancers, ‘loss of H3K4me1’ peaks, and ‘loss of H3K27ac’ peaks. (c-d) Profile plot of the average 5mC signal on enhancers with ‘loss of H3K4me1’ (c) and ‘loss of H3K27ac’ (d) peaks in WT (red line) and TET2 KO (blue line) MCF7 cells. (e-f) Profile plot of the average H3K4me1(e) and H3K27ac(f) tag density on ‘gain of 5mC’ enhancers in WT (red line and blue line, two replicates) and TET2 KO (green line and Orange line, two replicates) MCF7 cells. (g-h) Representation of TF binding motifs overrepresented on the ‘loss of H3K4me1’ (g) and ‘loss of H3K27ac’ (h) enhancers. Human promoters were used as the comparison library.
TET2 loss dampens E2-induced transcription of a subgroup of ERα target genes through reducing ERα binding
To investigate the effect of TET2 loss-induced enhancer reprogramming on gene transcription, we performed RNA-seq analysis for WT and TET2 KO MCF7 cells (Fig. S7a-b). Overall, we identified 617 differentially expressed genes (DEGs) (365 up-regulated genes and 252 down-regulated genes) in TET2 KO v.s. WT MCF7 cells (, and Table S5). We then used a recently developed computational biology framework, Lisa, to identify the possible transcriptional regulators that involve in mediating the transcriptional regulation [Citation25]. In line with the results of enhancer motif analysis, ERα was found in top hits of Lisa predicted upstream regulators of TET2 loss-induced down-regulated genes (). GSEA analysis showed that both ‘estrogen early response genes’ and ‘estrogen late response genes’ were down-regulated in MCF7 cells upon TET2 loss (-d). These data raise the possibility that TET2 may play an important role in E2-induced gene transcription.
Figure 4. TET2 loss dampens E2-induced transcription of a subgroup of ERα target genes. (a) Volcano plot of DEGs (adjusted P value < 0.05, log2(Fold change) ≥1 or ≤-1) in WT and TET2 KO MCF7 cells showing the number of down- (green point) and up-regulated (red point) genes. Each gene is represented by one point on the plot. n = 2. (b) Top 5 hits of TFs that may regulate the up-regulated (Left) or down-regulated (Right) DEGs between TET2 KO and WT MCF7 cells. (c-d) GSEA analysis of TET2 KO versus WT RNA-seq in MCF7 cells using gene signatures of ‘Estrogen early response genes’ (c) or ‘lEstrogen late response genes.’ Normalized enrichment score (NES) and nominal p-value were provided according to GSEA. (e) Heatmap representation of E2-upregulated genes that were dampened by TET2 loss. I-Cluster 1 represents the genes with difference only in the E2-stimulated condition. I-Cluster 2 represents the genes with difference in both the hormone-depleted and E2-stimulated conditions. (f) RT-qPCR analysis of six representative genes with attenuated response to E2-induced upregulation in MCF7 cells upon TET2 depletion.
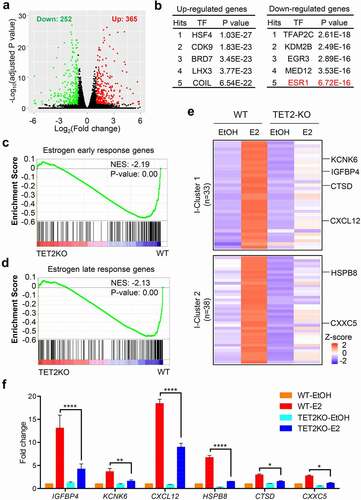
Given the importance of E2/ERα signalling in breast cancer, we compared the E2-induced transcriptomic responses of hormone-depleted WT and TET2 KO MCF7 cells. Among the 367 E2-upregulated genes in WT MCF7 cells, we found that 71 genes (I-Cluster) were significantly impaired and 42 genes (E-Cluster) were enhanced by TET2 loss (, and Fig. S7c). Notably, about a half of the I-Cluster genes (I-Cluster 1, n = 33) were negatively regulated by TET2 loss only under E2-treated condition, whereas the other half of I-Cluster genes (I-Cluster 2, n = 38) were transcriptionally down-regulated by TET2 loss under both hormone-depleted and E2-treated conditions (), and similar differential response of TET2 loss was also found to occur for E-Cluster genes (E-Cluster 1, n = 11; E-Cluster 2, n = 31) (Fig. S7d-e). As expected, enhancers nearby I-Cluster genes showed significant TET2 binding (Fig. S7d-e). However, unexpectedly, we also observed significant TET2 binding on the enhancers of the E2-upregulated genes enhanced by TET2 loss (E-Cluster 1 and E-Cluster 2) in WT MCF7 cells (Fig. S7f-g). These observations suggest dual functions of TET2 in transcriptional transcription. On one hand, TET2 could promote transcriptional activation through DNA demethylation. On the other hand, TET2 may suppress transcriptional overactivation through recruiting Sin3A and HDAC1/2 co-repressor complex to specific gene as reported previously [Citation28]. The influence of TET2 loss on E2-induced mRNA expression of several representative genes (IGFBP4, KCNK6, CXCL12, HSPB8, CTSD, and CXXC5) were also validated by RT-qPCR (). GO analysis showed that the TET2 loss-impaired E2-upregulated genes were enriched in items correlated with ‘Response to unfolded protein,’ ‘Response to endoplasmic reticulum stress,’ ‘Apoptotic signaling pathway,’ and ‘Regulation of programmed cell death’ (Fig. S8a-d), consistent to the more malignant phenotype of TET2 KO MCF7 cells.
Epigenetic remodelling of enhancers often reconfigures the binding of corresponding transcriptional factors (TFs). To assess whether TET2 loss affects the ERα cistrome, we performed ChIP-seq analysis for ERα in E2-stimulated WT and TET2 KO MCF7 cells. As expected, the average signal of ERα binding on the EREs was significantly reduced in MCF7 cells upon TET2 depletion (). We subsequently did the differential analysis for ERα binding on these EREs, 1,435 (21%) EREs were found to display ‘loss of ERα’ binding in TET2 KO MCF7 cells ( and Table S6). Of note, we also identified many EREs displaying ‘gain of ERα’ binding; however, the number is much less than that of the ‘loss of ERα binding’ regions ( and Table S6). Interestingly, we observed that ‘gain of ERα’ and ‘no-change of ERα’ EREs have significantly lower methylation levels compared to ‘loss of ERα’ EREs in WT MCF7 cells (Fig. S9a), suggesting that the EREs at higher methylation level may be more sensitive to TET2 depletion-induced DNA methylation. Additionally, we compared the DNA methylation levels on all three types of EREs in WT and TET2 KO MCF7 cells, and found ‘gain of ERα’ and ‘no-change of ERα’ EREs are slightly hypermethylated, but significantly weaker than ‘loss of ERα’ EREs upon TET2 loss in MCF7 cells (, and Fig. S9b-f).
Figure 5. TET2 loss impairs E2-induced ERα binding to a subgroup of ERα target genes. (a) Profile plot of the averaged ERα ChIP tag density on the EREs in WT and TET2 KO MCF7 cells treated with oestrogen. WT MCF7 cells treated with oestrogen is red line. TET2 KO MCF7 cells treated with oestrogen is blue line. (b) Pie chart showing the numbers of EREs with gain, loss, or no change of ERα binding in TET2 KO v.s. WT MCF7 cells. (c) Profile plot of the averaged 5mC levels on the ‘loss of ERα’ EREs in WT and TET2 KO MCF7 cells. WT MCF7 cells is red line. TET2 KO MCF7 cells is blue line. (d-e) Profile plot of the average ERα ChIP tag density on the EREs around I-Cluster 1 (d) and I-Cluster 2 (e) genes in WT and TET2 KO MCF7 cells treated with oestrogen. WT MCF7 cells treated with oestrogen is red line. TET2 KO MCF7 cells treated with oestrogen is blue line. (f) GSEA analysis of TET2 KO versus WT RNA-seq in MCF7 cells using a signature of ‘genes with reduced ERα binding.’ Normalized enrichment score (NES) and nominal p-value were provided according to GSEA. (g) UCSC genome browser view of 5mC, ERα and mRNA on two representative genes (IGFBP4 and KCNK6) in WT and TET2 KO MCF7 cells treated with oestrogen. EREs were highlighted with light green shading.
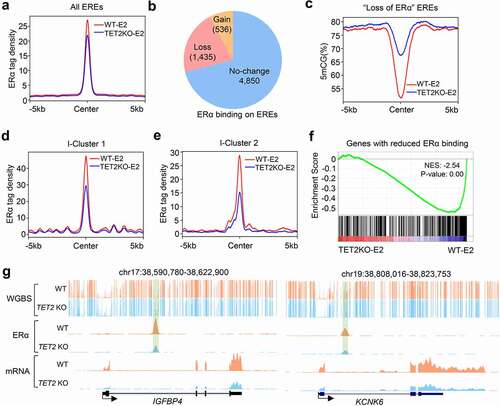
We further analysed the changes of ERα binding nearby the TET2-finetuned genes. The ERα binding on the EREs around ‘I-Cluster 1’ and ‘I-Cluster 2’ genes showed dramatic decrease (-e, and Fig. S9g-h), whereas a weak increase in the ERα binding was observed on the EREs around ‘E-Cluster 1’ and ‘E-Cluster 2’ (Fig. S9i-j). GSEA analysis showed that the genes with ‘loss of ERα binding’ EREs were down-regulated in TET2 KO MCF7 cells (), by contrast, the genes with ‘gain of ERα binding’ EREs were up-regulated in TET2 KO MCF7 cells (Fig. S9k). As shown in (the UCSC snapshots of two representative genes), our data suggest that TET2 fine tunes the gene transcription of a subgroup of ERα targets (as well as the targets of other TFs) through maintaining enhancer hypomethylation, active histone modifications and efficient TF binding.
Discussion
In this study, we characterize TET2 as a tumour suppressor in ERα-positive breast cancer cells. Mechanistically, TET2 loss induces DNA hyper-methylation on the CpGs within a large proportion of enhancers, leading to the reconfiguration of enhancer histone marks, TF cistromes, and transcriptome. Therefore, our results provide new evidences that tumour suppressor TET2 could safeguard enhancers from epigenetic reprogramming and prevent the associated genes from aberrant epigenetic silencing in breast cancer.
First, our analysis on the prognostic values of TET genes’ mRNA expression in breast cancer patients show that TET2 mRNA expression correlates with the better overall survival of ERα-positive breast cancer patients. Conversely, TET3 gene expression correlates with poorer patient survival. According to a published study, the oncogenic effect of TET3 might be due to the upregulation of TNFalpha-p38-MAPK signalling by TET3 [Citation29]. Unexpectedly, for the ERα-negative breast cancer patients, we did not observe significant association between TET genes’ mRNA expression and the overall survival rates. Our findings highlight a context- or cell-of-origin-dependent role of TET genes in breast cancer, which may partially explain the paradoxical conclusions in the previous studies.
In agreement with the clinical data analysis, we also confirmed the tumour suppressive role of TET2 in ERα-positive MCF7 breast cancer cells as TET2 loss promotes the anchorage-independent cell growth and xenograft tumour growth. The phenotype of TET2 loss in our study is different from a previous report in which TET2 loss impairs E2-induced cell growth [Citation16]. Although their phenotype contradicts the result of clinical analysis, whether such difference was caused by the off-target effect of CRISPR/Cas9 or other factors, such as the bias in picking single-cell colonies and culture conditions, requires further investigation in the future.
TET2 can convert 5mC to 5hmC/5caC/5fC and initiate active or passive DNA demethylation [Citation3,Citation30,Citation31]. As expected, we observed a marked decrease of the global 5hmC level in MCF7 cells upon TET2 depletion. However, the global 5mC level had no significant change. Our WGBS analysis showed that TET2 depletion led to not only ‘gain of 5mC’ but also ‘loss of 5mC’ in MCF7 cells, which many explain why the global 5mC levels are comparable between WT and TET2 KO MCF7 cells. Interestingly, we noticed that ‘loss of 5mC’ (DNA demethylation) mainly occurred in many large-scale intergenic regions, consistent to a recent observation in the ESCs and T-lymphomas of Tet2−/− mice by Rao and colleagues [Citation32]. These observations point to a unrecognized role of TET2 in regulating the intergenic DNA methylation and genomic stability, while the underlying molecular mechanism requires further research.
Our previous work has shown that ectopic expression of TET2 protein could demethylate hypermethylated CpG islands and establish bivalent domain in 293 T cells [Citation19]. However, we did not observe dramatic ‘gain of 5mC’ (DNA methylation) at the promoter regions in TET2 KO MCF7 cells. We speculate that the endogenous TET2 dosage in breast cancer cells may be not sufficient to protect the promoters from aberrant DNA hyper-methylation. Alternatively, as many previous studies reported, the changes in DNA methylation at promoter regions may occur at the early stage of tumour initiation [Citation33]. Our previous work and others have showed that poised enhancers have more 5hmC enrichment, indicating that TET proteins may regulate the DNA methylation dynamics at enhancers [Citation21,Citation34–36]. Indeed, several groups have reported that ‘loss of function’ mutations or experimental depletion of TET2 gene could result in aberrant DNA hyper-methylation at enhancers in haematopoietic malignancies and mouse ESCs [Citation35–38]. Consistently, we found that TET2 depletion-induced aberrant DNA methylation mainly occurred at CpGs within the enhancer regions in MCF7 cells. However, our ox-BS analysis revealed neither significant 5hmC enrichment nor any marked change in 5hmC on the enhancers in WT and TET2 KO MCF7 cells (data not shown). Since the abundance of 5hmC is much lower than that of 5mC in cancer cells, it is rationale that the major WGBS signals in MCF7 cells come from 5mC instead of 5hmC.
Although TET2 could protect a subgroup of enhancers against aberrant DNA methylation, it is unclear how these enhancers are selectively recognized by TET2. Unlike TET1 and TET3, TET2 does not include a CpG-binding CXXC domain [Citation39]. Many reports have shown that TET2 could be recruited to chromatin by specific transcriptional factors such as CXXC4/5 and WT1 [Citation40,Citation41]. Although ERE was identified as the target of TET2, we did not detect any interaction between ERα and TET2 in MCF7 cells (data not shown). In this study, we noticed that FOXA1 and GATA3 were among the enriched motifs that undergo ‘gain-of-5mC’ in TET2 KO MCF7 cells. As a well-established pioneer factor, FOXA1 can open the condensed chromatin structure for enhancer establishment [Citation42]. Moreover, GATA3 and FOXA1 could interact with ERα and bind to EREs in breast cancer cells [Citation43]. Therefore, it will be of great interest to investigate whether FOXA1 and GATA3 play a pioneer factor role in TET2-mediated DNA demethylation and epigenomic remodelling. Our ChIP-seq analysis showed that TET2 loss-induced DNA hyper-methylation could trigger epigenetic programming of enhancers. However, only a small part of ‘gain of 5mC’ enhancers underwent ‘loss of H3K4me1’ and/or ‘loss of H3K27ac.’ The molecular mechanisms underlying the crosstalk between DNA methylation and histone modifications are still unclear.
E2/ERα signalling play critical roles in the tumorigenesis of ERα-positive breast cancer [Citation44]. Blockage of E2/ERα pathway by SERD/SERM have achieved great success in the clinically targeted therapy of ERα-positive breast cancer [Citation45–47]. Many previous studies also reported that ERα cistrome was dramatically altered during the development and progression of breast cancer [Citation48,Citation49]. Our motif analysis identified ERE as one of the top 20 motifs that undergo ‘gain-of-5mC’ in TET2 KO MCF7 cells, suggesting that TET2 depletion may likewise alter ERα cistrome and transcriptome. Our ChIP-seq and RNA-seq analyses have confirmed this hypothesis. Intriguingly, TET2 loss does not alter the response of most canonical ERα target genes but selectively impair a subgroup of ERα target genes (such as ‘Response to unfolded protein,’ ‘Response to endoplasmic reticulum stress,’ and ‘Apoptotic signaling pathway’) (Fig. S10a-b). Thus, our findings suggest a ‘double-edged sword’ role for E2/ERα signalling in breast cancer, while TET2 loss skews the role of E2/ERα signalling towards the direction of tumorigenesis.
In summary, our findings provide compelling evidences that TET2-mediated DNA demethylation safeguards the epigenetic signature of a subset of enhancers and fine-tunes the transcription of associated genes, which in turn contributes to the tumour suppressive activity of TET2 in ERα-positive breast cancer. Our work sheds light on our understanding of the epigenetic mechanisms underlying the enhancer reprogramming during breast cancer pathogenesis. However, the molecular mechanism through which certain enhancers are selectively protected by TET2 in breast cancer cells is still unknown and requires further research.
Author contributions
LT and RL conceived the project. RL performed the bioinformatic analysis. XZ, YS, and LX performed the experiments. LL and CA provided assistance in performing the experiments. HL and FW provided assistance in the bioinformatic analysis. LT, RL, XZ wrote the manuscript with the Input from all authors. All authors read and approved the final manuscript.
Data availability
The ERα ChIP-seq data in MCF7 cells were collected from the GEO database under accession number GSM1469980. ChIP-seq data of H3K4me1 and H3K27ac for MCF7 cells were collected from the GEO database under accession number GSM2308527 and GSM945854.
Our own raw and processed nucleic acid sequencing data (WGBS, H3K4me1 and H3K27ac ChIP-seq, RNA-seq, and ERα ChIP-seq) for WT and TET2 KO MCF7 cells have been deposited in NCBI Gene Expression Omnibus (GEO) (https://www.ncbi.nlm.nih.gov/geo/) under accession number GSE136673.
Most analyses were performed using publicly available software, and the codes used for statistical analysis are available upon request.
Supplemental Material
Download Zip (2.9 MB)Acknowledgments
We thank Dr. Zhennan Shi for constructing the TET2 KO MCF-7 cells and Dr. Lei Zhang for performing HPLC/MS analysis.
Disclosure statement
The authors declare that they have no competing interests.
Supplementary material
Supplemental data for this article can be accessed here.
Additional information
Funding
Related Research Data
References
- Ferlay J, Soerjomataram I, Dikshit R, et al. Cancer incidence and mortality worldwide: sources, methods and major patterns in GLOBOCAN 2012. Int J Cancer. 2015;136(5):E359–386.
- Fucito A, Lucchetti C, Giordano A, et al. Genetic and epigenetic alterations in breast cancer: what are the perspectives for clinical practice? Int J Biochem Cell Biol. 2008;40(4):565–575.
- Tan L, Shi YG. Tet family proteins and 5-hydroxymethylcytosine in development and disease. Development. 2012;139(11):1895–1902.
- Li Z, Cai X, Cai CL, et al. Deletion of Tet2 in mice leads to dysregulated hematopoietic stem cells and subsequent development of myeloid malignancies. Blood. 2011;118(17):4509–4518.
- Yang H, Liu Y, Bai F, et al. Tumor development is associated with decrease of TET gene expression and 5-methylcytosine hydroxylation. Oncogene. 2013;32(5):663–669.
- Yang L, Yu SJ, Hong Q, et al. Reduced expression of TET1, TET2, TET3 and TDG mRNAs are associated with poor prognosis of patients with early breast cancer. PLoS One. 2015;10(7):e0133896.
- Tsai KW, Li GC, Chen CH, et al. Reduction of global 5-hydroxymethylcytosine is a poor prognostic factor in breast cancer patients, especially for an ER/PR-negative subtype. Breast Cancer Res Treat. 2015;153(1):219–234.
- Wu MZ, Chen SF, Nieh S, et al. Hypoxia drives breast tumor malignancy through a TET-TNFalpha-p38-MAPK signaling Axis. Cancer Res. 2015;75(18):3912–3924.
- Hsu CH, Peng KL, Kang ML, et al. TET1 suppresses cancer invasion by activating the tissue inhibitors of metalloproteinases. Cell Rep. 2012;2(3):568–579.
- Sun, Miao, et al. “HMGA2/TET1/HOXA9 signaling pathway regulates breast cancer growth and metastasis.” Proceedings of the National Academy of Sciences 110.24 (2013): 9920–9925
- Chen JY, Luo CW, Lai YS, et al. Lysine demethylase KDM2A inhibits TET2 to promote DNA methylation and silencing of tumor suppressor genes in breast cancer. Oncogenesis. 2017;6(8):e369.
- Song SJ, Poliseno L, Song MS, et al. MicroRNA-antagonism regulates breast cancer stemness and metastasis via TET-family-dependent chromatin remodeling. Cell. 2013;154(2):311–324.
- Wu MJ, Kim MR, Chen YS, et al. Retinoic acid directs breast cancer cell state changes through regulation of TET2-PKCzeta pathway. Oncogene. 2017;36(22):3193–3206.
- Good CR, Panjarian S, Kelly AD, et al. TET1-mediated hypomethylation activates oncogenic signaling in triple-negative breast cancer. Cancer Res. 2018;78(15):4126–4137.
- Collignon E, Canale A, Al Wardi C, et al. Immunity drives TET1 regulation in cancer through NF-κB. Sci Adv. 2018;4(6): eaap7309.
- Wang L, Ozark PA, Smith ER, et al. TET2 coactivates gene expression through demethylation of enhancers. Sci Adv. 2018;4(11):eaau6986.
- Mali P, Esvelt KM, Church GM. Cas9 as a versatile tool for engineering biology. Nat Methods. 2013;10(10):957–963.
- Mali P, Yang L, Esvelt KM, et al. RNA-guided human genome engineering via Cas9. Science. 2013;339(6121):823–826.
- Kong L, Tan L, Lv R, et al. A primary role of TET proteins in establishment and maintenance of De Novo bivalency at CpG islands. Nucleic Acids Res. 2016;44(18):8682–8692.
- Zhu J, Sammons Ma, Donahue G, et al. Prevalent p53 mutants co-opt chromatin pathways to drive cancer growth. Nature. 2015;525(7568):206–211.
- Tan L, Xiong L, Xu W, et al. Genome-wide comparison of DNA hydroxymethylation in mouse embryonic stem cells and neural progenitor cells by a new comparative hMeDIP-seq method. Nucleic Acids Res. 2013;41(7):e84.
- Hawkins RD, Hon GC, Ren B. Next-generation genomics: an integrative approach. Nat Rev Genet. 2010;11(7):476–486.
- Heintzman ND, Stuart RK, Hon G, et al. Distinct and predictive chromatin signatures of transcriptional promoters and enhancers in the human genome. Nat Genet. 2007;39(3):311–318.
- Thomas-Chollier M, Hufton A, Heinig M, et al. Transcription factor binding predictions using TRAP for the analysis of ChIP-seq data and regulatory SNPs. Nat Protoc. 2011;6(12):1860–1869.
- Qin Q, Fan J, Zheng R, et al. Lisa: inferring transcriptional regulators through integrative modeling of public chromatin accessibility and ChIP-seq data. Genome Biol. 2020;21(1). DOI:10.1186/s13059-020-1934-6
- Győrffy B. , Survival analysis across the entire transcriptome identifies biomarkers with the highest prognostic power in breast cancer. Comput Struct Biotechnol J. 2021;19:4101–4109.
- Grimm SA, Shimbo T, Takaku M, et al. DNA methylation in mice is influenced by genetics as well as sex and life experience. Nat Commun. 2019;10(1):1–13.
- Zhang Q, Zhao K, Shen Q, et al. Tet2 is required to resolve inflammation by recruiting Hdac2 to specifically repress Il-6. Nature. 2015;525(7569):389–393.
- Wu M-Z, Chen S-F, Nieh S, et al. Hypoxia drives breast tumor malignancy through a TET–TNFα–p38–MAPK signaling axis. Cancer Res. 2015;75(18):3912–3924.
- Ko M, Huang Y, Jankowska AM, et al. Impaired hydroxylation of 5-methylcytosine in myeloid cancers with mutant TET2. Nature. 2010;468(7325):839–843.
- He YF, Li BZ, Li Z, et al. Tet-mediated formation of 5-carboxylcytosine and its excision by TDG in mammalian DNA. Science. 2011;333(6047):1303–1307.
- Lopez-Moyado IF, Tsagaratou A, Yuita H, et al. Paradoxical association of TET loss of function with genome-wide DNA hypomethylation. Proc Natl Acad Sci U S A. 2019;116(34):16933–16942.
- Futscher BW. Epigenetic changes during cell transformation. Adv Exp Med Biol. 2013;754:179–194.
- Yu M, Hon GC, Szulwach KE, et al. Base-resolution analysis of 5-hydroxymethylcytosine in the mammalian genome. Cell. 2012;149(6):1368–1380.
- Hon GC, Song CX, Du T, et al. 5mC oxidation by Tet2 modulates enhancer activity and timing of transcriptome reprogramming during differentiation. Mol Cell. 2014;56:286–297.
- Lu F, Liu Y, Jiang L, et al. Role of Tet proteins in enhancer activity and telomere elongation. Genes Dev. 2014;28(19):2103–2119.
- Yamazaki J, Jelinek J, Lu Y, et al. TET2 mutations affect non-CpG Island DNA Methylation at enhancers and transcription factor–binding sites in chronic myelomonocytic Leukemia. Cancer Res. 2015;75(14):2833–2843.
- Rasmussen KD, Jia G, Johansen JV, et al. Loss of TET2 in hematopoietic cells leads to DNA hypermethylation of active enhancers and induction of leukemogenesis. Genes Dev. 2015;29(9):910–922.
- Zhang P, Rausch C, Hastert FD, et al. Methyl-CpG binding domain protein 1 regulates localization and activity of Tet1 in a CXXC3 domain-dependent manner. Nucleic Acids Res. 2017;45(12):7118–7136.
- Ko M, An J, Bandukwala HS, et al. Modulation of TET2 expression and 5-methylcytosine oxidation by the CXXC domain protein IDAX. Nature. 2013;497(7447):122–126.
- Wang Y, Xiao M, Chen X, et al. WT1 recruits TET2 to regulate its target gene expression and suppress leukemia cell proliferation. Mol Cell. 2015;57(4):662–673.
- Carroll JS, Liu XS, Brodsky AS, et al. Chromosome-wide mapping of estrogen receptor binding reveals long-range regulation requiring the forkhead protein FoxA1. Cell. 2005;122(1):33–43.
- Theodorou V, Stark R, Menon S, et al. GATA3 acts upstream of FOXA1 in mediating ESR1 binding by shaping enhancer accessibility. Genome Res. 2013;23(1):12–22.
- Holst F, Stahl PR, Ruiz C, et al. Estrogen receptor alpha (ESR1) gene amplification is frequent in breast cancer. Nat Genet. 2007;39(5):655–660.
- Allred DC, Anderson SJ, Paik S, et al. Adjuvant tamoxifen reduces subsequent breast cancer in women with estrogen receptor-positive ductal carcinoma in situ: a study based on NSABP protocol B-24. J Clin Oncol. 2012;30(12):1268–1273.
- Iwase H, Yamamoto Y. Clinical benefit of sequential use of endocrine therapies for metastatic breast cancer. Int J Clin Oncol. 2015;20(2):253–261.
- Patel HK, Bihani T. Selective estrogen receptor modulators (SERMs) and selective estrogen receptor degraders (SERDs) in cancer treatment. Pharmacol Ther. 2018;186:1–24.
- Magnani L, Ballantyne EB, Zhang X, et al. PBX1 genomic pioneer function drives ERalpha signaling underlying progression in breast cancer. PLoS Genet. 2011;7(11):e1002368.
- Lupien M, Meyer CA, Bailey ST, et al. Growth factor stimulation induces a distinct ER(alpha) cistrome underlying breast cancer endocrine resistance. Genes Dev. 2010;24(19):2219–2227.