
ABSTRACT
Vitamin B12 has multiple biochemical functions including in the one-carbon cycle generating a methyl group for DNA methylation, and metabolism of fatty acids and amino acids to generate energy via the citric acid cycle. The aim of our study was to use a combined epigenomic and transcriptomic approach to identify novel genes mediating the effect of B12 on adipogenesis.
Human pre-adipocytes (CHUB-S7) were treated with a range of B12 (0–500 nM) concentrations from the day of cell seeding until harvesting in discovery and validation experiments prior to genome-wide methylation analysis using the Illumina HumanMethylation 450Beadchip. For transcriptomic analysis, RNA-seq libraries were run on the Illumina HiSeq 2500. To further investigate the expression of any genes on human adipogenesis, a second human preadipocyte strain was studied (SGBS) by real-time quantitative PCR (qRT-PCR).
A combined epigenetic and transcriptomic approach in differentiated human pre-adipocyte cell line, CHUB-S7, identified that the Human cartilage chitinase 3-like protein 2 (CHI3L2) gene was hypo-methylated and had increased expression in low B12 conditions. Furthermore, there was an approximately 1000-fold increase in CHI3L2 expression in the early days of adipocyte differentiation, which paralleled an increase of lipid droplets in differentiated SGBS cells and an increased expression level of markers of mature adipocytes.
In summary, we have identified a potential role of the human cartilage chitinase 3-like protein 2 (CHI3L2) in adipocyte function in the presence of low B12 levels.
Introduction
Vitamin B12 (B12: cobalamin) is a key water-soluble vitamin required for many physiological and biochemical processes in the human body. B12 is produced by bacteria as hydroxycobalamin or derived synthetically (via bacterial fermentation and synthesis) as cyanocobalamin. Sources of B12 therefore include most animal-derived foods, some fermented non-animal derived foods, or nutritional supplementation. B12 deficiency varies widely from 2.5% to 26% [Citation1]; even higher levels of deficiency are found in different sub-populations (i.e., children, young adults, pregnant women, and older adults) [Citation1]. The classical complications of severe deficiency, although uncommon, are mainly seen in the haematological or nervous systems [Citation1].
On a biochemical level, B12 has multiple functions and is a crucial cofactor to two enzymes, methionine synthase (a methyltransferase) and methylmalonyl-CoA mutase. Methionine synthase enables the one-carbon cycle to use 5-methyltetrahydrofolate as a substrate to convert homocysteine to methionine and to generate a methyl group and tetrahydrofolate. The methionine produced from this cycle is metabolized via a transulfuration pathway (the end product of which is the anti-oxidant glutathione), the methyl group is used for DNA methylation, an epigenetic process, and tetrahydrofolate allows the synthesis of DNA and RNA, via purine and thymidine. Methylmalonyl-CoA mutase catalyses the conversion of methylmalonyl-CoA to succinyl-CoA, allowing downstream metabolism of fatty acids and amino acids to generate energy via the citric acid cycle (TCA cycle) [Citation1].
The role of B12 in these multiple biochemical pathways is critical to multiple physiological processes in the human body. B12 has long been known to be required for haematopoiesis, with deficiency of the vitamin leading to neutrophil hypersegmentation and megaloblastic anaemia from impaired DNA synthesis in bone marrow due to reduced availability of purine and thymidine [Citation2]. Vitamin B12 deficiency in during early life is associated with growth and developmental neurological disorders, whereas during adulthood can cause neuropathy and neuropsychiatric disorders [Citation3]. The crucial role of B12 in the utilization of fatty acids and amino acids to produce energy (as ATP) via the TCA cycle, as well as for mitochondrial functions, has potentially wide implications for a multiple cellular process. Recent studies have now shown a clear association of vitamin B12 deficiency with increased fat mass and an adverse lipid profile (including increased LDL and cholesterol-to-HDL ratio and low HDL) [Citation4,Citation5]. The precise cellular mechanisms by which B12 deficiency exerts these effects, e.g., via altered DNA synthesis, reduced utilization of fatty acids for energy production, or reduced glutathione synthesis, are not yet known.
The key role of methionine synthase in the generation of methyl groups for DNA methylation, implicates B12 as a crucial determinant of cellular DNA methylation. We, and others, have therefore hypothesized that vitamin B12 status may influence epigenetic processes, and could offer a molecular mechanism by which an individual’s environment (e.g., diet) can influence gene function. We have previously identified that vitamin B12 deficiency is associated with decreased DNA methylation, due to decreased ratio of S-adenosylmethionine (SAM) to S-adenosylhomocysteine (SAH), the intermediates in the conversion of homocysteine to methionine, and increased expression of two gene regulators of cholesterol biosynthesis, SREBF1 and LDLR [Citation6]. Others have shown adverse metabolic phenotypes associated with B12 deficiency in in vivo models, including increased fat mass, fasting glucose and insulin resistance including in programming models [Citation4,Citation6–9]. Additional research implicates a reduced SAM:SAH ratio in reduced methyl group availability for DNA methylation [Citation10].
We therefore sought to investigate the role of B12 on DNA methylation across the epigenome, and its consequent impact on gene expression. We used an in vitro model of human adipogenesis to elucidate the potential of B12 deficiency to impair metabolic processes, as suggested by published in vivo research. To do so, we took a discovery-based approach to study the epigenome (using the Illumina HumanMethylation450 BeadChip) in CHUB-S7, a human pre-adipocyte cell line, exposed to varying concentrations of vitamin B12 during development and growth. We then validated our findings in a second experiment under the same conditions). Subsequently, we performed an integrated analysis of the validated methylation top hits and gene transcription using RNA-seq and bioinformatics analysis to identify the functional effects of B12 deficiency in adipogenesis. On identifying a credible candidate, we investigated its expression during adipogenesis in a second human pre-adipocyte strain (SGBS).
Materials and methods
Culture and differentiation of human pre-adipocytes in CHUB-S7 for discovery and validation experiments
Human preadipocyte cell line Chub-S7 were cultured and differentiated as previously described [Citation6,Citation11]. Briefly, using the custom-made B12-deficient DMEM/F12 growth media supplemented with 10% foetal bovine serum (FBS), 1% L-glutamine and 1% streptomycin and/ penicillin, the pre-adipocytes were cultured in a T-75 flask. At confluence in the T-75 flask, the cells were trypsinized and seeded into six-well plates at 10,000 cells per well in three different concentrations of B12 in DMEM/F12 growth media such as: (1) Control: ‘normal’ B12 – 500 nM (2) Low B12: B12 – 0.15 nM and (3) No B12: (B12 – 0 nM) ()). The respective DMEM/F12 growth media for each condition was changed every 48 hours until 100% confluence was achieved. Following attainment of 100% confluence in the growth media (day 0), the preadipocytes were differentiated in custom-made B12-deficient DMEM/F12 differentiation media (DM) for 72 h (day 03) and thereafter were maintained in custom-made B12 deficient DMEM/F12 nutrition media (NM) for 11 days (day 14). The day differentiation was initiated (at confluence) was considered as day 0 and the differentiated adipocytes were harvested on day 14. For methylation inhibition experiment, preadipocytes were incubated with 200 nM of 5-aza-2'-deoxycytidine (5-Aza-dC) at 50% confluency for 72 h and were differentiated at confluence ()). Folate conditions (6 µM) were kept constant across all experimental groups (both the discovery and validation experiments).
Figure 1. Study design of discovery experiment.
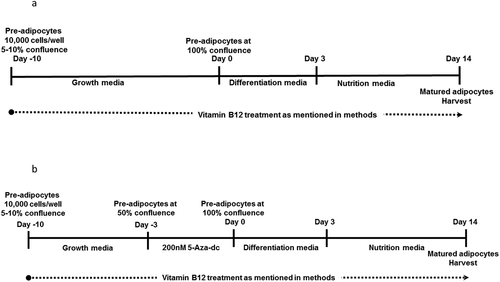
The discovery experiment was performed in cell cultures exposed to three different B12 conditions and a fourth exposure of Control + methylation inhibitor (‘Control’, ‘low’, ‘no’, ‘Control+5-Aza-dC’) (). In the validation experiment the same cell culture methods were used as in discovery experiment for the three B12 conditions, apart from the fourth exposure, using the methylation inhibitor (). All downstream experiments were performed on triplicate samples from each experimental group.
Table 1. Summary of cell culture B12 and folate conditions in discovery experiment and validation experiment.
DNA and RNA extraction (CHUB-S7)
On day 14, the differentiated adipocytes were trypsinized, pelleted by centrifugation and the supernatant was discarded. Cell pellets were snap-frozen in liquid nitrogen and stored at −80°C prior to RNA and DNA extraction (using the RNeasy Lipid Tissue Kit and DNeasy Blood and Tissue Kit; Qiagen, Venlo, Limburg, according to manufacturer’s protocol).
DNA methylation and bioinformatic analysis (CHUB-S7)
High-quality genomic DNA was bisulphite-converted using EZ-96 DNA Methylation Kit (Zymo Research, Irvine, CA, USA) according to manufacturer’s protocols. Genome-wide DNA methylation analysis was performed using Illumina HumanMethylation 450Beadchip (‘methylation array’; Illumina, San Diego, CA, USA) on sample triplicates from the four experimental groups in the discovery experiment (), and three in the validation experiment (). Methylation array analysis methods are as described previously [Citation6,Citation12]. Data were filtered to remove cross-hybridizing probes, X and Y chromosome probes and those with a detection p value of ≥0.05. Data were quantile normalized per colour channel, per bead and per tissue type; a method shown to reduce standard error with high performance. Non-hierarchical clustering was performed to exclude positional or batch effects and to look for methylation differences across all array probes being used in analysis. Beta Mixture Quantile (BMIQ) normalization method was used to correct for the two different probe types contained on the array. Analysis of differentially-methylated positions (‘DMPs’) was performed using open-source R-based software including Limma, and Benjamini and Hochberg false discovery rate control was applied.
RNA-seq and bioinformatic analysis (CHUB-S7) in discovery experiment
OligodT beads enriched poly-A mRNA isolated from cellular total RNA was used to construct multiplexed strand-specific RNA-seq libraries using the Illumina TruSeq Total RNA Library Prep Kit (Illumina, San Diego, CA, USA) following the manufacturer’s protocols. Individual libraries were quality checked on an Agilent 2100 Bioanalyzer and quantified on QuBit 2.0 fluorometer. Libraries were indexed, pooled and amplified, then sequenced on the Illumina HiSeq 2500.
RNA-seq data was mapped using appropriate software (Tophat, Bowtie 2 and samtools) with default settings. Mean insert sizes and standard deviations were calculated in silico using Picard Tools from 1,000,000 reads. Duplicates were filtered using Picard Tools and reads were assigned to a gene using HTSeq. Analysis of differential gene expression was performed using DESeq2, applying a generalized linear model in which counts are modelled using a negative binomial distribution. Genome-wide corrected p values were calculated using Benjamini-Hochberg multiple testing adjustment procedure. Normalized variance stabilizing transformed counts were used for all plots and further analysis.
Culture and differentiation of human pre-adipocytes in SGBS
Following experimentation with CHUB-S7 the top hit was studied functionally in the Human Simpson Golabi Behmel Syndrome (SGBS) [Citation13] pre-adipocyte cell strain. Human SGBS pre-adipocytes were maintained by twice weekly passages in DMEM/Ham’sF12 (1:1) medium (Invitrogen, Paisley, UK) containing ‘normal’ B12 (500 nM) and folate (6 μM) levels (), 10% foetal calf serum (FCS; Invitrogen), 100 U/ml penicillin (Invitrogen), 100 μg/ml streptomycin (Invitrogen), 33 μM biotin and 17 μM pantothenate as previously described [Citation6,Citation14]. Differentiation of SGBS was performed according to Wabitsch et al. [Citation13] and Fischer-Posovszky et al. [Citation15] protocols. Briefly, initiation of SGBS cells differentiation into adipocytes was done using 60–80% confluent cells in T175 flasks. Cells were washed three times with PBS and cultured in FCS-free differentiation induction medium (DIM) (DMEM/Ham’s F12 (1:1) medium supplemented with 100 U/ml penicillin, 100 μg/ml streptomycin, 33 μM biotin,17 μM pantothenate, 10 μg/ml human transferrin, 10 nM insulin, 100 nM hydrocortisone, 0.2 nM triiodothyronine, 25 nM dexamethasone, 500 μM 3-isobutyl-1-methylxanthine (IBMX) and 2 μM rosiglitazone (Cayman Chemical, Ann Arbor, MI, USA). After 4 days, this induction medium was replaced with differentiation medium (Induction medium without dexamethasone, IBMX and rosiglitazone), and incubated for a further 20 days with regular fresh induction media changes every 3–4 days. SGBS cells were regularly collected at days 0 (D0), 4 (D4), 8 (D8), 11 (D11), 14 (D14) and 18 (D18) for oil red lipid staining and gene expression analysis.
Oil red O lipid staining of differentiated SGBS cells
Lipid droplets in differentiated SGBS adipocytes cells were detected using Oil Red O (ORO) staining (Sigma-Aldrich) following the manufacturer’s instructions. ORO-stained SGBS adipocytes were observed under fluorescence microscope (iRiS™ Digital Cell Imaging System, Logos Biosystems, Inc) and digital images were captured at 4× and 10× magnification.
Real Time-quantitative PCR (qRT-PCR) analysis of differentiated SGBS cells
For qRT-PCR analyses, cells were trypsinized, immediately lysed in RLT buffer and then RNA extracted using spin-column–based RNEasy Mini Kit method according to manufacturer’s instructions (Qiagen; Hilden, Germany). Extracted RNA was quantified on NanoDrop spectrophotometer (Nanodrop Technologies; Montchanin, DE). One microgram total RNA from each sample was reverse transcribed using SuperScript IV First-Strand reverse transcriptase synthesis kit (Thermo Fisher Scientific), according to the manufacturer’s instructions.
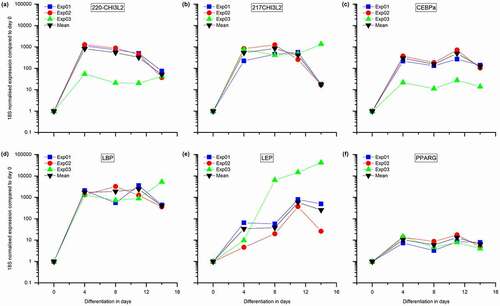
Expression analysis of chitinase 3-like 2 was done using CHI3L2 Thermofisher TaqMan® gene expression assays Hs00970220_m1 (targeting exon 6–7) and Hs00970217_m1 (targeting exon 3–4) (220-CHI3L2 and 217-CHI3L2) (). Expression assay to genes involved in adipocyte differentiation, such as Peroxisome proliferator-activated receptor gamma (PPARG), CCAAT enhancer binding protein alpha (CEBPA), leptin (LEP), and lipopolysaccharide binding protein (LBP) [Citation16,Citation17] (ThermoFisher) was used to follow differentiation stages of SGBS cells using qRT-PCR (). These specific oligonucleotides manufactured by Applied Biosystems (Thermo Fisher Scientific) were used following manufacturers instruction with TaqMan™ Fast Advanced Master Mix (Thermo Fisher Scientific). qRT-PCR reaction conditions were cDNA denaturation at 95°C for 5 min, cDNA amplification at 95°C for 15 s, primers annealing at 62°C for 1 min for 45 cycles, then melt curve was obtained at 95°C for 15 s, 60°C for 1 min and a final step at 95°C for 15 s. qRT-PCR results were analysed using Thermo Fisher StepOne software v2.3. Results were normalized using the Applied Biosystems® Human GAPD (GAPDH) Endogenous Control (FAM™ Dye ⁄ MGB Probe, as reference housekeeping gene, and evaluated using the 2−ΔΔCt method and compared to control samples [Citation18].
Table 2. ThermoFisher expression assays.
Results
CHUB-S7 cell line
B12 treatment had no significant effect on cell viability and there were no gross microscopic differences in cell morphology.
DNA methylation analysis
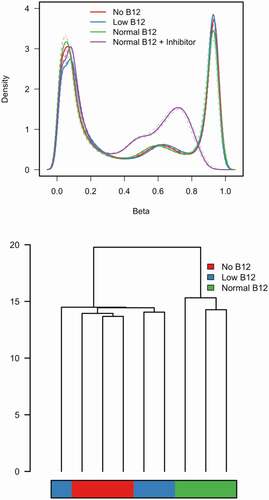
11,648 probes mapping to chromosome X and Y were removed. 40,590 probes were removed due to the probes being non-specific as suggested in Price et al. [Citation19] and 369 probes were removed with a detection p value < 0.05. This resulted in a total of 432,905 probes used for all further analysis. The ‘Control (‘normal B12') + methylation inhibitor’ samples showed significant reduction in methylated probes with a peak of methylation now occurring just below 0.8 beta value compared to 0.9 for all other samples ()). Therefore, these samples were removed prior to quantile normalization. Mean methylation values before normalization across all filtered probes were no different in the low, no and control conditions (beta values 0.480, 0.472, 0.466 (p value >0.01) suggesting no large global changes in methylation at 432,905 probes measured due to B12 condition. Hierarchical clustering of quantitative methylation at filtered probes ()) showed the largest methylation differences occurring between the control (‘normal B12') and other groups (‘low B12’ and ‘no B12’).
Figure 2. Density and Hierarchical plots in the discovery experiment.
DNA methylation differences were identified in comparison of ‘Control’ versus ‘No B12’ with 4 probes reaching genome-wide significance using t-test based statistics and Benjamini and Hochberg control of false discovery (adjusted p < 0.05) ()). All four probes had lower methylation in ‘No B12’ samples compared to the ‘Control’ samples with an absolute beta value difference > 0.1. In the comparison between ‘Low B12’ and ‘Control’ we found no significant differences although three probes showed nominal significance (q value = 0.0503). We also found ‘cg26366091’ to show similar differences to that of the ‘No B12’ vs ‘Control’ with a q value = 0.062.
Figure 3. Volcano plots in discovery and replication experiment.
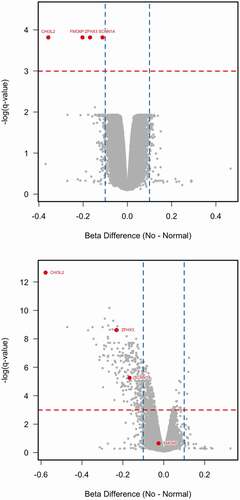
To validate these findings, we performed a second Illumina 450 K experiment using newly derived samples from three experimental groups: ‘No B12,’ ‘Low B12’ and ‘Control’ (see – replication experiment). We found that three of the four probes (‘cg26366091,’ ‘cg10298741’ and ‘cg26215727’) showed the same significant difference in methylation between the ‘No B12’ and ‘Control’ samples ()). All four probes also showed significant differences in methylation between ‘Low B12’ and ‘Control’ although probe ‘cg06041466’ had an absolute beta difference <0.05 so is unlikely to be real. Therefore, we have found three replicated probes, which show significant hypo-methylation in response to reduced B12 levels.
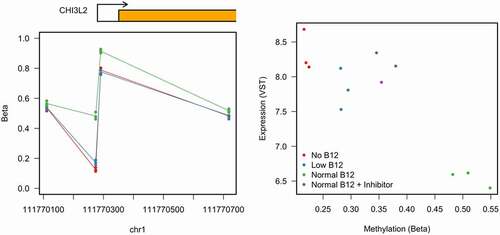
Examining the location of each of the four probes suggested that only cg26366091 (CHI3L2) was likely to be transcriptionally relevant. Hence, cg06041466 (FMO6P) is located 110bp to the nearest transcription factor (TF) binding site (FOXO3/4) and 480bp away from the nearest transcriptional start site (TSS). cg26215727 (SCNN1A) is located 39bp to the nearest TF binding site (PPARA) and 198bp away from the nearest TSS. cg10298741 (ZFHX3) is located 51bp to the nearest TF binding site (HNF1). Therefore, cg06041466, g26215727 and cg10298741 are all unlikely to interfere with TF binding directly. In contrast, cg26366091 (CHI3L2) is located only 28bp away from the highest ranking TSS for CHI3L2 and therefore may interfere directly with the gene transcription machinery.
Combined analysis of 450K methylation and RNA-seq expression data at methylation top hits
We next took these three DMPs identified in both discovery and replication experiments forward in subsequent functional analysis. We interrogated RNA-seq expression data in the discovery set (log2FC) from the genes where these DMPs were located () and correlated methylation difference with expression difference. Of the three DMPs only a single probe, located within the promoter near to CHI3L2 showed a decrease in methylation and a significant increase in expression (q = 1×10⁻¹⁸). To investigate this further we checked the region around the transcriptional start site of CHI3L2 for other probes contained on the Illumina 450 K array. In total, we have four probes which assay the methylation in this region, the two found previously and two further probes, one upstream of the promoter and one contained within the gene body which both show no difference due to B12 conditions suggest the methylation difference is located within the region close to the transcription start site ()). Interestingly, we found using non-normalized data that in the inhibitor sample this region also undergoes a reduction in methylation and shows increased expression of the gene ()).
Figure 4. Methylation difference between ‘No’ and ‘Normal’ versus log2FC gene expression at replicated hits, displayed by gene name.
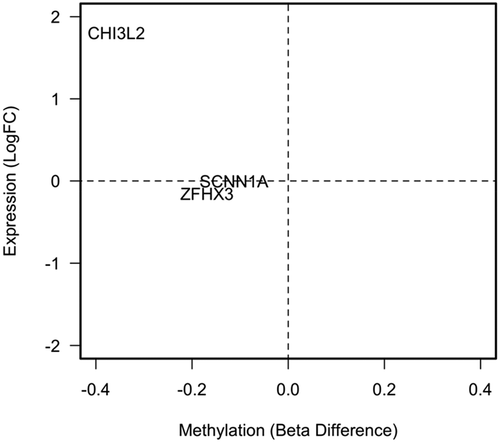
Figure 5. Combined analysis of methylation and expression data from the discovery dataset restricted to CHI3L2.
CHI3L2 is flanked on one side with CHIAP1 (Chitinase, Acidic Pseudogene 1), which is a Pseudogene. No differential expression in RNA-seq top hits were found for this gene. On the other side of CHI3L2, the closest gene is DENND2D and then CEPT1. DENND2D (DENN Domain Containing 2D) is a protein coding gene, which acts as a guanine nucleotide exchange factor that may activate RAB9A and RAB9B. Interestingly, in our RNA-seq dataset this gene was also differentially expressed (Log2FC −1.5; q = 3.9E-09) compared to CHI3L2 (Log2FC −2.1; q = 1.04E-18E). CEPT1 codes for a choline/ethanolaminephosphotransferase. No differential expression in RNA-seq top hits were found for this gene.
In the RNA-seq experiment 407 genes were found to significantly (q < 0.01 and log2FC >1.5) differentially expressed between control (‘normal B12') and no B12 conditions; these are listed in the supplementary table.
Investigation of CHI3L2 expression during human adipogenesis
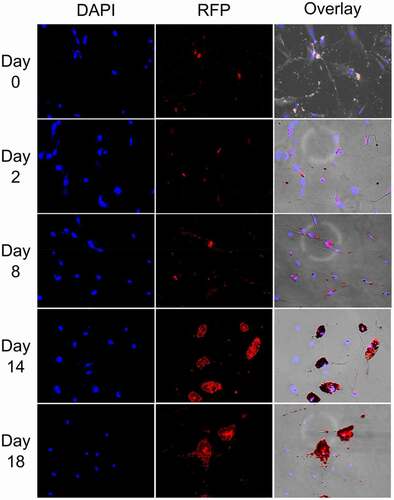
Genome-wide association analysis (GWAS) studies have previously linked genetic variants within and in linkage disequilibrium with CHI3L2 gene to metabolic phenotypic traits, including cholesterol and triglycerides levels [Citation20]. The strong genetic link between CHI3L2 and blood lipid phenotypes, combined with our previous observations of association of low B12 levels with increased cholesterol biosynthesis [Citation6] prompted us to investigate CHI3L2 expression during adipogenesis. Rather than restrict our analysis to one human pre-adipocyte line (CHUB-S7), we used a classical in vitro model of human white pre-adipocytes differentiation, the Simpson Golabi Behmel Syndrome (SGBS) cell line [Citation13,Citation15]. Morphological changes during the cellular differentiation and phenotype in SGBS cells were confirmed by Oil red O lipid staining (). An increase of lipid droplets accumulation in SGBS cytoplasm could be readily observed over time (), consistent with emergence of differentiated adipocytes.
Figure 6. Oil red O lipid and DAPI staining of SGBS cells at different stages of differentiation from day 0–18 (10× magnification).
The expression of CHI3L2 and adipogenesis markers including PPARG, CEBPA, LEP, and LBP were assessed in SGBS cells at different developmental stages of differentiation (from D0 to D18) using qRT-PCR assay (). Mean levels of CHI3L2 were found to increase approximately 1000-fold by day 4 of SGBS adipocyte differentiation ()) in the presence of ‘normal vitamin B12 conditions’); this is mirrored by an increase in gene expression of CEBPa, LBP, LEP, and PPARG ()) that are markers of adipocyte differentiation. Between days 11 and 12, the expression of all genes decreased. To further investigate these findings, we interrogated the RNA-seq data from the discovery experiment in CHUB-S7 cells. Comparing no B12 with control (‘normal’) B12 conditions, revealed significant expression changes for LBP (q = 3E-23 and log2FC = 2), PPARG (q = 4E-8 and log2FC = −0.8) and LEP (q = 0.001 and log2FC = 0.5).
Figure 7. Gene expression analysis during SGBS cellular differentiation.
Discussion
Combined RNA-seq and DNA methylation analysis of CHUB-S7 human pre-adipocytes cultured in the presence or absence of vitamin B12 revealed that the Human cartilage chitinase 3-like protein 2 (CHI3L2) gene was hypo-methylated and consequently had an increased expression in B12 deficiency conditions.
CHI3L2 is a chitinase 3-like 2 protein which is part of the glycohydrolase family 18. This family includes two chitinases that are CHIA (acidic mammalian chitinase) and CHIT1 (chito-triosidase) and four chitinase-like proteins including CHI3L1 (chitinase 3-like 1); CHI3L2 (chitinase 3-like 2); CHID1 (stabilin 1-interacting chitinase-like protein and OVGP1 (oviductin) [Citation21,Citation22].
Chitinases are enzymes that degrade chitin, which constitute the cell wall of fungi. They play an important role in both innate and adaptive type 2 immune responses [Citation23–25]. Chitinase-like proteins are structurally similar to chitinase proteins and can bind chitin, but they lack the enzymatic activity [Citation26]. The most representative chitinase-like proteins are CHI3L1 and CHI3L2 [Citation27].
CHI3L2 is poorly characterized but known to be involved in cartilage biosynthesis via binding of chito-oligosaccharides and glycans in humans [Citation28]. CHI3L2 has also been shown to activate ERK1/ERK2 and regulate promoters of cell growth [Citation29], is associated with the progression of neurodegeneration in motor cortex and spinal cord of amyotrophic lateral sclerosis sALS patients [Citation27], and is regulated by miRNAs. Li et al. [Citation30], have also reported that miR-216a-5p is involved in diabetes and targeted genes including CHI3L2. Furthermore, the chitinases including, CHIA, CHIT1, CHI3L1, CHI3L2, and CHID1, have a central role in the monocyte lineage and chronic inflammatory disease [Citation31].
Interestingly, Neurospora crassa is a class of fungi known for its ability to convert homocysteine to methionine using vitamin B12-independent methionine synthase. In other organisms (apart from plants), methionine synthase requires vitamin B12 to convert SAH to SAM in the one-carbon cycle [Citation32]. In this process, methionine is converted to AdoMet, a universal methyl group donor for methylation of DNA and RNA [Citation6]. We have shown that lack of vitamin B12 regulates the methylation of SREBF1 and LDLR genes by limiting the synthesis of methionine and this in turn activates cholesterol production [Citation6]. Overproduction of adipose cholesterol and triglycerides may lead to adipocytes dysfunction and obesity resulting in metabolic complications and insulin resistance [Citation33].
Monocyte-derived cell lines, activated macrophages and neutrophils express chitinases and chitinase-like proteins, in response to proinflammatory cytokines in various tissues. Mammalian chitinases catalyse the hydrolysis of chitin producing pathogens and are involved in immune regulation and inflammatory responses to bacterial infection, tissue inflammation, metabolic disorder, and degenerative disease [Citation25].
In obese individuals, subcutaneous adipose tissue dysfunction may result in impaired triglycerides storage and possibly diversion of free fatty acids to the liver or the visceral compartment. Adipose tissue inflammation can occur once this condition is established, culminating in higher secretion of proinflammatory cytokines and macrophage infiltration. In adipose tissue from obese mice and humans, infiltrated macrophages can aggregate around dead adipocytes forming ring patterns called crown-like structures (CLS) [Citation34]. The presence of CLS is associated with insulin resistance and macrophages within CLS have been shown to be proinflammatory [Citation35]. Lê et al. [Citation34], showed that CHI3L2 was one of the top 15-upregulated genes in CLS+ compared with CLS- individuals. CHI3L2 was first isolated from cartilage cells culture [Citation36]; however, it has also been demonstrated that production of CHI3L2 is stimulated by IFN-γ or IL-4 and released by activated macrophages as response to autoimmune reaction [Citation37].
In studies of the second human cell line SGBS there was an approximately 1000-fold increase in CHI3L2 expression in the early days of differentiation, which paralleled an increase of lipid droplets in differentiated SGBS cells and an increased expression level of markers of mature adipocytes when cultured in conditions of ‘normal’ vitamin B12. These findings are supported by recent studies, in which CHI3L2 was found to correlate with lipid droplet size and high lipogenic capacity [Citation38]. Our results and those of others therefore suggest that CHI3L2 may play a role, and potentially be used as a marker for adipocyte differentiation. A limitation of our qualitative approach was that when we cultured the SGBS cells, we only used DMEM/Ham’sF12 (1:1) media that contains 500 nM B12 (same as control B12 used for CHUB-S7) and did not compare it to SGBS cells incubated with low or no B12 media. However, further interrogation of the RNA-seq data in CHUB-S7 cells comparing no B12 with control (‘normal’) B12 conditions, revealed significant expression changes for LBP, PPARG and LEP which is consistent and supports the findings in SGBS cells.
In the discovery experiment significant changes in methylation were observed in addition to CHI3L2: ZFHX3, SCNN1A, and FMO6P. However, whereas in the replication experiment, although the findings for CHI3L2, ZFHX3, and SCNN1A were confirmed, that for FMO6P was not validated. We did not further follow-up ZFHX3 and SCNN1A in SGBS cells, since they were not significant in the genome-wide transcriptomic study defined by a q value of <0.01 and log2FC of 1.5. However, there is not always a perfect correlation between gene methylation and expression at a single time point, especially if the methylation site is outside the promoter or in the body of the gene [Citation39]. Therefore, given the consistency between discovery and validation experiments for methylation, the potential relevance of the ZFHX3 and SCNN1A for adipogenesis are discussed further.
ZFHX3 is the zinc finger homeobox 3 circadian rhythm gene that encodes a transcription factor with multiple homeodomains and zinc finger motifs. Its function has been reported as tumour suppressor for several cancers and sequence variants have been associated with atrial fibrillation (Entrez gene summary). Interestingly, in genome wide association a strong association is seen between ZFHX3 and BMI (p = 2.3 E-22) (https://t2d.hugeamp.org/; T2D portal last accessed 9 August 2021) Furthermore, low-frequency coding variants of ZFHX3 have been found by Turcot and colleagues [Citation40], that has a potential role in adiposity. Genes flanking ZFHX3 include the pseudogenes: KRT18P18, RPSAP56, and RNAU7-71P and the transcript HCCAT5, none of which were differentially expressed depending on the B12 concentration in our experiments.
SCNN1A is the sodium channel epithelial sub-unit alpha/sodium permeable non-voltage-sensitive ion chain. An association of SCNN1A variants with waist to hip ratio adjusted for BMI has been described (https://t2d.hugeamp.org/; T2D portal last accessed 9 August 2021);, but there is no further evidence of this gene being important to adipogenesis or weight regulation. Genes flanking SNN1A include LTBR, TNFRSF1A, and the pseudogene RN7SL391P. The lymphotoxin beta gene (LTBR) is an interesting candidate for adipocyte function since LTBR signalling has anti-adipogenic action through NF-kB pathways [Citation41]. Furthermore, like SCNN1A, a strong association is documented between LTBR and waist hip adjusted for BMI (https://t2d.hugeamp.org/;T2D portal last accessed 9 August 2021). In our RNA-seq data, the expression of this gene was not differentially expressed between control (‘normal B12') and no B12 conditions.
This differentiation process in the discovery and validation experiments mimics the in vivo embryonic differentiation period during the developmental stages. Pre-adipocytes were cultured in the custom-made B12 deficient/sufficient media at very low cell number, such as 10,000 per well until confluence, where cells undergo multiple doublings, then adipocyte differentiation was started by restricting the nutrition (FBS), and thereafter, supplementing with nutrition media for fully differentiated adipocytes. Searching the EWAS catalogue beta (http://www.ewascatalog.org/) (last accessed 9 August 2021) methylation changes for cg06041466 (FMO6P), cg26366091 (CHI3L2), cg26215727 (SCNN1A), and cg10298741 (ZFHX3) have not been studied in adipocytes or their differentiation. Nonetheless, significant changes in methylation were found in these cpg sites in all four genes, in several human tissues including whole blood, PBMNCs and cord blood, in relation to early childhood and gestational age, which may have relevance to the current study especially for adipogenesis.
Two studies have investigated potential methylation changes related to diet. Chamberlain and colleagues [Citation42] studied the dietary intake of one-carbon metabolism nutrients using a food frequency questionnaire and DNA methylation on peripheral blood. They concluded that there ‘is little association with blood DNA methylation.’ Mandaviya and colleagues [Citation43] focussed on both folate and vitamin B12 intake. For B12, they found 29 differentially methylated regions of which the most significant spanned a region spanning the calcium-binding tyrosine phosphorylation-regulated gene (CABYR). However, vitamin B12 intake was not associated with any differentially methylated positions. Methylation changes in relation to B12 for either CHI3L2, FMO6P, or SCNN1A were not described in either publication or in the EWAS catalogue.
Although a weakness of our conclusions regarding CHI3L2, is that it is based on in vitro work alone, we have used two separate human cell lines and have a robust methylation signature using both discovery and validation experiments. Furthermore, the methylation effect correlates with the findings by RNA-seq and a functional effect. Whilst CHI3L2 expression is associated with neurological pathology (amyotrophic lateral sclerosis, Alzheimer’s disease, and glioblastoma), carcinogenesis (renal and pancreatic cancer) and osteoarthritis, this is the first report suggesting a role in the adipogenesis and its regulation by vitamin B12.
In summary we demonstrate how epigenetic modifications impact the transcriptome and a single nutrient can induce global gene expression changes. More specifically, we have identified a potential role of the human cartilage chitinase 3-like protein 2 (CHI3L2) in adipocyte function in the presence of low B12 levels.
Data sharing statement
Epigenetic and transcriptome-wide expression datasets underlying the described experiments are available through the corresponding author.
Author contributions
BWO, AA, SC, and NP performed the investigations and RL the bioinformatic analysis, GAH, SF, EB, and GT supervised the study, GAH, SF, GT, and SP conceptualized the study and acquired the funding. GAH wrote the first draft of the manuscript with the help of SF and RL. All authors contributed to the interpretation of the results and writing of the manuscript thereafter. GAH is the guarantor of this work and, as such, had full access to all the data in the study and takes responsibility for the integrity of the data and the accuracy of the data analysis.
Acknowledgements
Technical support from the Genome and Imaging Centres, Blizard Institute, Queen Mary University of London.
Disclosure statement
No potential conflict of interest was reported by the author(s).
Additional information
Funding
References
- Green R, Allen LH, Bjorke-Monsen AL, et al. Vitamin B12 deficiency. Nat Rev Dis Primers. 2017;3(1):17040.
- Koury MJ, Ponka P. New insights into erythropoiesis: the roles of folate, vitamin B 12, and iron. Annu Rev Nutr. 2004;24(1):105–131.
- Reynolds E. Vitamin B12, folic acid, and the nervous system. Lancet Neurol. 2006;5(11):949–960.
- Yajnik CS, Deshpande SS, Jackson AA, et al. Vitamin B12 and folate concentrations during pregnancy and insulin resistance in the offspring: the Pune maternal nutrition study. Diabetologia. 2008;51(1):29–38.
- Adaikalakoteswari A, Vatish M, Lawson A, et al. Low maternal vitamin B12 status is associated with lower cord blood HDL cholesterol in white Caucasians living in the UK. Nutrients. 2015;7(4):2401–2414.
- Adaikalakoteswari A, Finer S, Voyias PD, et al. Vitamin B12 insufficiency induces cholesterol biosynthesis by limiting s-adenosylmethionine and modulating the methylation of SREBF1 and LDLR genes. Clin Epigenetics. 2015;7(1):14.
- Ho M, Halim JH, Gow ML, et al. Vitamin B12 in obese adolescents with clinical features of insulin resistance. Nutrients. 2014;6(12):5611–5618.
- Sinclair KD, Allegrucci C, Singh R, et al. DNA methylation, insulin resistance, and blood pressure in offspring determined by maternal periconceptional B vitamin and methionine status. Proc Natl Acad Sci U S A. 2007;104(49):19351–19356.
- Cordero P, Gonzalez-Muniesa P, Milagro FI, et al. Perinatal maternal feeding with an energy dense diet and/or micronutrient mixture drives offspring fat distribution depending on the sex and growth stage. J Anim Physiol Anim Nutr (Berl). 2015;99(5):834–840.
- Dominguez-Salas P, Cox SE, Prentice AM, et al. Maternal nutritional status, C(1) metabolism and offspring DNA methylation: a review of current evidence in human subjects. Proc Nutr Soc. 2012;71(1):154–165.
- Adaikalakoteswari A, Vatish M, Alam MT, et al. Low vitamin B12 in pregnancy is associated with adipose-derived circulating miRs targeting PPARgamma and insulin resistance. J Clin Endocrinol Metab. 2017;102(11):4200–4209.
- Finer S, Mathews C, Lowe R, et al. Maternal gestational diabetes is associated with genome-wide DNA methylation variation in placenta and cord blood of exposed offspring. Hum Mol Genet. 2015;24(11):3021–3029.
- Wabitsch M, Brenner RE, Melzner I, et al. Characterization of a human preadipocyte cell strain with high capacity for adipose differentiation. Int J Obes Relat Metab Disord. 2001;25(1):8–15.
- Darimont C, Zbinden I, Avanti O, et al. Reconstitution of telomerase activity combined with HPV-E7 expression allow human preadipocytes to preserve their differentiation capacity after immortalization. Cell Death Differ. 2003;10(9):1025–1031.
- Fischer-Posovszky P, Newell FS, Wabitsch M, et al. Human SGBS cells - a unique tool for studies of human fat cell biology. Obes Facts. 2008;1(4):184–189.
- Moseti D, Regassa A, Kim WK. Molecular regulation of adipogenesis and potential anti-adipogenic bioactive molecules. Int J Mol Sci. 2016;17(1):124.
- Tung EWY, Peshdary V, Gagne R, et al. Adipogenic effects and gene expression profiling of firemaster(R) 550 components in human primary preadipocytes. Environ Health Perspect. 2017;125(9):097013.
- Livak KJ, Schmittgen TD. Analysis of relative gene expression data using real-time quantitative PCR and the 2(-Delta Delta C(T)) method. Methods. 2001;25(4):402–408.
- Price ME, Cotton AM, Lam LL, et al. Additional annotation enhances potential for biologically-relevant analysis of the illumina infinium HumanMethylation450 BeadChip array. Epigenetics Chromatin. 2013;6(1):4.
- Kathiresan S, Manning AK, Demissie S, et al. A genome-wide association study for blood lipid phenotypes in the Framingham heart study. BMC Med Genet. 2007;8(Suppl 1):S17.
- Bleau G, Massicotte F, Merlen Y, et al. Mammalian chitinase-like proteins. EXS. 1999;87:211–221.
- Di Rosa M, Malaguarnera G, De Gregorio C, et al. Evaluation of CHI3L-1 and CHIT-1 expression in differentiated and polarized macrophages. Inflammation. 2013;36(2):482–492.
- Lee CG, Da Silva CA, Lee JY, et al. Chitin regulation of immune responses: an old molecule with new roles. Curr Opin Immunol. 2008;20(6):684–689.
- Di Rosa M, Zambito AM, Marsullo AR, et al. Prolactin induces chitotriosidase expression in human macrophages through PTK, PI3-K, and MAPK pathways. J Cell Biochem. 2009;107(5):881–889.
- Di Rosa M, Distefano G, Zorena K, et al. Chitinases and immunity: ancestral molecules with new functions. Immunobiology. 2016;221(3):399–411.
- Fusetti F, Pijning T, Kalk KH, et al. Crystal structure and carbohydrate-binding properties of the human cartilage glycoprotein-39. J Biol Chem. 2003;278(39):37753–37760.
- Sanfilippo C, Longo A, Lazzara F, et al. CHI3L1 and CHI3L2 overexpression in motor cortex and spinal cord of sALS patients. Mol Cell Neurosci. 2017;85:162–169.
- Schimpl M, Rush CL, Betou M, et al. Human YKL-39 is a pseudo-chitinase with retained chitooligosaccharide-binding properties. Biochem J. 2012;446(1):149–157.
- Areshkov PA, Kavsan VM. Chitinase 3-like protein 2 (CHI3L2, YKL-39) activates phosphorylation of extracellular signal-regulated kinases ERK1/ERK2 in human embryonic kidney (HEK293) and human glioblastoma (U87 MG) cells. Tsitol Genet. 2010;44(1):3–9.
- Li Y, Ma W, Xie C, et al. Identification of genes and signaling pathways associated with diabetic neuropathy using a weighted correlation network analysis: a consort study. Medicine (Baltimore). 2016;95(47):e5443.
- Di Rosa M, Tibullo D, Vecchio M, et al. Determination of chitinases family during osteoclastogenesis. Bone. 2014;61:55–63.
- Luciano-Mateo F, Hernandez-Aguilera A, Cabre N, et al. Nutrients in energy and one-carbon metabolism: learning from metformin users. Nutrients. 2017;9(2):121.
- Ormazabal V, Nair S, Elfeky O, et al. Association between insulin resistance and the development of cardiovascular disease. Cardiovasc Diabetol. 2018;17(1):122.
- Le KA, Mahurkar S, Alderete TL, et al. Subcutaneous adipose tissue macrophage infiltration is associated with hepatic and visceral fat deposition, hyperinsulinemia, and stimulation of NF-kappaB stress pathway. Diabetes. 2011;60(11):2802–2809.
- Spencer M, Yao-Borengasser A, Unal R, et al. Adipose tissue macrophages in insulin-resistant subjects are associated with collagen VI and fibrosis and demonstrate alternative activation. Am J Physiol Endocrinol Metab. 2010;299(6):E1016–27.
- De Ceuninck F, Marcheteau E, Berger S, et al. Assessment of some tools for the characterization of the human osteoarthritic cartilage proteome. J Biomol Tech. 2005;16(3):256–265.
- Ishii H, Tanaka H, Katoh K, et al. Characterization of infiltrating T cells and Th1/Th2-type cytokines in the synovium of patients with osteoarthritis. Osteoarthritis Cartilage. 2002;10(4):277–281.
- Min SY, Desai A, Yang Z, et al. Diverse repertoire of human adipocyte subtypes develops from transcriptionally distinct mesenchymal progenitor cells. Proc Natl Acad Sci U S A. 2019;116(36):17970–17979.
- Lindner M, Verhagen I, Viitaniemi HM, et al. Temporal changes in DNA methylation and RNA expression in a small song bird: within- and between-tissue comparisons. BMC Genomics. 2021;22(1):36.
- Turcot V, Lu Y, Highland HM, et al. Protein-altering variants associated with body mass index implicate pathways that control energy intake and expenditure in obesity. Nat Genet. 2018;50(1):26–41.
- Weidemann A, Lovas A, Rauch A, et al. Classical and alternative NF-kappaB signaling cooperate in regulating adipocyte differentiation and function. Int J Obes (Lond). 2016;40(3):452–459.
- Chamberlain JA, Dugue PA, Bassett JK, et al. Dietary intake of one-carbon metabolism nutrients and DNA methylation in peripheral blood. Am J Clin Nutr. 2018;108(3):611–621.
- Mandaviya PR, Joehanes R, Brody J, et al. Association of dietary folate and vitamin B-12 intake with genome-wide DNA methylation in blood: a large-scale epigenome-wide association analysis in 5841 individuals. Am J Clin Nutr. 2019;110(2):437–450.