
ABSTRACT
Biomedical research has grown increasingly cooperative through the sharing of consortia-level epigenetic data. Since consortia preprocess data prior to distribution, new processing pipelines can lead to different versions of the same dataset. Similarly, analytic frameworks evolve to incorporate cutting-edge methods and best practices. However, it remains unknown how different data and analytic versions alter the results of epigenome-wide analyses, which could influence the replicability of epigenetic associations. Thus, we assessed the impact of these changes using data from the Avon Longitudinal Study of Parents and Children (ALSPAC) cohort. We analysed DNA methylation from two data versions, processed using separate preprocessing and analytic pipelines, examining associations between seven childhood adversities or prenatal smoking exposure and DNA methylation at age 7. We performed two sets of analyses: (1) epigenome-wide association studies (EWAS); (2) Structured Life Course Modelling Approach (SLCMA), a two-stage method that models time-dependent effects. SLCMA results were also compared across two analytic versions. Data version changes impacted both EWAS and SLCMA analyses, yielding different associations at conventional p-value thresholds. However, the magnitude and direction of associations was generally consistent between data versions, regardless of p-values. Differences were especially apparent in analyses of childhood adversity, while smoking associations were more consistent using significance thresholds. SLCMA analytic versions similarly altered top associations, but time-dependent effects remained concordant. Alterations to data and analytic versions influenced the results of epigenome-wide analyses. Our findings highlight that magnitude and direction are better measures for replication and stability than p-value thresholds.
Introduction
Biomedical science has become increasingly cooperative over the past decade. The emergence of large datasets, combined with the small effects of biological measures on complex traits, has fuelled such cooperation, making global collaboration with researchers more important now than ever. Access to large-scale data has emphasized the importance of identifying both replicable and stable findings, both across and within research studies. As such, large consortia, including birth cohorts, have become an integral part of these collaborative efforts, generating and compiling large amounts of research data ranging from behavioural and clinical markers to molecular and genetic measures. These data are often made available to collaborators and other researchers worldwide, facilitating the interrogation of broader research questions and enabling replication efforts.
Epigenetic data are one key data type collected within these consortia. Epigenetics refer to mechanisms that can result in heritable changes to gene expression without altering genetic sequences [Citation1]. DNA methylation (DNAm) is the most common type of epigenetic mechanism measured in human studies. DNAm occurs when a methyl group is added to cytosine residues, typically in the context of cytosine-guanine dinucleotides (CpG). DNAm is both stable over time and responsive to external signals in certain genomic contexts, which highlights its potential as a biomarker and mechanism for the biological embedding of environmental factors [Citation2]. As a result, epigenome-wide association studies (EWAS) have exploded in popularity, with over 1,600 papers on EWAS published since 2015.
To facilitate the sharing of DNAm data, datasets are often processed by the individual cohorts prior to distribution. However, due to both technological and conceptual developments over time, the data available from large cohorts can become outdated, requiring the distribution of revised versions to collaborators. In addition, individuals in longitudinal studies occasionally withdraw consent to share their data, reducing the overlap of samples between different data versions. Despite these updates, researchers will sometimes continue to analyse and publish the results from previous data versions. At the same time, analytic frameworks are constantly updated and improved upon, resulting in newer cutting-edge methods and shifting analytic best practices [Citation3]. Yet, the extent to which differences in data versions and analytic pipelines lead to meaningful differences in analytic results remains unclear. This knowledge gap raises an important question as to the replicability and stability of findings, which may differ even within a single study and influence the collective interpretation of epigenome-wide associations in biomedical research.
Here, we explored the impact of changes in data versions and analytic methods on the consistency of within-cohort epigenome-wide findings (). The goal of the present study was to highlight the impact of data and analytic version changes at the cohort-level, particularly in the context of time-varying exposures to childhood adversity. To this end, we analysed two versions of epigenetic data collected from children at age 7 from the Avon Longitudinal Study of Parents and Children (ALSPAC) cohort, a longitudinal birth cohort near Bristol, England. We first characterized the difference between these versions with respect to the distributions of DNAm at the CpG- and individual-level to illuminate the discrepancies that can arise between data versions. Second, we performed two analyses to ascertain the impact of data version changes at the level of CpG associations, using classical EWAS and a more nuanced analytic method called the Structured Life Course Modelling Approach (SLCMA) [Citation4]. We performed these analyses using two different types of exposures, contrasting the results from psychosocial (childhood adversity) and physical (maternal smoking during pregnancy) exposures [Citation5,Citation6]. Finally, we compared results derived from SLCMA between two analytic versions, as more recent guidelines have emerged on its use in big data settings [Citation3]. Overall, these analyses provide insight into the reproducibility of epigenome-wide associations and highlight the features of epigenetic data that are more reproducible and robust to within-study changes, which are important considerations for future meta- and cross-cohort analyses.
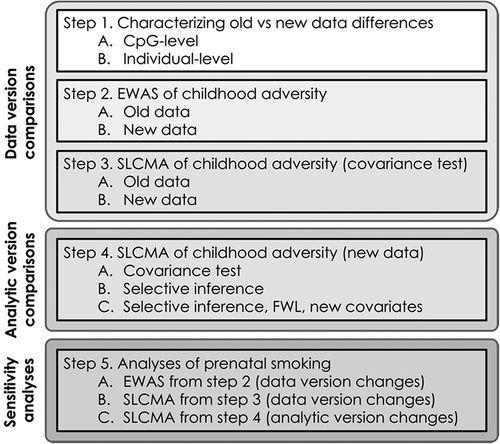
Figure 1. Overview of analyses. Steps 1–3 outline the impact of data version differences. Step 4 outlines the effect of analytic version differences. Here, childhood adversity refers to the seven different types of adversity that were assessed in these analyses. Step 5 outlines the sensitivity analyses of exposure to maternal smoking during gestation, which were performed as in steps 2–4.
Materials and methods
ALSPAC cohort
ALSPAC is a large prospective cohort study that recruited 14,541 pregnancies in Avon, UK, with expected dates of delivery between 1 April 1991 and 31 December 1992 [Citation7,Citation8]. Further details of the study and available data are provided on the study website through a fully searchable data dictionary (http://www.bris.ac.uk/alspac/researchers/data-access/data-dictionary/). Please note that the study website contains details of all the data that is available through a fully searchable data dictionary and variable search tool (http://www.bristol.ac.uk/alspac/researchers/our-data/). Ethical approval for the study was obtained from the ALSPAC Law and Ethics Committee and the Local Research Ethics Committees. Consent for biological samples has been collected in accordance with the Human Tissue Act (2004). Informed consent for the use of data collected via questionnaires and clinics was obtained from participants following the recommendations of the ALSPAC Ethics and Law Committee at the time. All data are available by request from the ALSPAC Executive Committee for researchers who meet the criteria for access to confidential data (http://www.bristol.ac.uk/alspac/researchers/access/).
Epigenetic data generation
DNAm profiles at birth, 7, and 15 years of age are part of the Accessible Resource for Integrated Epigenomic Studies (ARIES), a subsample of 1,018 mother–child pairs from the ALSPAC cohort [Citation9]. In this study, we focused on the samples collected at age 7. Briefly, DNA was extracted from peripheral blood samples according to established procedures. DNAm was then measured at 485,577 CpG sites across the genome using the Illumina Infinium Human Methylation 450 K BeadChip microarray (Illumina, San Diego, CA). We received two versions of the DNAm data, which were processed using different pipelines by ALSPAC, as described below.
Epigenetic data versions
In the first version, which we refer to as the old data (2015 version), DNAm data were processed using the pipeline developed by Touleimat and Tost [Citation9,Citation10]. This old data pipeline involved colour bias correction using a smooth quantile normalization method, background correction using negative control probes, and subset quantile normalization (SWAN) using the R-package wateRmelon [Citation11]. No loci were removed due to poor call rates. Samples with >20% of probes with a detection p-value ≥0.01 were removed due to low quality. No post hoc batch effect corrections were performed in this data version. DNAm values were expressed as beta values (i.e., values that represent % methylation at each probe). As such, DNAm values for all 485,577 CpGs were available in the old data version in 973 participants. Although these pre-processing procedures have been surpassed by newer methods in the current epigenetics literature, several key studies have recently been published using this version of the ALSPAC data release, including the first study of time-varying exposures to childhood adversity and DNAm [Citation5] and several epigenome-wide association studies (EWAS) of early-life environments [Citation12–14].
Given the evolving best practices in epigenome-wide studies [Citation15–20], the ALSPAC cohort recently released a revised version of their data to collaborators. In this second data version, which we refer to as the new data (2018 version), DNAm data were processed using the pipeline developed by Min and colleagues using the meffil R package [Citation21]. Dye bias and background correction were performed using the ‘noob’ method [Citation22], while normalization was performed using functional normalization [Citation16]. Batch effects were corrected using principal components calculated from control probes [Citation21]. In addition, samples with > 10% of CpG sites with a detection p-value >0.01 or a bead count <3 in >10% of probes were removed. As such, there were fewer CpGs (n = 482,855) and participants (n = 970) available for analysis in the new data compared to the old data ().
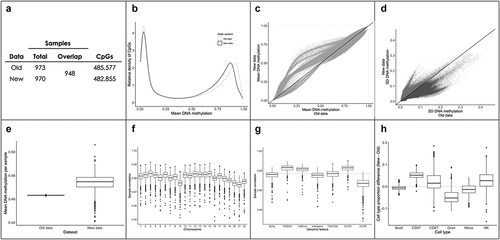
Figure 2. Differences between data versions of the ARIES cohort. (a) 948 participants overlapped between versions of the data. The new dataset had slightly less probes due to filtering procedures. (b) Both the old and the new data showed typical bimodal distributions. However, the density of genome-wide DNA methylation was shifted towards the left in the new data, suggesting that the setpoint of hypermethylated CpGs was lower in the new data. c) Mean values for each CpG were shifted towards more middling values in the new data. d) The standard deviation (SD) of each CpG was generally higher in the old data. 300,839 CpGs had higher variability in the old data (dark grey) and 182,016 CpGs had higher variability in the new data (light grey). (e) Individual-level mean DNA methylation (across all CpGs) varied substantially between data versions. The new data were highly variable, whereas the old data showed no variability between participants. (f) Individual-level DNAm data were generally highly correlated between data versions (r = 0.98, red line), with no clear biases detected for specific chromosomes. (g) Individual-level DNAm from specific genomic regions were generally highly correlated between data versions (r = 0.98, red line). However, CpGs located in 3ʹUTRs showed slightly lower correlations between datasets. (h) Estimated cell type proportions showed slight differences between the old and new datasets (differences were calculated by subtracting old data proportions from new data proportions).
Furthermore, due to data processing and potential removal of consent for some individuals, only 948 participants overlapped between both data versions (). Only singleton birth participants present in both data versions were analysed (n = 946), limiting differences between data versions to those related to DNAm values. For the current analyses, we further removed cross-hybridizing probes, polymorphic probes, as well as probes that did not overlap between both data versions. We also removed probes located in sex chromosomes, as dosage differences between males and females (i.e., differences in DNAm levels due to the number of sex chromosomes) result in misleading DNAm estimates from the 450 K array, particularly in the case of subset quantile normalization [Citation16]. These filtering steps resulted in a list of 440,257 CpGs that were present in each data version. To remove possible outliers, we winsorized the beta values at each CpG site, setting the bottom 5% and top 5% of values to the 5th and 95th quantile, respectively.
Measures of childhood adversity
We investigated seven types of childhood adversity assessed between birth and age 7: experiences of sexual/physical abuse, caregiver physical/emotional abuse, maternal psychopathology, financial stress, family instability, one-adult households, and neighbourhood disadvantage. These variables were coded the same way between both the old and new datasets. For a full description of these variables, please refer to Dunn and colleagues (2019), which described their coding in depth [Citation5].
Analyses
The code for the analyses below can be found at github.com/thedunnlab/data_differences/. Summary statistics for all CpGs and analyses are available upon request.
Global differences between data versions
To assess how the old and new ALSPAC datasets broadly differed, we performed the following analyses. We first focused on CpG-level differences, averaging DNAm values across all individuals to assess 1) the distribution of DNAm values across the epigenome; 2) the mean DNAm values for each CpG; and 3) the variability in the DNAm levels of each CpG, captured using standard deviation across individuals. Next, we assessed individual-level differences, focusing on differences in 1) mean DNAm levels across the epigenome; 2) epigenome-wide correlation in DNAm values across individuals, measured using Pearson correlations at the level of chromosomes or genomic features; 3) differences in cell type proportions estimated using the Houseman method [Citation23].
Epigenome-wide association study (EWAS) of childhood adversity
To determine how data versions can influence the results of traditional epigenome-wide methods, we performed EWAS for each of the childhood adversities described above using the old and new data versions. In these two analyses, we categorized children as ‘exposed’ or ‘unexposed’ to adversity, based on whether they experienced a given adversity between ages 0 to 7, resulting in seven separate EWAS, one for each type of childhood adversity. We performed these epigenome-wide associations using basic least squares regression in the limma package in R, using empirical Bayes to calculate standard errors [Citation24]. Childhood adversities were treated as the exposures and DNAm was treated as the outcome. Consistent with previous work on these exposures [Citation5], we included the following covariates to account for potential confounding: sex, race/ethnicity, maternal age at birth, maternal education, birth weight, number of previous pregnancies, maternal smoking during pregnancy, and cell type proportions estimated using the Houseman method [Citation23]. We accounted for multiple-testing using the Benjamini-Hochberg method and set the false discovery rate (FDR) at 5%[Citation25]. We also provide Bonferroni-adjusted results in the Supplemental Materials as sensitivity analyses. Quantile-quantile plots for the EWAS can be found in the Supplemental Materials alongside the genomic inflation factor and BACON inflation estimate [Citation26] (Fig S1).
Structured Life Course Modelling Approach (SLCMA) of childhood adversity
The SLCMA is a two-stage method that compares different life course hypotheses that describe the time-dependent relationship between different exposures and an outcome of interest [Citation27,Citation4,Citation28,Citation29]. This method simultaneously compares a set of a priori-specified life course hypotheses encoding time-varying exposure-DNAm relationships, such as the developmental timing of exposure (sensitive periods), or a cumulative count of exposures over time (accumulation of risk). Therefore, it provides more nuanced insights about exposure mechanisms beyond the traditional analyses of exposed versus unexposed individuals. Importantly, the SLCMA has been applied in multiple contexts to determine whether the timing of certain exposures can influence outcomes, including psychiatric measures and DNAm [Citation3,Citation30].
To summarize SLCMA briefly, in the first stage, variable selection (LARS-LASSO) is used to select the life course hypothesis (i.e., sensitive periods) that explains the greatest proportion of outcome variation (i.e., DNAm at a given CpG locus). In the second stage, post-selection inference is performed to obtain point estimates, confidence intervals, and p-values for the hypothesis selected from the first stage, accounting for multiple testing burden associated with testing several life course hypotheses simultaneously at each locus. Importantly, both steps are applied independently to each locus tested, identifying the time-dependent exposure best explaining DNAm variation for each locus individually and testing the significance of that relationship.
To assess the impact of data version changes on SLCMA results, we tested the association between the seven types of childhood adversity and epigenetic patterns, as previously reported by Dunn and colleagues (2019), in both data versions. Each type of adversity was analysed separately. We tested five different life course hypotheses, including three sensitive periods hypotheses encoding exposures during the following three time periods: 1) very early childhood (0–2), 2) early childhood (3–5), 3) middle childhood (6–7); and two additive hypotheses: 4) total number exposures across childhood (accumulation), and 5) number of exposures weighted by time (recency). Post-selection inference was performed using the covariance test (covTest) method [Citation31]. We adjusted for the same covariates as in the EWAS analyses and accounted for multiple-testing at the epigenome-level using the Benjamini-Hochberg method and set the FDR at 5% [Citation25]. Quantile-quantile plots for the SLCMA analyses can be found in the Supplemental Materials alongside the genomic inflation estimates (Fig S2).
Analytic version updates of the SLCMA of childhood adversity
To determine how updates to analytic versions influence the SLCMA results, we compared the results from the new data using the analysis described above, which we refer to as the standard analysis, to the latest recommendations for the SLCMA as described by Zhu and colleagues (2020), which we refer to as the updated analysis. This approach differed in three major ways. First, post-selection inference was performed using the selective inference method, which reduces p-value inflation compared to the covariance test in high dimensional analyses [Citation3,Citation32]. Second, we adjusted for covariates using the Frisch-Waugh-Lovell (FWL) theorem (partitioned regression) [Citation33]. This method has been used in penalized regression analyses and can improve the statistical power to detect differences between groups [Citation3,Citation34]. Third, we updated the covariates to reflect best practices in the ALSPAC cohort, swapping parental occupation-based social class for maternal education. Maternal education is not only a better predictor of health and DNAm patterns, but also has better availability and comparability in other birth cohorts, allowing for more direct comparisons and integration into future meta-analyses [Citation14,Citation35].
Sensitivity analyses of prenatal exposure to maternal smoking
Given that the associations between smoking and DNAm are some of the best replicated findings in the EWAS field, we performed additional sensitivity analyses to contrast this physical exposure to the psychosocial exposures described above. We assessed the impact of data versions on the association between exposure to maternal smoking during pregnancy and epigenetic patterns, as previously reported by Richmond and colleagues (2018). Following the same approach as the analyses of childhood adversity, we performed an EWAS of prenatal exposure to maternal smoking in the old and new data versions. Maternal smoking exposure was ascertained repeatedly in all three trimesters, wherein smoking at any point was considered prenatal smoking exposure [Citation6]. For the SLCMA analysis, we tested five separate life course hypotheses of prenatal smoking exposure: first trimester, second trimester, third trimester, accumulation across all trimesters, and recency of exposure. We included the following covariates in these analyses, as previously described [Citation5]: sex, race/ethnicity, maternal age at birth, maternal education, birth weight, number of previous pregnancies, and cell type proportions.
Results
Old and new versions of the ALSPAC data differed by several key descriptive features
We first assessed the CpG- and individual-level differences between the ALSPAC data normalized using the Tost pipeline (old) and the meffil pipeline (new). The genome-wide distribution of DNAm values from the old data was generally shifted towards the centre in the new data (). CpG-level variability, assessed by the standard deviation of each CpG, was generally higher in the old data (). In addition, we detected higher individual-level variability (across all CpGs) in the new data than in the old data, which showed no individual-level variability due to the use of quantile normalization (). Nevertheless, individual-level data were generally highly correlated between data versions (mean r = 0.981, SD = 0.003), with no clear biases being detected in specific chromosomes (). However, CpGs located in 3'UTRs showed slightly lower correlations between versions (). Estimated cell-type proportions showed only slight differences between data versions but were mostly similar ().
Epigenome-wide association study results differed between data versions
To determine how data versions may impact the results from traditional EWAS, we analysed the association between exposure to each of the seven childhood adversities and DNAm at age 7 in both DNAm data versions (i.e., seven separate EWAS per data version). Overall, we found little concordance between data versions for psychosocial exposures using significance thresholds. In the old data, we identified one CpG at an FDR <0.05 for the abuse exposure but no significant associations for the other adversities. This CpG also passed a Bonferroni-corrected threshold of p < 1.13x10⁻⁷. By contrast, using the new data, we identified no CpGs at an FDR<0.05, though one was associated with exposure to financial stress at an FDR<0.1. There were no overlaps between the old and new data versions (). Indeed, beyond significance thresholds, the overlap of CpGs by p-value rank was somewhat low for most adversities (10–40%) but remained higher than by random chance ().
Figure 3. Updates to data versions change the results of epigenetic analyses, for both EWAS and SLCMA. (a) Overlap of the hits at FDR<0.05 between the old and new data for all seven different EWAS of childhood adversity. (b) Few CpGs overlapped between the old and new data versions at different p-value rank thresholds (top 10, 50, 100, 1000, 5000, and 50,000 CpGs ranked by p-value). (c) The Spearman’s rank correlation between CpGs (in old versus new data) that overlapped at a given rank (i.e., top N CpGs ordered by p-value) was relatively low across both data versions. (d) The direction of DNAm differences between exposed/unexposed groups was generally consistent across overlapping CpGs at a given rank (i.e., top CpGs ranked by p-value). (e) Overlap of the hits at FDR<0.05 between the old and new data for all seven different SLCMA of childhood adversity. (f) Both the hypotheses selected most frequently, and the adversities identified as having the most hits varied between data versions with the SLCMA for CpGs significant at FDR<0.05. (g) The selected hypothesis from all top hits (shown in E) were generally consistent across data versions. Each line depicted corresponds to a specific CpG and shows whether its selected hypothesis differed between analyses. (h) The difference in DNAm values between exposed and unexposed participants across all top SLCMA hits from E was generally consistent between data versions, regardless of statistical significance (r = 0.854). Only shown here are the CpGs associated with sensitive period hypotheses, as the difference between exposed and unexposed individuals was not calculated for the accumulation and recency hypotheses.
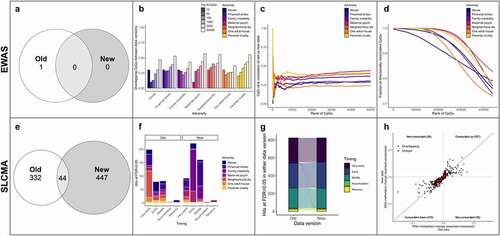
However, for each set of top CpGs (ranked by p-values), those that overlapped between data versions showed relatively good rank correlation, suggesting that some signal may be retained between data versions (). Importantly, CpGs also showed >80% concordance in the direction and magnitude of differences in DNAm between exposed and unexposed groups across almost the entire epigenome (). As such, it appeared that the differences introduced by changing data versions caused fluctuations in the results at the level of p-value thresholds, but the results from the EWAS of childhood adversity were more similar when considering p-value ranks. Importantly, the direction and magnitude of associations was highly concordant between data versions, suggesting they may be more stable indicators of within-study reproducibility relative to p-values.
Data versions also changed the results from the SLCMA
To determine how data versions can influence more sensitive or complex methods beyond an EWAS, we assessed the impact of data versions on the SLCMA results. Here, we identified 376 CpGs in the old data and 491 CpGs in the new data at an FDR<0.05 across all seven adversities, with 44 CpGs overlapping between data versions (; ; Tables S3, S4). The most selected hypotheses for significant CpGs were different between data versions (), as were the adversities with the most hits (). The old data showed more associations with very early childhood and neighbourhood disadvantage, whereas the new data showed more associations with early childhood and financial stress. However, significant CpGs generally had the same hypothesis selected across data versions, with little changes in the CpGs significant in the analyses of both versions (). In addition, top hits generally showed the same direction of change and similar magnitude between data versions (r = 0.85) (). Of note, when we instead used a Bonferroni-corrected p < 1.13x10⁻⁷, we found almost identical results to the results using FDR thresholds albeit with fewer significant loci (Table S1; Fig S3). The use of this more stringent threshold resulted in a slightly larger fraction of replicated CpGs (9.6%) compared to the FDR threshold (5.3%), as well as a slightly higher correlation in the effect sizes (r = 0.92 versus 0.85). These results highlight the brittleness of p-value thresholds, which result in few overlaps between data versions, despite the general characteristics of these CpGs and their associations being similar between data versions. These results also suggest that the magnitude of effects and hypothesis selected are more robust to differences between data versions.
Table 1. Summary of analyses and significant CpGs.
Analytic versions altered the results from the SLCMA of childhood adversity
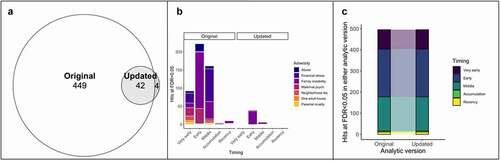
Finally, we assessed the impact of updates to analytic versions on the results from SLCMA, as per the recommendations of Zhu and colleagues (2020) using only the new data version. We first performed the SLCMA analyses of childhood adversity and DNAm with the standard covariates and adjustment strategy but using the selective inference method in the second stage, rather than the covariance test. However, only one CpG was significant at an FDR<0.05 in this analysis. We then performed a comparison between the standard analytic version and the fully updated pipeline, which used FWL correction and updated covariates. We identified 46 CpGs at an FDR<0.05 in this updated analysis, with 42 overlapping with results from the original pipeline in the new dataset (; Table S5). The majority of significant CpGs in this new analysis were associated with early childhood exposure to family instability, a pattern that differed slightly from the standard version of the analysis in the new data (; ). Again, when we used a more stringent Bonferroni-corrected p < 1.13x10⁻⁷ (Fig S4), we found slightly higher proportions of replicated CpGs (10.6%) compared to those identified using an FDR<0.05 threshold (8.4% of CpGs replicated). All significant CpGs between analytic versions showed the same hypothesis selected (). Changes in analytic versions did not impact the magnitude of DNAm changes. These results suggested that the reduction in power of the selective inference method can potentially be offset by using the FWL theorem and that updates to covariates only cause minor changes to the results. We also note that 3 CpGs overlapped between all analyses (old data with standard analysis; new data with standard analysis; new data with updated analysis), representing the associations that survived technical replication across both data and analytic versions (Table S6).
Figure 4. Updates to analytic versions change the results of SLCMA in the new data version. (a) Overlap of the hits at FDR<0.05 for all seven different SLCMA of adversity between the standard and updated analytic versions (analyses performed with the new data). (b) The pattern of hypotheses selected were similar across both analytic versions, though not all adversities had statistically significant associations in the updated analytic version. (c) The hypothesis selected across all significant CpGs from A was consistent across analytic versions.
Sensitivity analyses of prenatal smoke exposure showed similar results to psychosocial exposures
To determine whether the impact of data and analytic version changes were limited to psychosocial exposures, we performed secondary analyses of prenatal smoking exposure (Supplemental Materials; Table S2). While the EWAS of smoking showed more overlap and consistency between data versions than psychosocial exposures (Fig S5; Table S7), we again observed differences in terms of overall concordance at the level of p-values and magnitude of change. In particular, the direction of DNAm change between exposed and unexposed individuals showed very high concordance between data versions (r = 0.92). Of note, using a Bonferroni-corrected threshold did not result in higher replicability of top smoking loci between data versions (70% of CpGs) compared to the FDR threshold (67% of CpGs). These results suggested that p-value thresholds remain relatively arbitrary, even with ‘gold-standard’ epigenetic associations. Our secondary analysis of prenatal smoking exposure using the SLCMA also found some overlapping CpGs at an FDR<0.05 and major changes to selected hypotheses between data versions (Fig S6; Tables S3-S5). These results persisted even when using a Bonferroni-corrected p < 1.13x10⁻⁷ (Fig S7). These findings further suggest that SLCMA was more sensitive to fluctuations between data versions than EWAS, particularly during the second step of the approach when significance was assessed. Despite changes in the selected hypothesis and strength of associations measured through p-values, we continued to observe a high concordance at the level of effect sizes (r = 0.79), again highlighting their higher stability in analyses of time-varying exposures. We also found few overlaps between the standard and updated analytic versions of the SLCMA of prenatal smoking, suggesting that updates to covariates may have different effects on the results from SLCMA depending on analysis-specific confounding structures, since these effects were not observed with the childhood adversity analyses (Fig S6).
Discussion
A major challenge in conducting epigenetic analyses centres around the replicability of findings across cohorts, particularly when standard practices are constantly evolving. In this study, we quantified the consequences of data and analytic version differences, showing that even within the same dataset, updates to preprocessing pipelines and analytic frameworks altered the DNAm loci that were associated with psychosocial and physical exposures at standard p-value significance thresholds. However, the developmental timing of exposures and magnitude of differences at these loci tended to remain the same, suggesting these metrics may be better indicators than p-values of within-cohort replication, particularly in studies of time-varying exposures.
The major differences between the data versions arose from two main sources: 1) individuals added or removed from the analyses due to preprocessing and withdrawal of consent and 2) changes to the preprocessing pipeline for DNAm data. Although we accounted for this first factor by only analysing overlapping samples, we found broad differences in both CpG-level and individual-level DNAm patterns that therefore must be caused by preprocessing differences. One particularly striking difference was observed at the individual level, wherein the new dataset showed increased variability across individuals due to the use of functional normalization, rather than quantile normalization in the old dataset. Such normalization techniques provide a major technical and conceptual difference in the preprocessing of DNAm data, as quantile normalization assumes that all individual samples have identical distributions of DNAm across the genome [Citation36]. We make note of these differences in DNAm variance between normalization methods, as recent studies have begun to assess the impact of environmental exposures and disease on changes in DNAm variability, rather than mean differences [Citation37–39]. As such, particular care should be taken in these types of analyses, as they may be more sensitive to differences arising due to changes in data version and processing procedures. Bulk differences between data versions were also apparent at the level of estimated cell-type proportions. Given that cell types are estimated from the DNAm data, they may reflect broader differences between data versions, which may, in turn, broadly influence the results of epigenetic analyses. Overall, no single facet of the data fully reflected the changes between datasets, suggesting that a combination of sample differences and normalization techniques likely leads to different results between versions.
It is perhaps unsurprising that updates to data versions resulted in broad changes to the results of both our EWAS and SLCMA of psychosocial exposures. Although these exposures may have subtler effects on the epigenome, we found little reproducibility at the level of p-value thresholds and ranking, which were apparent even when using more stringent p-value thresholds. By contrast, the magnitude of change between exposed and unexposed individuals was highly reproducible across all CpGs in both types of analyses. For the SLCMA, we also found that hypothesis selection was stable across data versions (i.e., the first stage of SLCMA), but p-values obtained from post-selection inference were different (i.e., the second stage of SLCMA), further highlighting the potential of effect estimates and hypothesis selection metrics to serve as benchmarks for replication. These findings also emphasize the fragility of inference based on p-values across our analyses. Numerous recent reports have already urged the scientific community to move away from p-values as a measure of significance and reproducibility since p-values can be less than informative and sometimes misleading [Citation40–43]. In particular, the American Statistical Association recently outlined six important principles to avoid the misuse of p-values in scientific analyses [Citation44]. They note that p-values are not a good measure of evidence on their own, nor do they measure the size or importance of an effect. Our results show these statements hold true in epigenome-wide analyses. Building from our findings and prior recommendations, we urge researchers to supplement standard analyses (e.g., reporting of p-values) with metrics that provide additional insight into the reproducibility and strength of associations, such as their magnitude and direction of effect, and allow for better understanding of both mean and variance differences within a sample [Citation45].
When we updated the SLCMA analytic version, we observed a not only a loss of p-value significance for several CpGs, but also several new associations, which were independent of changes in the magnitude of effects or hypothesis selection. Given that we changed three main factors between analytic versions, there are at least three possible causes for these observed differences. First, selective inference is more stringent than the covariance test, which can produce inappropriately small p-values [Citation3]. This initial difference resulted in a total loss of FDR-significant CpGs, without any changes to the magnitude of associations, thus explaining the reduction in the number of significant CpGs. Second, the application of the FWL theorem alongside selective inference resulted in more FDR-significant CpGs. However, since the FWL theorem improves statistical power without influencing the effect estimates of associations [Citation3], no new associations should arise from its application in the updated analytic version, which would explain the overlapping FDR-significant CpGs between the standard and updated analytic versions. Thus, the third difference – updates to covariates in the statistical model – is likely responsible for the emergence of four new FDR-significant CpGs in the SLCMA of psychosocial exposures. Although these differences were minor, they reflect the potential effect of moving towards more appropriate covariates in epigenome-wide analyses, such as the use of maternal education rather than occupation-based social class in the ALSPAC cohort. This result is contrasted by the secondary analyses of prenatal smoking, where changes to covariates greatly influenced the results of the analyses, highlighting that careful consideration of potential confounding is required for different types of exposures.
In contrast to the analyses of psychosocial exposures, the EWAS of prenatal smoking, a physical exposure, was more reproducible when using p-value thresholds, as well as the magnitude of effects. This finding was expected considering that cigarette smoke has the most reproduced findings from epigenome-wide studies [Citation46,Citation47]. However, the overall ranking and overlap of CpGs beyond FDR-significance remained relatively low in the EWAS, resulting in similar levels as psychosocial exposures across the top 5,000 CpGs. These results could potentially highlight the mechanisms by which such exposures become biologically embedded. Whereas smoking exposure not only has well defined, but also targeted cellular processes (i.e., implicated pathways that clear toxins from the organism), psychosocial exposures may have more systemic influences, impacting a broader set of CpGs with smaller effects [Citation48,Citation49]. In addition, it is possible that psychosocial exposures may have greater influences on the central nervous system, rather than peripheral tissues, resulting in more moderate signals from blood samples [Citation50]. Of note, SLCMA analyses of smoking were not well reproduced across data and analytic versions. Although these results may be due to a variety of factors, a potential explanation is that smoking may not be a time-dependent exposure. Life course modelling approaches lose power when hypotheses are highly correlated, reducing their ability to make statistical inferences [Citation29]. As such, these broad differences between versions may indicate that the SLCMA is not appropriate for an exposure such as prenatal smoking, which may influence epigenetic patterns equally throughout development.
The inevitable fluctuations in epigenome-wide associations highlight the importance of tracking data and analytic versions across epigenetic analyses to improve both the reproducibility and replicability of findings. As a field, we should endeavour to use the most up-to-date data versions and analytic models before performing analyses. This approach is particularly relevant for subtler exposures, such as childhood adversity, where the epigenetic signal may require more nuanced methods due to limited sample sizes. Our investigation has shown the benefit of comparing data and analytic versions in a stepwise manner (i.e., the observed differences in results can be explained step by step). Moving beyond p-values as a single metric for significance appears to be a necessary first step towards replicability, but p-values remain an important feature of biomedical research [Citation43]. We propose that researchers consistently report the magnitude and direction of effects alongside p-values to provide insight into their findings. Furthermore, as CpGs tend to be highly correlated, more nuanced approaches that go beyond statistical and effect size cut-offs can be used to gain broader insight into the biological mechanisms influenced by a given exposure or disease. Such methods include those assessing differentially methylated or co-methylated regions [Citation51,Citation52], or genome-wide effects, such as WGCNA and other network analyses [Citation53]. Of note, a recent study of autosomal sex-specific DNAm patterns showed that co-methylated regions were more highly replicated across different cohorts than individual loci [Citation54], suggesting they may be less sensitive to variation caused by data or analytic version differences. As such, future studies should investigate whether region-based analyses of DNAm may be better suited to replication and large-scale analyses of the epigenome.
This study was not without its limitations. First, we removed sex chromosomes from our analyses to facilitate comparisons between data versions, as quantile normalization is not appropriate for the normalization of DNAm values from chromosome X or Y. As such, we may have missed differences emerging on sex chromosomes and potential sex-specific effects of early-life exposures. Second, the normalization methods used in the present study only compared two of the current methods in use, though we note that the direct comparison of normalization approaches was not the main goal of our study. Indeed, most current EWAS compare methods to establish robustness checks of their results. However, these sensitivity analyses are often unfeasible for consortia-level results. Furthermore, results from the old ALSPAC data version may not reflect more recent approaches to process DNAm data and, as such, these initial analyses might not have identified the most robust and reproducible set of CpGs. Our findings further highlight the importance of rerunning analyses with current best practices for DNAm normalization and processing, which have been outlined in several publications demonstrating the strengths and limitations of different processing approaches [Citation55]. Overall, our findings suggest that careful attention must be paid to normalization methods when attempting to replicate results that are based on previous data versions. Third, an important limitation of current population-based epigenetic studies is often a sole focus on DNAm , with little consideration of other DNA modifications. For instance, DNA hydroxymethylation (DNAhm) has emerged as an important epigenetic modification, particularly in neural tissues, and cannot be distinguished from DNAm using traditional bisulphite conversion [Citation56–58]. As DNAhm and DNAm have different biological functions [Citation59], future studies should further seek to disentangle their relative contributions to human health and disease. Finally, our sample size, although one of the largest available for longitudinal studies of childhood adversity and DNAm, was relatively small in relation to current large-scale EWAS for smoking and health-related behaviours, which likely influenced our ability to detect significant associations. This limitation was particularly apparent in the EWAS of childhood adversities, which only detected one association across both data versions. This lower sample size may have also decreased the stability of p-values between data versions, leading to fewer overlapping associations with psychosocial exposures, which tend to have more subtle effects on the epigenome. Although it is possible that larger samples or meta-analyses might be required to overcome the instability of p-values, our findings further point to p-values as brittle thresholds for identifying loci of interest. Of note, recent studies have shown that meta-analyses of epigenetic data may be less influenced by normalization procedures, especially for exposures with larger effect sizes, such as age, smoking, and body mass index [Citation60,Citation61]. However, it remains unclear whether exposures with subtler effects might have similar patterns. Similarly, no meta-analyses of time-varying exposures have been completed thus far, limiting our ability to infer adequate benchmarks for replication. Despite these limitations, our findings point to higher stability of effect estimates and hypotheses selected compared to p-value threshold-based decisions, suggesting they might be better suited to replication and meta-analyses for exposures with more subtle effects on the epigenome. As such, we suggest that these two metrics should be considered as one of the standards by which we judge the reproducibility of studies of time-dependent exposures and DNAm.
Conclusions
Changes to both data and analytic versions do impact results derived from epigenome-wide studies using both traditional and more nuanced methods that incorporate time-varying exposures. As differences not only depend on the robustness of associations, but also nuances and complexities of the analyses, our results highlight the challenges in making direct comparisons to results that originate from different versions of the same dataset, stressing the importance of transparency in reporting these differences. Finally, our results underscore the fragility of p-values as metrics for replication, instead pointing to effect sizes and the timing of exposures as potential targets for replication.
Supplemental Material
Download Zip (5.7 MB)Acknowledgments
This work was supported by the National Institute of Mental Health of the National Institutes of Health (grant number R01MH113930 awarded to ECD). The content is solely the responsibility of the authors and does not necessarily represent the official views of the National Institutes of Health. Dr. Dunn and Dr. Lussier were also supported by a grant from One Mind. We are extremely grateful to all the families who took part in the ALSPAC study, the midwives for their help in recruiting them, and the whole ALSPAC team, which includes interviewers, computer and laboratory technicians, clerical workers, research scientists, volunteers, managers, receptionists and nurses. The UK Medical Research Council and Wellcome (Grant ref: 217065/Z/19/Z) and the University of Bristol provide core support for ALSPAC. A comprehensive list of grants funding is available on the ALSPAC website (http://www.bristol.ac.uk/alspac/external/documents/grant-acknowledgements.pdf); This research was specifically funded by grants from the BBSRC (BBI025751/1; BB/I025263/1), IEU (MC_UU_12013/1; MC_UU_12013/2; MC_UU_12013/8), National Institute of Child and Human Development (R01HD068437), NIH (5RO1AI121226-02), and CONTAMED EU (212502). This publication is the work of the authors, whom will serve as guarantors for the contents of this paper.
Dr. Walton is funded by CLOSER, whose mission is to maximise the use, value and impact of longitudinal studies. CLOSER was funded by the Economic and Social Research Council (ESRC) and the Medical Research Council (MRC) between 2012 and 2017. Its initial five-year grant has since been extended to March 2021 by the ESRC (grant reference: ES/K000357/1). The funders took no role in the design, execution, analysis or interpretation of the data or in the writing up of the findings. www.closer.ac.uk. Dr. Walton is also supported by the European Union’s Horizon 2020 research and innovation programme (grant n° 848158).
Disclosure statement
No potential conflict of interest was reported by the author(s).
Data availability statement
Supplementary material
Supplemental data for this article can be accessed here.
Additional information
Funding
Related Research Data
References
- Petronis A. Epigenetics as a unifying principle in the aetiology of complex traits and diseases. Nature. 2010;465(7299):721–727.
- Boyce WT, Kobor MS. Development and the epigenome: the ‘synapse’ of gene-environment interplay. Dev Sci. 2015;18:1–23.
- Zhu Y, Simpkin AJ, AJ, Suderman, MJ, et al. A structured approach to evaluating life course hypotheses: moving beyond analyses of exposed versus unexposed in the omics context. Am J Epidemiol. 2020. DOI:10.1093/aje/kwaa246.
- Mishra G, Nitsch D, Black S, et al. A structured approach to modelling the effects of binary exposure variables over the life course. Int J Epidemiol. 2009;38:528–537.
- Dunn EC, Soare TW, Zhu Y, et al. sensitive periods for the effect of childhood adversity on dna methylation: results from a prospective, longitudinal study. Biol Psychiatry. 2019;85:838–849.
- Richmond RC, Suderman M, Langdon R, et al. DNA methylation as a marker for prenatal smoke exposure in adults. Int J Epidemiol. 2018;47:1120–1130.
- Fraser A, Macdonald-Wallis C, Tilling K, et al. Cohort profile: the Avon Longitudinal Study of Parents and Children: ALSPAC mothers cohort. Int J Epidemiol. 2013;42:97–110.
- Boyd A, Golding J, Macleod J, et al. Cohort profile: the ‘children of the 90s’–the index offspring of the Avon Longitudinal Study of Parents and Children. Int J Epidemiol. 2013;42:111–127.
- Relton CL, Gaunt T, McArdle W, et al. Data resource profile: accessible resource for integrated epigenomic studies (ARIES). Int J Epidemiol. 2015;44:1181–1190.
- Touleimat N, Tost J. Complete pipeline for infiniu ®Human Methylation 450k BeadChip data processing using subset quantile normalization for accurate DNA methylation estimation. Epigenomics. 2012;4(3):325–341.
- Maksimovic J, Gordon L, Oshlack ASWAN. Subset-quantile within array normalization for illumina infinium HumanMethylation450 BeadChips. Genome Biol. 2012;13(6):R44.
- Hartwig FP, Davey Smith G, Simpkin AJ, et al. Association between breastfeeding and DNA methylation over the life course: findings from the Avon Longitudinal Study of Parents and Children (ALSPAC). Nutrients. 2020;12:3309.
- Robinson N, Brown H, Antoun E, et al. Childhood DNA methylation as a marker of early life rapid weight gain and subsequent overweight. Clin Epigenetics. 2021;13:8.
- Alfano R, Guida F, Galobardes B, et al. Socioeconomic position during pregnancy and DNA methylation signatures at three stages across early life: epigenome-wide association studies in the ALSPAC birth cohort. Int J Epidemiol. 2019;48:30–44.
- Teschendorff AE, Marabita F, Lechner M, et al. A beta-mixture quantile normalization method for correcting probe design bias in Illumina Infinium 450 k DNA methylation data. Bioinformatics. 2013;29:189–196.
- Fortin J-P, Labbe A, Lemire M, et al. Functional normalization of 450k methylation array data improves replication in large cancer studies. Genome Biol. 2014;15:503.
- Heiss JA, Brenner H. Between-array normalization for 450K data. Front Genet. 2015;6. DOI:10.3389/fgene.2015.00092.
- Cazaly E, Thomson R, Marthick JR, et al. Comparison of pre-processing methodologies for Illumina 450k methylation array data in familial analyses. Clin Epigenetics. 2016;8:75.
- Fortin J-P, Triche TJ Jr., Hansen KD. Preprocessing, normalization and integration of the illumina humanmethylationEPIC array with minfi. Bioinformatics. 2017;33:558–560.
- Vanderlinden LA, Johnson RK, Carry PM, et al. An effective processing pipeline for harmonizing DNA methylation data from Illumina’s 450K and EPIC platforms for epidemiological studies. BMC Res Notes. 2021;14:352.
- Min JL, Hemani G, Davey Smith G, et al. Meffil: efficient normalization and analysis of very large DNA methylation datasets. Bioinformatics. 2018;34:3983–3989.
- Triche TJ Jr., Weisenberger DJ, Van Den Berg D, et al. Low-level processing of illumina infinium DNA methylation BeadArrays. Nucleic Acids Res. 2013;41:e90–e90.
- Houseman EA, Molitor J, Marsit CJ. Reference-free cell mixture adjustments in analysis of DNA methylation data. Bioinformatics. 2014;30:1431–1439.
- Smyth GK. limma: Linear Models for Microarray Data. In Robert Gentleman, Vincent J. Carey, Wolfgang Huber, Rafael A. Irizarry, Sandrine Dudoit (eds)., Bioinformatics and computational biology solutions using R and bioconductor. Springer. 2005. p. 397–420. https://link.springer.com/chapter/10.1007/0-387-29362-0_23.
- Benjamini Y, Hochberg Y. Controlling the false discovery rate: a practical and powerful approach to multiple testing. J R Stat Soc Series B Stat Methodol. 1995;57:289–300.
- van Iterson M, van Zwet EW, Heijmans BT, et al. Controlling bias and inflation in epigenome- and transcriptome-wide association studies using the empirical null distribution. Genome Biol. 2017;18:19.
- Smith, B.J., Smith, A.D.A.C., Dunn, E.C.et al (in press) Statistical Modeling of Sensitive Period Effects Using the Structured Life Course Modeling Approach (SLCMA). In Geyer, M.A., and Marsden, C.A. (Eds.) Current Topics in Behavioral Neurosciences. Springer Nature.
- Smith ADAC, Hardy R, Heron J, et al. A structured approach to hypotheses involving continuous exposures over the life course. Int J Epidemiol. 2016. DOI:10.1093/ije/dyw164.
- Smith ADAC, Heron J, Mishra G, et al. Model selection of the effect of binary exposures over the life course. Epidemiology. 2015;26:719–726.
- Dunn EC, Soare TW, Raffeld MR, et al. What life course theoretical models best explain the relationship between exposure to childhood adversity and psychopathology symptoms: recency, accumulation, or sensitive periods? Psychological Medicine. 2018;48(15):2562–2572.
- Lockhart R, Taylor J, Tibshirani RJ, et al. A significance test for the lasso. Ann Stat. 2014;42:413–468.
- Tibshirani RJ, Taylor J, Lockhart R, et al. Exact post-selection inference for sequential regression procedures. J Am Stat Assoc. 2016;111:600–620.
- Frisch R, Waugh VF. Partial time regressions as compared with individual trends. Econometrica. 1933;1:387.
- Yamada H. The Frisch–Waugh–Lovell theorem for the lasso and the ridge regression. Commun Stat Theory Methods. 2017;46:10897–10902.
- Kramer MS, Séguin L, Lydon J, et al. Socio-economic disparities in pregnancy outcome: why do the poor fare so poorly? Paediatr Perinat Epidemiol. 2000;14:194–210.
- Wu Z, Aryee MJ. Subset quantile normalization using negative control features. J Comput Biol. 2010;17:1385–1395.
- Islam SA, Goodman SJ, MacIsaac JL, et al. Integration of DNA methylation patterns and genetic variation in human pediatric tissues help inform EWAS design and interpretation. Epigenetics Chromatin. 2019;12:1.
- Paul DS, Teschendorff AE, Dang MAN, et al. Increased DNA methylation variability in type 1 diabetes across three immune effector cell types. Nat Commun. 2016;7:13555.
- Garg P, Joshi RS, Watson C, et al. A survey of inter-individual variation in DNA methylation identifies environmentally responsive co-regulated networks of epigenetic variation in the human genome. PLoS Genet. 2018;14:e1007707.
- Huak CY. Are you a p-value worshipper? Eur J Dent. 2009;3:161–164.
- Jones D, Matloff N. Statistical hypothesis testing in biology: a contradiction in terms. J Econ Entomol. 1986;79:1156–1160.
- Sterne JA, Davey Smith G. Sifting the evidence-what’s wrong with significance tests? Bmj. 2001;322:226–231.
- Wasserstein RL, Schirm AL, Lazar NA. Moving to a world beyond “p < 0.05.” Am Stat. 2019;73:1–19.
- Wasserstein RL, Lazar NA. The ASA statement on p-values: context, process, and purpose. Am Stat. 2016;70:129–133.
- Staley JR, Windmeijer, F., Suderman, M. et al. A robust mean and variance test with application to high-dimensional phenotypes. Eur J Epidemiol, (2021). https://doi.org/10.1007/s10654-021-00805-w
- Kaur G, Begum R, Thota S, et al. A systematic review of smoking-related epigenetic alterations. Arch Toxicol. 2019;93:2715–2740.
- Silva CP, and Kamens HM. Cigarette smoke-induced alterations in blood: A review of research on DNA methylation and gene expression. Exp Clin Psychopharmacol. 2021;29(1):116–135. doi:10.1037/pha0000382.
- Cecil CAM, Zhang Y, Nolte T. Childhood maltreatment and DNA methylation: a systematic review. Neurosci Biobehav Rev. 2020;112:392–409.
- Smith AK, Kilaru V, Klengel T, et al. DNA extracted from saliva for methylation studies of psychiatric traits: evidence tissue specificity and relatedness to brain. Am J Med Genet B Neuropsychiatr Genet. 2015;168:36–44.
- Dudek KA, Kaufmann FN, Lavoie O, et al. Central and peripheral stress-induced epigenetic mechanisms of resilience. Curr Opin Psychiatry. 2021;34:1–9.
- Gatev E, Gladish N, Mostafavi S, et al. DNA methylation array data analysis for co-methylated regions. Bioinformatics. 2020;36:2675–2683.
- Peters TJ, Buckley MJ, Statham AL, et al. De novo identification of differentially methylated regions in the human genome. Epigenetics Chromatin. 2015;8:6.
- Langfelder P, Horvath S. WGCNA: an R package for weighted correlation network analysis. BMC Bioinformatics. 2008;9:559.
- Gatev E, Inkster AM, Negri GL, Konwar C, et al. Autosomal sex-associated co-methylated regions predict biological sex from DNA methylation. Nucleic Acid Res. 2021;49(16):9097–9116. doi: 10.1093/nar/gkab682.
- Liu J, Siegmund KD. An evaluation of processing methods for HumanMethylation450 BeadChip data. BMC Genomics. 2016;17:469.
- Spiers H, Hannon E, Schalkwyk L, et al. Biorxiv. Cold Spring Harbor Labs Journals; 2017.
- Kriaucionis S, and Heintz N. The nuclear DNA base 5-hydroxymethylcytosine is present in Purkinje neurons and the brain. Science. 2009;324(5929):929–930. doi: 10.1126/science.1169786.
- Wen L, Tang F. Genomic distribution and possible functions of DNA hydroxymethylation in the brain. Genomics. 2014;104:341–346.
- Greenberg MVC, Bourc’his D. The diverse roles of DNA methylation in mammalian development and disease. Nat Rev Mol Cell Biol. 2019;20:590–607.
- van Rooij J, Mandaviya PR, Claringbould A, et al. Evaluation of commonly used analysis strategies for epigenome- and transcriptome-wide association studies through replication of large-scale population studies. Genome Biol. 2019;20:235.
- Joubert BR, Felix J, Yousefi P, et al. DNA methylation in newborns and maternal smoking in pregnancy: genome-wide consortium meta-analysis. Am J Hum Genet. 2016;98:680–696.