
ABSTRACT
Background Transcriptional correlation networks derived from publicly available gene expression microarrays have been previously shown to be predictive of known gene functions, but less is known about the predictive capacity of correlated DNA methylation at CpG sites. Guilt-by-association co-expression methods can adapted for use with DNA methylation when a representative methylation value is created for each gene. We examine how methylation compares to expression in predicting Gene Ontology terms using both co-methylation and traditional machine learning approaches across different types of representative methylation values per gene. Methods We perform guilt-by-association gene function prediction with a suite of models called Methylation Array Network Analysis, using a network of correlated methylation values derived from over 24,000 samples. In generating the correlation matrix, the performance of different methods of collapsing probe-level data effect on the resulting gene function predictions was compared, along with the use of different regions surrounding the gene of interest. Results Using mean comethylation of a given gene to its annotated term had an overall highest prediction macro-AUC of 0.60 using mean gene body methylation, across all Gene Ontology terms. This was increased using the logistic regression approach with the highest macro-AUC of 0.82 using mean gene body methylation, compared to the naive predictor of 0.72. Conclusion Genes correlated in their methylation state are functionally related. Genes clustered in co-methylation space were enriched for chromatin state, PRC2, immune response, and development-related terms.
Background
Coregulatory modules in DNA methylation are often investigated as a means of identifying methylation-based disease signatures, using network analysis tools like weighted gene co-expression network analysis [Citation2]. Guilt-by-association (GBA) [Citation3,Citation4] is an approach that hypothesizes genes that are highly correlated in their changes across experimental conditions are those most likely to be related to each other in some aspect of biological relevance (e.g., phenotype creation, disease risk, pathway). Clusters of genes highly correlated in their methylation status were shown to be associated with disease states [Citation2,Citation5–7]. These methods, as extensions of methods previously applied to gene expression, have revealed that DNA methylation clusters into regulatory modules associated with regulation of transcription and nucleosome formation, as well as development and differentiation. However, while GBA is a frequently used method for identifying relationships between genes [Citation8–10], it has not been applied to DNA co-methylation networks to predict gene function. DNA methylation has been shown to be associated with age and development [Citation11–13], and methylation within promoter regions is associated with gene expression, with Lokk et al. reporting a Pearson’s correlation of greater than 0.5 for 1,713 of the 10,120 tested genes [Citation14,Citation15]. Together, this suggests the application of a GBA predictive model to gene-centric DNA methylation correlations may yield new insight into the coregulatory relationships between genes.
However, several things are not yet known. Since promoter DNA methylation is correlated with gene expression, it may be the case that a GBA model of promoter methylation will simply recapitulate the information about coregulation seen in the gene expression models. Another consideration is whether representing DNA methylation as a singular value for each gene locus will result in effective predictions. In this paper, we will address both of these concerns in the characterization of the DNA methylation gene function prediction models.
DNA methylation is an epigenetic mark of intense study for its distinctive profiles and potential regulatory role across developmental stages, tissue, and health-related factors like smoking and diet [Citation16–18]. DNA methylation sequencing and methylation microarrays are abundant in public data repositories as investigators profile their disease or tissue of interest with methylation sequencing or microarrays [Citation19–21]. The publication of the Horvath clock model, the most accurate age prediction model based on DNA methylation, has spurred on many following studies on the relationship between methylation, ageing, and age-related disease [Citation11]. DNA methylation profiles in cancer have also been leveraged to develop accurate cancer classification models, even outperforming clinical histology in the case of central nervous system tumours [Citation22–25]. Notable here is that these models have performed better than similar attempts using gene expression on the same task, highlighting a differential in the ability to extract biologically meaningful information between these two data types. Because of this, many studies have performed DNA methylation modifications in a targeted or non-specific manner, resulting in various characterizations of methylation’s effect on expression [Citation26–28]. However, although correlations have been reported, the relationship between DNA methylation and expression is not well understood, and these existing studies show variability in the strength of the association. Promoter methylation is a region understood to have regulatory capacity and is often studied and modified, however, the correlation between promoter methylation and expression is highly variable between genes and results differ across experiments [Citation14,Citation24].
Publicly available gene expression data has been used to create transcriptional correlation networks to predict gene function, using annotation sets like Gene Ontology as targets for the prediction [Citation29,Citation30]. These tools have been used to drive hypothesis generation and identify latent information and relationships between genes from existing data [Citation21]. However, DNA methylation has not yet been applied to this context, possibly because attempts using it to predict expression have not been very accurate [Citation31]. It is possible DNA methylation’s previously reported correlation to expression in certain genes may simply result in limited recapitulation of expression’s predictive capacity, or that the unique profile of methylation may result in unique relationships not previously seen in expression-based gene function predictive models.
However, the existing tools for expression cannot be directly applied to methylation, partly because methylation is expressed as a percent, whereby expression measurements are a continuous value. Gene expression microarrays are typically converted to the average of all probes annotated to a particular gene as the mean expression for that gene. For methylation, the probes represent distinct methylation marks across the gene locus, and taking the average may not necessarily result in a biologically meaningful signal. While computationally demanding multivariate models can potentially overcome these limitations [Citation32], we attempted to bridge the gap between the existing expression tools by developing one to specifically study methylation correlation networks. In this study, we use it to process public data and build a large dataset of correlated methylation values, to better understand the best unit to collapse methylation values to, and the best genomic features to use for predicting gene function.
We use this dataset to perform gene function prediction based on existing expression techniques, and perform agglomerative clustering to perform enrichments to characterize which biological processes the features’ methylation is associated with. Here, we developed a framework for analysing publicly available DNA methylation microarrays to address two questions. (1) How well does the global DNA co-methylation network predict gene function above a naïve predictor [Citation33]? How do predictions based upon methylation perform when compared to co-expression globally as well as in categories DNA methylation would be expected to be predictive, including tissue specificity and age? The resulting predictive models reveal differences between methylation and expression’s capacity to predict gene function that provide insight into methylation’s role as regulator of gene transcription.
Methods
Obtaining experimental and annotation data
Twenty-three thousand four hundredfifteen samples of Illumina Human Methylation 450k array data (GEO accession: GPL13534) were downloaded from Gene Expression Omnibus [Citation34] in Minimum Information About a Microarray Experiment Notation in Markup Language (MINIML) format (), with mappings downloaded from the associated platform table file available on the platform page. While over 100,000 samples have been submitted to GEO, only 31,736 samples are contained in the whole-platform MINIML archive available on the GEO FTP server [Citation1] as of 12 September 2021. The GEO Accession FTP server was also used to download Affymetrix U133 microarrays (GEO accession: GPL570) for gene expression controls. Analysis was limited to datasets that could be confirmed to fall within the range of 0 to 1 for methylation beta values, or −6 to 6 for M values and less than 5% missing values per sample to remove unprocessed intensity values or low-quality samples. We excluded datasets with greater than 5% missing values across the samples for both methylation and gene expression data. This data was then converted to a matrix of samples by probes using Python tools available in the MANA GitHub repository (gitlab.com/wrenlab/mana.git). GEO annotations were identified using Automated Label Extraction [Citation35], which uses text-mining methods to extract a subset of biologically relevant sample annotations (age, sex, and tissue) from GEO semi-structured textual metadata into a structured, tabular format. Genomic feature loci were downloaded from the GPL13534 supplemental data as well as hg19 BioMart tools [Citation36]. The raw data and resulting comethylation matrix are stored in the hierarchical data format (HDF5) and the platform and annotation files are stored in comma-delimited flat files or their original text format.
Preprocessing samples for meta-analysis
The generic tissue label of ‘cells, tissue, and enzymes’ from ALE was filtered out. kNN imputation on missing values was performed using fancyimpute. Because substantial batch effects are present across samples between different experiments, quantile normalization was used to make the distributions of beta values across samples comparable. While tools like GEOquery in R allow the downloading of the 450k microarray data at the level of cell data, not all samples have cell data available. To increase the number of samples in our analysis, we opted to use the provided GEO MINIML format to obtain more samples. One limitation of the MINIML format is that the data is provided most commonly as beta value without information about the intensities of the original probes. While there are extensive preprocessing methods that utilize the probe intensities, this information is not available in this representation of the data. Thus, quantile normalization allowed for normalizing the data to comparable distributions, while preserving the relative ranking of each probe in relation to all other probes, which retains the information about which probes are more or less methylated.
Mapping probes to genomic feature was done using PyBedtools [Citation37]. The per-feature means were performed using the MANA package (http://gitlab.com/xroopnar/MANA), in which measures of central tendency (mean and median) are taken for the probes overlapping each gene using each of the following criteria: 50 base pairs upstream to 50 base pairs downstream the TSS (TSS50), 200 base pairs upstream to the TSS (TSS200), 1500 base pairs upstream to the TSS (TSS1500), the gene body (). They are further subdivided into the regions overlapping CpG-Islands, exons, introns, and regulatory elements.
Modelling and statistical analysis
Logistic regression models were trained with five-fold cross validation using sklearn in Python. Correlation matrices for methylation and expression were generated from pairwise Pearson correlation coefficients using the scipy.stats package. Gene function prediction was performed using the method described in the ARCHS4 publication [Citation30]. For each gene, a predictive score for each GO term is assigned by taking the mean across the correlations of a given gene to all genes annotated with a given GO term. In the case that a given gene is already annotated with that GO term, the self-correlation is dropped, and only the remaining correlations are considered. This mean correlation across GO terms results in each gene being assigned a score for each GO term. The AUC of the scores to the true labels for each term are computed using Scikit-learn’s ‘roc_auc_score’ and compared to the scores for the same process applied to a comethylation matrix generated from permuted labels [Citation38]. Scoring a prediction for a term for any given is the mean correlation of that gene with the genes annotated with that term, excluding itself if present in the gene list.
For clustering of the comethylation matrix, we used agglomerative hierarchical clustering methods available in Scikit-Learn. Hierarchical clustering with a branch cut was used based on its previous effectiveness in microarray analysis including weighted-gene correlation network analysis [Citation2]. The resulting hierarchical structure was split into discrete cut-offs using a branch cut dividing each set into six clusters. This n was chosen by permuting across different cluster counts using the median TSS1500 comethylation matrix and testing for enrichment across GO Biological Process terms. Previous literature has identified an association with promoter methylation with polycomb-group proteins associated with chromatin remodelling, so we used TSS1500 methylation to characterize the extent of this association across a multi-tissue comethylation network [Citation11,Citation39]. For bimodally distributed values, the mean will result in a middle value between the peaks, so median methylation is used to produce values in the more commonly observed peak. The cluster count, starting with 3, was increased by 1 until the resulting clusters had multiple non-significant clusters. The enrichment analysis on the resulting clusters was performed using the Enrichr package, across multiple libraries of terms for enrichment including the Gene Ontology, histone binding, transcription factor and chromatin immunoprecipitation (ChIP), and the Kyoto Encyclopaedia of Genes and Genomes (KEGG) disease terms [Citation40,Citation41]. A summarization of the enrichment groups identified by each cluster is shown in Figure S1.
Naïve predictor of gene function
For approaches that take some input data in an attempt to predict the probability a gene will be associated with a specific Gene Ontology (GO) label, it was shown that simply predicting annotations on the basis of relative term frequency within GO significantly outperformed random predictions and, indeed, several algorithmic methods [Citation3]. Thus, the ‘naïve’ approach predicts annotations simply based on term frequency, rather than assuming each annotation is of equal probability. The problem stems from what Pavlidis and Gillis refer to as multifunctionality, or genes with multiple annotations of equal weight. In a hierarchical structure, higher-level terms will be associated with more genes and, thus, more likely to be correct. For our naïve predictor, we first limit our gene list to only the genes available in our experimental dataset, and also limit predictions to GO terms with 10 to 100 annotated genes. This cut-off is used by Pavlidis and Gillis to establish AUROC scores for the GO structure without skewing the results from lowly or highly annotated GO terms. After limiting our input to the genes available in the dataset, the resulting score for each gene is defined as the number of terms annotated with that gene across the remaining GO terms. The resulting scores have a computed AUROC of 0.757 for the genes annotated in the 450k microarray platform.
Paired methylation and expression analysis
Paired Illumina HumanMethylation 450k microarrays associated with preprocessed expression gene counts were downloaded programmatically using the Genomic Data Commons’ Data API. Eight hundred and sixty-five healthy control samples from lung cancer datasets were queried from the API using the term for sample type ‘Solid Tissue Normal’ for all lung cancer samples with both methylation microarray and expression counts associated with the sample. The methylation data is downloaded as a comma-delimited file containing beta values, and a Spearman’s rho correlation was correlated for a representative methylation for each gene, to the log expression counts for that gene, across all samples. The representative methylation value is calculated as described in the preprocessing section of the methods. For each gene, the correlation between methylation and expression is correlated to the accuracy calculated for GO term predictions for each gene. AutoGDC was used to download the data and associated GDC annotations, and is provided through Gitlab at https://gitlab.com/chase_brown/autogdc.
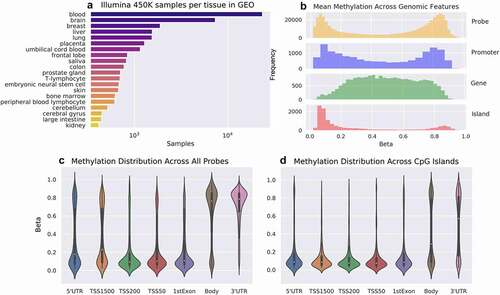
Figure 1. CpG Methylation contains different distributions across genomic features. (a) 23,145 Illumina HumanMethylation450k microarrays were annotated with tissue names using ALE. (b) The distribution of average methylation across mean TSS1500 (‘Promoter’), mean gene body (‘Gene’), and CpG Islands (‘Island’) shows a bimodal distribution in the promoters and hypomethylation in CpG Islands. (c) The average probe level methylation across all genomic features differs from CpG-Island-specific probes, with (d) fewer hypermethylated loci around the gene body.
Results
Co-methylation trends correspond to genomic accessibility
Gene–gene expression correlations have been used as a scoring method for predicting gene function and protein–protein interactions, and has been shown to have an AUC of 0.75 when performed on the ARCHS4 mouse expression data as a characterization of the dataset’s biological information [Citation30]. Similarly, enrichment analysis on clusters of correlated genes by expression or methylation reported significantly enriched biologically relevant GO terms [Citation2]. We replicated the Ma’ayan lab method across promoter and gene body methylation on the GPL13534 methylation microarrays, as well as on an expression dataset of Affymetrix Human Genome U133 microarrays with 14,133 annotated GO terms. The expression dataset serves as a baseline for predictive performance using a comparable data type to the original ARCHS4 method performed on expression counts. Using the co-methylation network we then followed up with agglomerative clustering and enrichment analysis (). In the mean expression microarray dataset (n = 16,514), we achieved a macro-AUC of 0.69. Methylation resulted in a macro-AUC of 0.62 for the highest performing region, mean gene body methylation (). As a negative control, for each feature, a randomly sampled number of probes equivalent to the associated number of probes per gene was sampled which, as expected, resulted in macro-AUCs of 0.5 for all features, indicating that the predictive performance of the co-methylation GBA predictions is dependent on the methylation associated with each gene. To further characterize these macro-AUCs, we predicted gene function using the naive predictor as described by Gillis and Pavlidis [Citation42], which ranks GO term predictions for genes simply by the relative frequency of the GO term, results in a macro-AUC of 0.77 as described in the methods section. Using the co-methylation network, enrichment analysis was performed on the hierarchical clusters formed on the co-methylated genes. Interestingly, methylation clusters share some commonalities across the resulting enrichments, with repressive histone modifications associated with gene promoters that are hypermethylated and permissive histone modifications associated with promoter hypomethylation ().
Gene body methylation levels are predictive of gene function
Since neither the co-methylation or co-expression predictors were higher than the naive prediction method, we then trained a logistic regression model on the methylation and expression datasets. The resulting macro-AUCs increased significantly, with the control expression dataset macro-AUC of 0.82. The negative control using random sampling did not change, with macro-AUCs of 0.50 for TSS1500, TSS200, and gene body methylation as well as expression. For methylation, the highest performing macro-AUC of 0.81 was mean gene body methylation (). Because mean gene body methylation was the highest performing feature for both the logistic regression and co-methylation predictions, and have a higher probe count on average, we downsampled gene body methylation to have the same number of probes for each genes’ TSS1500 promoter. This, however, did not affect the overall macro-AUC, which remained 0.81. This result suggests that the increased probe count for the gene body does not account for the increased performance. While the mean gene body methylation performance was high, it was not higher than the positive control of expression. However, all features’ resulting macro-AUC stayed higher than the negative controls, and increased higher than the naive predictor’s macro-AUC. Models were also trained on the intersection of gene body and promoter methylation with different regulatory features; however, because of the reduction in overall probes available in each intersection of features, the performance did not exceed macro-AUCs of 0.7 (Fig S2).
Function prediction from gene body methylation recapitulates expression predictions
We correlated the per-GO term AUCs of the logistic regression models to the naive predictors’ AUCs to identify if the predictions were simply replicating the structure of GO. However, neither gene body (Pearson’s r = −0.02) or TSS1500 (Pearson’s r = 0.0) methylation is correlated with the naive predictions (). Expression also had no correlation to the naive predictions (Pearson’s r = −0.07), however the mean gene body methylation AUCs were correlated with expression AUCs (Pearson’s r = 0.69) as well as to the TSS1500 AUCs (Pearson’s r = 0.72) and TSS200 (R2 = 0.70) (). While the methylation logistic regression model did not simply recapitulate the predictive performance of GO, the methylation features predict similarly and have per-term AUCs that are correlated to one another. Both the methylation features (Pearson’s r = −0.17 for mean gene body methylation) and expression (Pearson’s r = −0.16) had a low anti-correlation between GO term AUC and the number of genes annotated with that term; however, the naive predictor (Pearson’s r = −0.03) notably had almost no relationship between genes annotated with a term and AUC (). The weak correlation suggests that limiting the predictions to GO terms with between 10 and 100 annotated genes reduces the association between AUC and genes annotated from the very poorly and very highly annotated genes, as cautioned by Pavlidis and Gillis.
As previously noted, DNA methylation is predictive of age, and it has been observed that increased age is correlated with increased variability in the methylome [Citation43]. To assess if age-related methylation changes affect predictive performance, logistic regression models were trained on samples under age 30, between 30 and 60, and above 60 for mean gene body and mean TSS1500 methylation. Notably, the young, middle-aged, and old samples had equal performance, with macro-AUCs of 0.86 (). The computed relative standard deviations (RSD) for young (RSD = 0.46) and old (RSD = 0.44) for the FDR-significant CpG sites indicate that the changes in variability with age are low in this data set.
Tissue-specific co-methylation patterns are less predictive than cross-tissue patterns
To test whether gene function prediction works better with tissue-specific methylation correlations, we took the 10 tissues with the most samples and predicted gene function from each set’s TSS1500 and gene body. The resulting macro-AUCs ranged from 0.55 to 0.61 in the mean TSS1500, and 0.66 to 0.72 in the mean gene body. The control dataset was randomly sampled from all tissues to the same number of samples as used in each tissue, and predicted with a macro-AUC of 0.88 using mean gene body methylation. This indicated that the reduced AUC of the per-tissue predictions was not due to the lowered input sample size, but rather that a global signature of methylation across multiple tissues increases predictive performance ().
DNA methylation is a strong predictor of alterations to gene transcription and post-translational modifications
The logistic regression models utilize principal component analysis prior to training to reduce the number of features considered when training. Normally, a single dataset is reduced to the first 20 principal components. However, we can integrate multiple datasets by combining the principal components into one matrix where the features are the components from each dataset. By combining the first ten principal components from a given methylation dataset with the first ten principal components of the expression data, we integrated both datasets to determine if combining them increases predictive performance. The resulting model had an AUC of 0.82 when integrating gene body methylation or TSS1500 methylation with expression, and 0.83 when integrating TSS200 methylation. Gene body methylation prediction accuracy was anticorrelated (Pearson’s r = 0.307) to high anticorrelation between methylation and expression (), while TSS200 methylation prediction accuracy was correlated (Pearson’s r = −0.174) with increased anticorrelation between methylation and expression ().
While the methylation features per-term AUCs are correlated with the per-term AUCs from expression, shows the top 20 largest differences in AUC between mean gene body methylation and expression. Interestingly, terms related to post-translational modification and targeting, including ‘protein targeting to mitochondrion (GO:0006626),’”protein kinase A binding (GO:0051018)”, and ‘localization (GO:0051179)’ are included. Conversely, the top 20 GO terms () with the largest increase in AUC in gene body methylation relative to expression includes the transcription-related terms ‘HIR complex (GO:0000417),’ ‘transcription initiation from RNA polymerase I (GO:0006361),’ as well as cancer-related GO terms including ‘fructose 2,6-bisphosphate metabolic process (GO:0006003)’ and ‘L-serine metabolic process (GO:0006563).’ In the cases where the combined TSS200 and expression predictions were greater than either methylation or expression-based predictions, the same cancer-related terms rank highly (), with enhancer sequence-specific DNA binding (GO:0001158) indicating that TSS200 methylation has an increased ability to predict gene function related to enhancer binding. Previous literature suggests that both l-serine metabolism and fructose 2,6-bisphosphate metabolism are associated with cancer metabolism, with l-serine contributing to a unique cancer methylation profile by supplementing available methionine for de-novo methylation via the SAM cycle [Citation44,Citation45].
Figure 2. Comethylation network clusters correspond to chromatin states with repressive chromatin associated with hypermethylation. (a) Mean TSS1500 comethylation enrichments for histone modifications using Enrichr on the agglomerative clustering. (c,d) Repressive histone modifications (H3K9me3 and H3K27me3) and permissive histone modifications (H3K4me3 and H3K27ac) cluster separately, and are associated with hyper- and hypomethylation respectively. (b) The resulting comethylation clusters for mean TSS1500 are enriched for ENCODE Histone Modification terms associated with differentiation, translation, neuron and brain-related terms, and immunity.
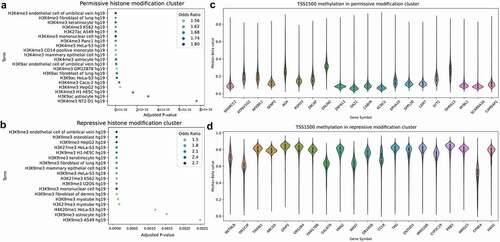
Figure 3. Comethylation is less predictive of gene function than gene expression. (a) The per GO term AUCs for comethylation and coexpression predictions are correlated, (b) however, the macro-AUCs for coexpression (macro-AUC = 0.68) and comethylation (macro-AUC = 0.58) are not greater than the naive prediction (macro-AUC = 0.77). (c) The Pearson’s correlation between the AUCs for comethylation and the AUCs for coexpression result in a Pearson’s correlation coefficient of 0.29, indicating a low correlation between the predictions.
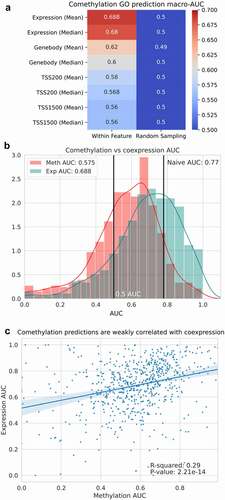
Figure 4. Logistic regression-based gene function prediction performs better than the naive predictor for both expression and methylation. Macro-AUCs for logistic regression models for mean and median methylation and expression, as well as combined expression and mean TSS1500 methylation (TSS1500_EXP), TSS200 (TSS200_EXP) and gene body (GB_EXP) (a). Per root GO term macro-AUCs for the features in 3a (b). Logistic regression macro-AUCs for models trained on slices of the GEO dataset (sample n = 1000 for each model) with annotated ages under 30 (Young), between 30 and 60 (Middle-aged), and over 60 (Old) (c). Logistic regression macro-AUCs for models trained on slices of the GEO dataset (sample n = 200 for each model) with the annotated tissue for each row. The control is composed of randomly selected samples from all tissues, with sample n = 1000 (d).
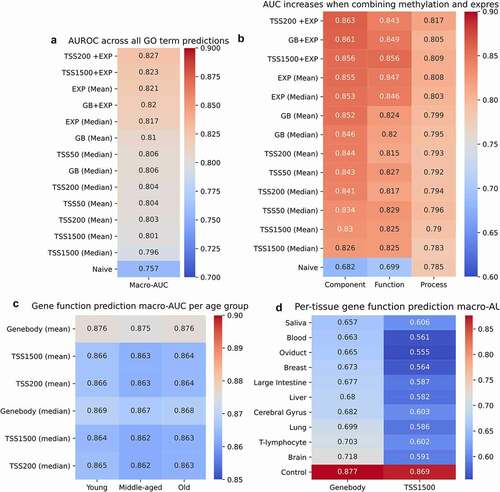
Figure 5. Methylation predictions are not correlated with naive predictions. (a) GO term AUCs are not correlated to naive predictor GO term AUC. (b) Mean TSS1500 and TSS200 methylation AUCs (c) and mean gene body methylation AUCs are correlated to expression AUCs. (d) Mean TSS1500, gene body methylation, and expression GO term AUCs are weakly correlated to the number of annotated terms per GO term.
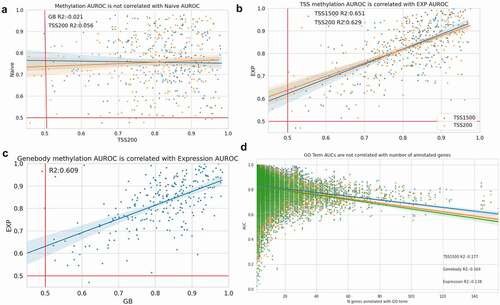
Figure 6. Methylation-expression correlation in paired data is correlated with increased GO term predictive accuracy. For each gene, the mean Pearson’s r correlation of its probes is plotted against the GO term prediction accuracy from the logistic regression model. Gene body methylation (6a-b) shows an inverse relationship between prediction accuracy and correlation to expression in genes with an anticorrelation to expression (6a), while genes with a positive correlation between methylation and expression have a weaker inverse relationship between correlation and prediction accuracy (6b). The TSS200 methylation shows a relationship (Pearson's r = −0.714) for anticorrelation between methylation and expression to GO term prediction accuracy in anticorrelated genes (6c), similarly, correlated genes increase in GO term prediction accuracy with increase correlation between methylation and expression in the genes with a positive correlation to expression (6d).
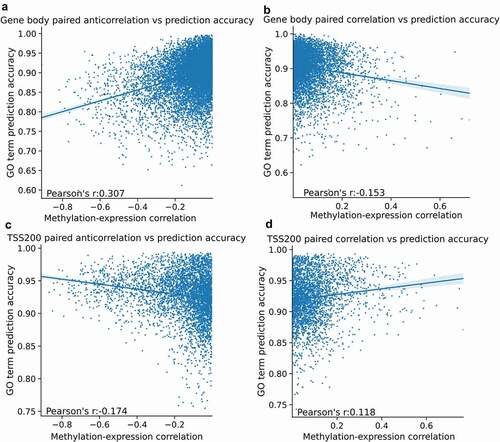
Table 1. Top 20 GO terms with highest difference between mean gene body and mean expression logistic regression prediction AUCs.
Table 2. Top 20 GO terms with highest difference between mean expression and mean gene body logistic regression prediction AUCs.
Table 3. Top 20 GO terms with highest difference between mean combined TSS1500 and expression AUC and expression.
Discussion conclusion
In this study, we presented evidence that DNA methylation is predictive of gene function, and this predictive performance is correlated to the predictive capacity of expression with a correlation coefficient of 0.79 for mean gene body methylation. We identified gene body methylation as more predictive than promoter methylation, as measured by macro-AUC when predicting GO terms using a logistic regression model. While promoter methylation has been extensively described as inversely correlated with expression, the existing literature also observes gene body methylation as associated with functional changes in expression. For example, in hepatocellular carcinomas, a model trained on CpG-Island associated gene body methylation was shown to be predictive of oncogene expression [Citation46,Citation47], and while functional gene body methylation is often observed in plants, there is some literature observing a correlation between expression and gene body methylation in human cells [Citation48]. The co-methylation network predictions, while lower in macro-AUC than the logistic regression model, resulted in cluster enrichments that revealed methylation has a shared enrichment across all tested features for polycomb repressor 2 genes. This has been observed previously in the literature [Citation11,Citation49]. The association with PRC2 genes across all genomic features suggests that the repressive chromatin state bestowed by PRC2 is reflected in methylation patterns across the entire gene locus. The literature assertion that repressive histone modifications are associated with promoter hypermethylation was also confirmed by the cluster enrichments, with H3K4me3 and H3K27ac associated with hypomethylation and H3K9me3 and H3K27me3 associated with hypermethylation [Citation50,Citation51]. The comparison between paired methylation and expression correlation in a given gene to its GO term prediction accuracy reflected some previous literature on the relationship between methylation across a gene locus and its expression. While anticorrelation is observed at TSS200 reflecting permissive hypomethylation at the transcription start site, the degree of anticorrelation is also correlated with GO term prediction accuracy. However, the opposite trend is observed in the gene body methylation, where a degree of hypermethylation is associated non-monotonically with expression [Citation52,Citation53].
The association of the comethylation network with PRC2 subunits indicates that the network is reflective of methylation that is associated with chromatin remodelling. However, the logistic regression model revealed that gene body methylation is most predictive of the methylation features used. This may indicate that alternative splicing may be regulated by methylation of exonic regions, which is supported by the observation of generally hypomethylated exons in . These findings suggest that methylation may have multiple mechanisms of gene regulation it may be contributing to.
In , there is agreement between the high-AUC terms in both gene body methylation predictions and TSS200-expression combined predictions in the cancer-related terms. This is indicative of the cancer-specific methylation profile that would exist in the GEO samples from cancer tissue samples, which may be contributing to the increase in predictive AUROC for GO terms associated with cancer in the DNA methylation-based predictions. In particular, the increased AUROC for fructose 2,6-bisphosphate metabolic process (GO:0006003) suggests that the methylation profile associated with cancer metabolism is being picked up by the model. Fructose 2,6 bisphosphate regulates the fructose-6-phosphate/fructose-1,6-bisphosphate cycle, which is involved in the metabolism reprogramming observed in many tumour types [Citation44]. The presence of this term is indicative of the methylation profile changes associated with regulation of glycolytic activity. L-serine metabolic process (GO:0006563) has been shown to be associated with cancer methylation. The S-adenosyl methionine (SAM) cycle is the mechanism for CpG methylation to be preserved, or for de novo methylation on CpG sites. However, when ATP is depleted, serine can support the SAM cycle as a component of de novo ATP synthesis. This mechanism is observed in cancer and is suggestive that L-serine metabolism is associated with the modification to epigenome observed in cancer cells as a functional component contributing to SAM cycle-mediated methylation [Citation45]. These GO term enrichments indicate that the presence of cancer tissue samples in the comethylation network dataset influence the results, and may indicate that a cancer-specific comethylation network analysis could resolve more about how the epigenome influences expression and metabolic changes in cancer.
We demonstrated that a machine learning approach can predict gene function from methylation correlations derived from publicly-available data, and that gene function AUC remains the same in both young and old samples. We have shown that cross-tissue performance is superior to single-tissue models after controlling for sample size. Integration of methylation and expression increased performance. However, other methods of dimension reduction like factor analysis may be able to increase the performance of integrated methylation and expression predictive models when high-quality paired expression and methylation data becomes available. One of the challenges of evaluating a machine learning model is comparing experimental results to appropriate controls. An important consideration outlined in the Critical Assessment of Function Prediction (CAFA) [Citation54] is the need to compare against the naive predictions, to characterize to what extent the model is replicating the structure of the Gene Ontology. We have shown the logistic regression model had a higher macro-AUC than the naive predictor of the annotated GO term list, while the co-methylation predictions had a lower macro-AUC. The comparison to the naive per-term AUCs showed little to no correlation between expression and methylation features, both of which had higher macro-AUCs than the naive predictor. Our goal in training the expression model was to show that 38% of the 13,410 shared GO terms predicted by mean gene body methylation have a higher AUC than the same model trained on expression data with the same number of samples. This indicates that DNA methylation is not simply recapitulating the performance of gene expression and that unique information about gene function is encoded in DNA methylation. As discussed earlier, many of the literature associations with DNA methylation indicate it is regulated by promoter regions [Citation14,Citation24]. However, there is increasing evidence that DNA methylation can be associated with alternative splicing. This may explain our finding that gene bodies were more predictive of gene function than the promoter region [Citation39,Citation55]. It is important to note that the predictions for neither promoter methylation or gene body methylation were associated with the naive prediction as seen in , indicating that both contain new information.
The comethylation network has been shown to contain information about gene function using even rudimentary predictions based on mean comethylation, however the enrichment analysis revealed a strong association between comethylation and chromatin remodelling histone modifications, with repressive and permissive clusters. The utility of the model was increased by training a logistic regression model, where gains in performance of methylation included terms associated with transcription, while increases in performance with expression included terms associated with post-translational modifications. The comethylation network has been shown to contain biologically relevant information that can be mined and queried to find new relationships about genes that are not seen in coexpression-based methods.
We note that there are several limitations to this study. Taking a measure of central tendency is only one of many ways to represent methylation, and it is possible that multivariate models may result in better performance at increased computational cost. While the Illumina HumanMethylation450k microarray is still the DNA methylation platform with the most samples available, the EPIC array and bisulphite sequencing are increasing in availability in repositories and could be used to increase the coverage of the methylome for use in a predictive model.
Future studies in other sample populations and data types are warranted to validate the predictive model.
Data availability
Code for MANA is located at https://gitlab.com/wrenlab/mana.git
Supplemental Material
Download Zip (1.4 MB)Acknowledgments
The authors would like to acknowledge funding from NIH grants # 5P30AG050911, 2P20GM103636 and 5U54GM104938 (to J.D.W.)
Disclosure statement
No potential conflict of interest was reported by the authors.
Supplementary material
Supplemental data for this article can be accessed here
Additional information
Funding
Related Research Data
References
- The FANTOM Consortium. A promoter-level mammalian expression atlas. Nature. 2014;507(7493):462–470.
- Langfelder P, Horvath S. WGCNA: an R package for weighted correlation network analysis. BMC Bioinformatics. 2008;9:559.
- Pavlidis P, Gillis J. Progress and challenges in the computational prediction of gene function using networks: 2012-2013 update. F1000Res. 2013;2:230.
- van Dam S, Võsa U, van der Graaf A, et al. Gene co-expression analysis for functional classification and gene-disease predictions. Brief Bioinform. 2018;19(4):575–592.
- Wang R, Zhu H, Yang M, et al. DNA methylation profiling analysis identifies a DNA methylation signature for predicting prognosis and recurrence of lung adenocarcinoma. Oncol Lett. 2019;18(6):5831–5842.
- Hartl CL, Ramaswami G, Pembroke WG, et al. Coexpression network architecture reveals the brain-wide and multiregional basis of disease susceptibility. Nat Neurosci. 2021;24(9):1313–1323.
- Jiang X, Zhang H, Quan XW. Differentially coexpressed disease gene identification based on gene coexpression network. Biomed Res Int. 2016;2016.
- Hibbs MA, Hess DC, Myers CL, et al. Exploring the functional landscape of gene expression: directed search of large microarray compendia. Bioinformatics. 2007;23(20):2692–2699.
- Piovesan D, Giollo M, Ferrari C, et al. Protein function prediction using guilty by association from interaction networks. Amino Acids. 2015;47(12):2583–2592.
- Mihelcic M, Smuc T, Supek F. Patterns of diverse gene functions in genomic neighborhoods predict gene function and phenotype. Sci Rep. 2019;9(1):19537.
- Horvath S. DNA methylation age of human tissues and cell types. Genome Biol. 2013;14(10):R115.
- Okae H, Chiba H, Hiura H, et al. Genome-wide analysis of DNA methylation dynamics during early human development. PLoS Genet. 2014;10(12):e1004868.
- Lister R, Mukamel EA, Nery JR, et al. Global epigenomic reconfiguration during mammalian brain development. Science. 2013;341(6146):1237905.
- Lokk K, Modhukur V, Rajashekar B, et al. DNA methylome profiling of human tissues identifies global and tissue-specific methylation patterns. Genome Biol. 2014;15(4):r54.
- Kang JG, Park JS, Ko JH, et al. Regulation of gene expression by altered promoter methylation using a CRISPR/Cas9-mediated epigenetic editing system. Sci. Rep. 2019;9(1):11960.
- Ehrlich M. Expression of various genes is controlled by DNA methylation during mammalian development. J Cell Biochem. 2003;88(5):899–910.
- Greenberg MVC, Bourc’his D. The diverse roles of DNA methylation in mammalian development and disease. Nat Rev Mol Cell Biol. 2019;20(10):590–607.
- Okano M, Bell DW, Haber DA, et al. DNA methyltransferases Dnmt3a and Dnmt3b are essential for de novo methylation and mammalian development. Cell. 1999;99(3):247–257.
- Dor Y, Cedar H. Principles of DNA methylation and their implications for biology and medicine. Lancet. 2018;392(10149):777–786.
- Mazzone R, Zwergel C, Artico M, et al. The emerging role of epigenetics in human autoimmune disorders. Clin. Epigenetics. 2019;11(1):34.
- Liu XS, Wu H, Ji X, et al. Editing DNA methylation in the mammalian genome. Cell. 2016;167(1):233–247.e17.
- Wang T, Guan W, Lin J, et al. A systematic study of normalization methods for infinium 450K methylation data using whole-genome bisulfite sequencing data. Epigenetics. 2015;10(7):662–669.
- Capper D, Jones DTW, Sill M, et al. DNA methylation-based classification of central nervous system tumours. Nature. 2018;555(7697):469–474.
- Korthauer K, Irizarry RA. Genome-wide repressive capacity of promoter DNA methylation is revealed through epigenomic manipulation. bioRxiv. 2018.
- Gaiti F, Chaligne R, Gu H, et al. Epigenetic evolution and lineage histories of chronic lymphocytic leukaemia. Nature. 2019;569(7757):576–580.
- Joubert BR, Felix J, Yousefi P, et al. DNA methylation in newborns and maternal smoking in pregnancy: genome-wide consortium meta-analysis. Am J Hum Genet. 2016;98(4):680–696.
- Lei Y, Zhang X, Su J, et al. Targeted DNA methylation in vivo using an engineered dCas9-MQ1 fusion protein. Nat Commun. 2017;8:16026.
- Galonska C, Charlton J, Mattei AL, et al. Genome-wide tracking of dCas9-methyltransferase footprints. Nat Commun. 2018;9(1):597.
- Dozmorov MG, Giles CB, Wren JD. Predicting gene ontology from a global meta-analysis of 1-color microarray experiments. BMC Bioinformatics. 2011;12(Suppl 10):S14.
- Lachmann A, Torre D, Keenan AB, et al. Massive mining of publicly available RNA-seq data from human and mouse. Nat Commun. 2018;9(1):1366.
- Zhong H, Kim S, Zhi D, et al. Predicting gene expression using DNA methylation in three human populations. PeerJ. 2019;7:e6757.
- Testa R, Vanhooren V, Bonfigli AR, et al. N-glycomic changes in serum proteins in type 2 diabetes mellitus correlate with complications and with metabolic syndrome parameters. PLoS One. 2015;10(3):e0119983.
- Tsankov AM, Wadsworth MH, Akopian V, et al. Loss of DNA methyltransferase activity in primed human ES cells triggers increased cell-cell variability and transcriptional repression. Development. 2019;146(19). doi:10.1242/dev.174722.
- Edgar R, Domrachev M, Lash AE. Gene expression omnibus: NCBI gene expression and hybridization array data repository. Nucleic Acids Res. 2002;30(1):207–210.
- Giles CB, Brown CA, Ripperger M, et al. ALE: automated label extraction from GEO metadata. BMC Bioinformatics. 2017;18(14):509.
- Kinsella RJ, Kahari A, Haider S, et al. Ensembl BioMarts: a hub for data retrieval across taxonomic space. Database-the J of Biological Databases and Curation. 2011.
- Dale RK, Pedersen BS, Quinlan AR. Pybedtools: a flexible Python library for manipulating genomic datasets and annotations. Bioinformatics. 2011;27(24):3423–3424.
- Pedregosa F, Varoquaux G, Gramfort A, et al. Scikit-learn: machine learning in python. J Mach Learn Res. 2011;12:2825–2830.
- Shayevitch R, Askayo D, Keydar I, et al. The importance of DNA methylation of exons on alternative splicing. RNA. 2018;24(10):1351–1362.
- Kuleshov MV, Jones MR, Rouillard AD, et al. Enrichr: a comprehensive gene set enrichment analysis web server 2016 update. Nucleic Acids Res. 2016;44(W1):W90–W97.
- Chen EY, Thompson P, Ananiadou S, et al. Enrichr: interactive and collaborative HTML5 gene list enrichment analysis tool. Bmc Bioinformatics. 2013;14:14.
- Gillis J, Pavlidis P. Characterizing the state of the art in the computational assignment of gene function: lessons from the first critical assessment of functional annotation (CAFA). BMC Bioinformatics. 2013;14(Suppl 3):S15.
- Slieker RC, van Iterson M, Luijk R, et al. Age-related accrual of methylomic variability is linked to fundamental ageing mechanisms. Genome Biol. 2016;17(1):191.
- Maddocks ODK, Labuschagne CF, Adams PD, et al. Serine metabolism supports the methionine cycle and dna/rna methylation through de novo atp synthesis in cancer cells. Mol. Cell. 2016;61(2):210–221.
- Bartrons R, Simon-Molas H, Rodríguez-García A, et al. Fructose 2,6-bisphosphate in cancer cell metabolism. Front. Oncol. 2018;8:331.
- Yang X, Han H, De Carvalho D, et al. Gene body methylation can alter gene expression and is a therapeutic target in cancer. Cancer Cell. 2014;26(4):577–590.
- Arechederra M, Daian F, Yim A, et al. Hypermethylation of gene body CpG Islands predicts high dosage of functional oncogenes in liver cancer. Nat Commun. 2018;9(1):3164.
- Ball MP, Li JB, Gao Y, et al. Targeted and genome-scale strategies reveal gene-body methylation signatures in human cells. Nat Biotechnol. 2009;27(4):361–368.
- Dozmorov MG. Polycomb repressive complex 2 epigenomic signature defines age-associated hypermethylation and gene expression changes. Epigenetics. 2015;10(6):484–495.
- Bannister AJ, Kouzarides T. Regulation of chromatin by histone modifications. Cell Res. 2011;21(3):381–395.
- Hashimshony T, Zhang J, Keshet I, et al. The role of DNA methylation in setting up chromatin structure during development. Nat Genet. 2003;34(2):187–192.
- Jjingo D, Conley AB, Yi SV, et al. On the presence and role of human gene-body DNA methylation. Oncotarget. 2012;3(4):462–474.
- Mendizabal I, Zeng J, Keller TE, et al. Body-hypomethylated human genes harbor extensive intragenic transcriptional activity and are prone to cancer-associated dysregulation. Nucleic Acids Res. 2017;45(8):4390–4400.
- Zhou N, Jiang Y, Bergquist TR, et al. The CAFA challenge reports improved protein function prediction and new functional annotations for hundreds of genes through experimental screens. Genome Biol. 2019;20(1):244.
- Maunakea AK, Chepelev I, Cui K, et al. Intragenic DNA methylation modulates alternative splicing by recruiting MeCP2 to promote exon recognition. Cell Res. 2013;23(11):1256–1269.