
ABSTRACT
Non-alcoholic fatty liver disease (NAFLD) is a highly prevalent chronic liver disease, and patient susceptibility to its onset and progression is influenced by several factors. In this study, we investigated whether altered hepatic DNA methylation in liver tissue correlates with the degree of severity of NAFLD-like liver injury induced by a high-fat and high-sucrose (HF/HS) diet in Collaborative Cross (CC) mice. Using genome-wide targeted bisulphite DNA methylation next-generation sequencing, we found that mice with different non-alcoholic fatty liver (NAFL) phenotypes could be distinguished by changes in hepatic DNA methylation profiles. Specifically, NAFL-prone male CC042 mice exhibited more prominent DNA methylation changes compared with male CC011 mice and female CC011 and CC042 mice that developed only a mild NAFL phenotype. Moreover, these mouse strains demonstrated different patterns of DNA methylation. While the HF/HS diet induced both DNA hypomethylation and DNA hypermethylation changes in all the mouse strains, the NAFL-prone male CC042 mice demonstrated a global predominance of DNA hypermethylation, whereas a more pronounced DNA hypomethylation pattern developed in the mild-NAFL phenotypic mice. In a targeted analysis of selected genes that contain differentially methylated regions (DMRs), we identified NAFL phenotype-associated differences in DNA methylation and gene expression of the Apoa4, Gls2, and Apom genes in severe NAFL-prone mice but not in mice with mild NAFL phenotypes. These changes in the expression of Apoa4 and Gls2 coincided with similar findings in a human in vitro cell model of diet-induced steatosis and in patients with NAFL. These results suggest that changes in the expression and DNA methylation status of these three genes may serve as a set of predictive markers for the development of NAFLD.
Introduction
NAFLD is one of the most common chronic liver diseases in the United States and other countries [Citation1], affecting approximately one-quarter of the world’s population. In recent years, there has been an alarming increase in the prevalence of this condition worldwide [Citation2]. NAFLD represents a spectrum of heterogeneous liver phenotypes, ranging from NAFL or simple steatosis to non-alcoholic steatohepatitis (NASH), fibrosis, and cirrhosis driven by metabolic dysfunction [Citation3,Citation4]. The complex characteristics of NAFLD are associated with multiple factors, including metabolic status, nutrition, interindividual genetic predisposition, epigenetic modifications, environmental factors, sex, race, hormonal status, and microbiota [Citation5]. Among the different mechanisms that drive NAFLD development and progression, epigenetic modifications, especially DNA methylation changes, and gene expression alterations have been intensively studied over the past several years [Citation6–8]. Accumulating evidence has documented marked disease-specific transcriptomic alterations and different types of DNA methylation changes characterized by both hypo- and hypermethylated events [Citation9–12]; however, the majority of the existing clinical reports provide only a snapshot of the altered DNA methylation and gene expression patterns at different disease stages in NAFLD patients [Citation12–16] rather than the dynamic changes that occur during the development and progression of NAFLD, making it difficult to elucidate the role and functional significance of DNA methylation alterations in the pathogenesis of NAFLD. One approach to address this limitation has been to use animal models that mirror human NAFLD pathology [Citation17,Citation18]. Indeed, several studies have described dynamic disease-specific DNA methylation and gene expression changes [Citation19–21]; however, these studies were conducted using single strains of experimental animals, which does not clarify whether the observed epigenetic and transcriptomic alterations can be reliably utilized for diagnosis and monitoring the severity of the disease in a genetically diverse human population nor can the results of these studies be applied to establish which markers reliably identify individuals who are at greatest risk of developing NASH.
In a previous study [Citation22], using Collaborative Cross (CC) mice, a state-of-the-art multiparent mouse population model with diverse and reproducible genetic backgrounds [Citation23,Citation24], we have demonstrated that feeding 25 male and 24 female CC mouse strains an obesogenic diet for 12 weeks resulted in the development of a NAFL-like phenotype in the livers of all mouse strains; however, the severity of hepatic steatosis varied based on strain and sex, with male CC042 mice showing the most pronounced hepatic pathological effects and male CC011 mice the least pronounced effects in response to this diet. Based on these findings, the goal of the present study was to investigate alterations in DNA methylation in the livers of male and female mice among these particular CC mouse strains since they demonstrate substantial differences in the magnitude of severity of NAFL-like liver injury.
Materials and methods
Animals, experimental design, and treatments
In the present study, we used liver tissue samples from male and female CC mice subjected to dietary NAFLD induced by feeding mice a high-fat and high-sucrose (HF/HS) diet for 12 weeks. The in-life portion of this study, complete experimental design, tissue collection protocols, and clinical chemistry and pathomorphological data are detailed in de Conti et al. [Citation22]. Liver sections were examined for lipid accumulation by using an osmium tetroxide staining method as detailed in de Conti et al. [Citation22].
DNA extraction
Genomic DNA was isolated from the liver tissues of male and female CC011 and CC042 mice fed an HF/HS diet or control diet using Qiagen DNeasy Blood and Tissue kits (Qiagen, Germantown, MD). DNA was quantified with a NanoDrop 2000c spectrometer (Thermo Fisher Scientific, Waltham, MA), and DNA quality was determined by 0.8% agarose gel electrophoresis.
Agilent SureSelectXT Methyl-Seq targeted DNA methylation next-generation sequencing
Genomic libraries were prepared using the SureSelectXT Methyl-Seq Library Preparation kits for targeted DNA methylation next-generation sequencing (NGS) (SureSelectXT Methyl-Seq protocol, version E0, April 2018; Agilent Technologies, Santa Clara, CA). The baits of these kits are designed to capture CpG sites over 109 Mb mouse genome regions, targeting DNA fragments of CG-rich regions (CGIs, including the shore and shelf), promoter regions, as well as known cancer- and tissue-specific differentially methylated regions (DMRs). Briefly, 3 µg of genomic DNA from liver tissue of male and female CC011 and CC042 mice (n = 3 per diet group per sex) was sonicated using a Covaris S220 sonicator (Covaris, Woburn, MA) to obtain 150–200-bp-long products. DNA was then end-repaired, A-tailed, and ligated with methylated adapters to create a pre-capture DNA library. DNA (500 ng) was then hybridized to the RNA SureSelectXT Mouse Methyl-Seq target enrichment baits at 65°C for 16 h, and the hybridized products were purified by capture with Streptavidin beads and subjected to bisulphite conversion (64°C for 2.5 h) using a Zymo EZ DNA Gold kit (Irvine, CA). The bisulphite-treated libraries were PCR-amplified for eight cycles with SureSelect Methyl-Seq PCR Master Mix and, after cleanup, the library was further PCR-amplified by another six cycles to index the library with SureSelect Methyl-Seq Indexing Primers. Purified and quantified DNA libraries were paired-end (2 × 100) sequenced with an Illumina NovaSeq 6000 Sequencing System (Illumina, San Diego, CA).
NGS computational data analysis and quantification of differential DNA methylation
Sequenced reads were processed using Trimmomatic [Citation25] and aligned to mouse (Mus musculus) genome assembly GRCm38 (mm10) reference sequences that were bisulphite-treated in silico using Bismark Bisulphite Mapper (v0.20.0) with default parameters [Citation26]. PCR duplicates and bases with a quality score <30 were not considered for subsequent analysis. Alignment efficiency of paired-end reads and bisulphite conversion rates were estimated using reads uniquely aligned to the bisulphite-converted mouse genome and as a percentage of cytosine methylation in the CpG, CHG, and CHH contexts. The methylation level of each cytosine was calculated using the Bismark methylation extractor. For CpG sites, reads from both strands were combined to calculate the methylation levels. The resulting files were uploaded into SeqMonk tools (v1.45.0) for quantitative DNA methylation analysis and annotation [http://www.bioinformatics.babraham.ac.uk/projects/seqmonk/]. CpG sites that intersected with SNPs listed in the mouse dbSNP142 database were removed from the interspecies analysis, but not from the HF/HS diet versus control diet analysis. To identify DMRs, the sequences were probed initially using the Contig probe generator. Next, the level of methylation for each DMR was quantified with ‘Methylation feature pipeline quantitation’ using [Existing Probes] features with a minimum count of 10 CpGs per position in each sample and at least one observation per feature and then combined using the mean values. DMRs with no values in at least one sample were removed from further analysis. A total of 382,300 and 417,533 DMRs were analysed in male and female mice, respectively. A difference of >10% from control and p-value <0.05 were used to identify statistically significant DMRs.
Functional analysis of differentially methylated genes
Ingenuity Pathway Analysis (IPA) software (Ingenuity Systems, Redwood City, CA) was used for biological functional and pathway analysis of differentially methylated genes. The enriched functions and pathways for a set of genes were inferred from the p-value, calculated using a right-tailed Fisher’s exact test, of the measure of the likelihood of the overlap between genes in the experimental gene set and genes in the biological function or pathway of the IPA knowledge database. Pathways and functions with a p-value cut-off of <0.05 were considered significant.
Total RNA isolation and RNA-seq gene expression analysis
Total RNA from liver tissue samples of male and female CC011, CC013, CC019, CC041, CC042, and CC043 was isolated using miRNeasy Mini kits (Qiagen). Total RNA from cells was isolated using PureLink RNA mini kits (Thermo Fisher Scientific). RNA concentrations were quantified using a NanoDrop 2000c spectrometer, and the integrity of the total RNA samples was evaluated using an Agilent 2100 Bioanalyzer (Agilent Technologies). RNA libraries for RNA-sequencing were prepared from 500 ng hepatic RNA using Illumina TruSeq Stranded Total RNA library preparation kits with Ribo-Zero Gold for rRNA depletion. After removing rRNA with Ribo-Zero rRNA removal beads, first- and second-strand cDNA syntheses, end repair, adaptor ligation, and polymerase chain reaction (PCR) amplification were performed and the quality of cDNA libraries was validated using an Agilent 2100 Bioanalyzer. cDNA libraries were 2 × 75 bp paired-end sequenced on an Illumina NextSeq 500 sequencing machine (Illumina). The sequence reads were mapped to the mouse reference genome (NCBI38/mm10) using TopHat (v2.1.1) and Bowtie2 (v2.2.5.0) [Citation27] with default parameters. Transcript abundance estimates, normalizations, and differential gene expressions were generated using Cufflinks (v2.2.1) [Citation28] with default parameters. Lists of differentially expressed genes (DEGs) were generated with a Benjamini–Hochberg p-value (to correct for multiple comparisons) cut-off of 0.05 and a fold-change threshold of 1.5. The RNA-seq gene expression data were deposited in the GEO repository (GSE149863), and the lists of DEGs are provided in the Supplementary Table 1.
Quantitative reverse transcription polymerase chain reaction
Total RNA from liver tissue samples of 24 male and female CC mouse strains [Citation22] was isolated using miRNeasy Mini kits, and 2 μg of total RNA was reverse transcribed using random primers and High-Capacity cDNA Reverse Transcription kits (Life Technologies, Grand Island, NY). The expression of selected differentially methylated genes was determined by quantitative reverse transcription polymerase chain reaction (qRT-PCR) using the TaqMan gene expression assays that are listed in Supplementary Table 2. The glyceraldehyde-3-phosphate dehydrogenase (Gapdh) gene was used as an endogenous control. The relative amount of each mRNA transcript was determined by the 2−ΔΔCt method [Citation29]. A p-value cut-off of <0.05 and a fold change threshold of >1.5 were used to generate a list of DEGs in the livers of mice fed the HF/HS diet.
In vitro model of diet-induced steatosis
Hep3B cells, obtained from the American Type Culture Collection (ATCC, Manassas, VA), and Huh7 cells, from the Japanese Collection of Research Bioresources (JCRB; Tokyo, Japan) cell bank, were maintained at 37°C and 5% CO2 in Eagle’s minimum essential medium (ATCC) supplemented with 10% foetal bovine serum (R&D Systems, Minneapolis, MN) and 100 U/ml penicillin and 100 μg/ml streptomycin (Thermo Fisher Scientific). Cells were treated with a mixture of 333 µM oleic acid and 167 µM palmitic acid (Sigma-Aldrich, St. Louis, MO) prepared in dimethyl sulphoxide (DMSO) or the vehicle (0.24% DMSO) for 7 days, replenishing fatty acid-containing medium every 48–72 h. After 7 days of fatty acid exposure, cells were harvested for analysis.
Live cell staining of intracellular lipid accumulation
To determine the cellular lipid content, the Hep3B and Huh7 cells treated with free fatty acids or vehicles were stained with Oil Red O (Sigma-Aldrich). Briefly, the cells grown on plastic culture dishes were fixed with 4% paraformaldehyde solution for 15 min and washed with PBS. Oil Red O solution (0.5% w/v dissolved in isopropanol) was diluted to a final concentration of 0.2% with distilled H2O and passed through a 0.2 µm pore size filter. Cells were incubated with Oil Red O solution for 30 min at room temperature, then washed five times with distilled H2O. Transmitted light-phase contrast cell images were obtained on Leica DMI8 inverted fluorescent microscope 20x objective equipped with a DFC450 colour camera. The colour threshold in the images was adjusted to select Oil Red O positively stained surfaces and quantified using ImageJ v.1.46r software (Bethesda, MD). The total area of Oil Red O positive pixels was normalized to the number of cells in the image.
Western blotting analyses
Cells were lysed in RIPA buffer (150 mM NaCl, 25 mM Tris, 1% NP-40, 0.5% sodium deoxycholate, and 0.1% SDS) supplemented with protease and phosphatase inhibitor cocktails (Thermo Fisher Scientific). Cell lysates containing equal quantities of proteins were separated on 10% SDS-PAGE and transferred to PVDF membranes. Membranes were immunoblotted with primary APOA4 and GAPDH antibodies (Cell Signaling Technologies, Danvers, MA) and IR-Dye conjugated secondary antibodies (LI-COR Biosciences, Lincoln, NE). Immunoblots were imaged using an Odyssey CLx imaging system (LI-COR Biosciences).
Retrieval of data from the online database
RNA-seq gene expression and pathological data from male NAFL patients (n = 9) and control individuals with a normal liver phenotype (n = 14) were downloaded from the Gene Expression Omnibus depository (GEO accession number GSE126848) [Citation30]. Reads were mapped to the GRCh38.p10 Ensembl human genome using STAR v.2.5.2a with default parameters. Transcript abundance estimates, normalizations, and differential gene expressions were generated using R package DESeq2 v.1.18.1 with default parameters.
Statistical analyses
To determine significant differences between control diet-fed mice and HF/HS diet-fed mice within an individual strain (n = 3 per group per sex), an unpaired two-tailed Student’s t-test was applied for qRT-PCR gene expression and Western blot protein analyses. Differences in the ratio of DMRs between groups were evaluated by Chi-square analyses. To analyse the effect of the HF/HS diet at the population level, the average values from control diet-fed mice and HF/HS diet-fed mice were evaluated using a Mann-Whitney Rank Sum test. Results are presented as mean ± S.D. Values of p < 0.05 were considered significant.
Results
Genome-wide DNA methylation changes are associated with the severity of NAFLD-like injury
In a previous report [Citation22], we demonstrated that feeding 25 male and 24 female CC mouse strains an obesogenic HF/HS diet for 12 weeks resulted in the development of NAFL in all mouse strains; however, the extent of the NAFL-phenotype and the severity of a histological NAFLD-like liver injury was strain-specific, with male CC042 mice being the most sensitive and male CC011 mice being the least sensitive in response to this diet. We observed a significant increase in ALT and cholesterol only in the blood of male and female CC042 mice (Supplementary Figure 1a and 1b). Additionally, there were marked increases in the expression of fibrogenesis-related genes and positive immunohistochemical staining of α-SMA in the livers of male CC042 mice, changes indicative of the progression of NAFL to NASH [Citation22]. Male CC042 mice fed the HF/HS diet had a marked increase in osmium staining (Supplementary Figure 1c), indicative of lipid accumulation, which did not occur with male CC011 mice. Feeding the HF/HS diet to female CC011 and CC042 mice resulted in a slight increase in osmium staining in female mice from both strains (Supplementary Figure 1d).
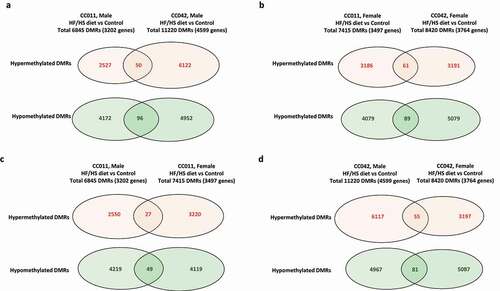
Based on these observations, we selected CC011 and CC042 mice to investigate hepatic DNA methylation changes and gene expression alterations induced by an obesogenic HF/HS diet. shows that 6845 DMRs, associated with 3202 DMR-containing genes, were found in the livers of male CC011 mice fed the HF/HS diet compared to control male CC011 mice. Among these 6845 DMRs, 2577 were hypermethylated and 4268 were hypomethylated. The number of DMRs (11220) and DMR-containing genes (4599) detected in the livers of HF/HS diet-fed male CC042 mice was 1.64 and 1.44 times greater, respectively, than in HF/HS diet-fed male CC011 (). Additionally, the pattern of genome-wide hepatic DNA methylation changes differed between male CC011 and CC042 mice fed the HF/HS diet, with the ratio of hypermethylated to hypomethylated DMRs being significantly (Chi-square p < 0.01) greater in CC042 mice compared to CC011 mice. In contrast to male mice, female CC011 and CC042 mice, which were characterized by a similar low extent of NAFL-like liver injury (Supplementary Figure 1d) exhibited similar changes in DNA methylation. This was evidenced by comparable numbers of total DMRs, as well as similar patterns of DNA methylation changes (). The very low number of common DMRs in the livers of CC011 and CC042 mice fed the HF/HS diet indicates that the genome-wide DNA methylation changes are unique for each strain. No major differences in DNA methylation were found in male and female CC011 mice fed an HF/HS diet (), whereas the methylation pattern between HF/HS diet-fed male and female CC042 mice () was characterized by a 1.9-fold greater hypermethylation level in the males.
Figure 1. Effect of a high-fat and high-sucrose (HF/HS) diet on the extent of genome-wide DNA methylation in the livers of male and female CC011 and CC042 mice. The number of differentially methylated regions (DMRs) and DMR-containing genes (indicated in parentheses) in the hepatic DNA of male (a) and female (b) CC011 and CC042 mice fed a control diet or HF/HS diet. The Chi-square analysis was performed to evaluate the significance of DNA methylation differences in the ratio of hypermethylated to hypomethylated DMRs between male CC011 and CC042 mice fed the HF/HS diet. (c) Comparison of the DMRs in the livers of male and female CC011 mice fed a HF/HS diet compared to a control diet. (d) Comparison of the DMRs in the livers of males and females CC042 mice fed a HF/HS diet compared to a control diet. Common DMRs were identified based on the genomic location. DNA methylation changes that passed a 10% threshold of DNA methylation level and p < 0.05 in mice fed a HF/HS diet compared to the control diet were considered significant.
Functional analysis of DMR-containing genes
To determine the functional outcome of the observed DNA methylation changes, we performed an IPA enrichment analysis of DMR-containing genes (). This analysis identified several critical dysregulated NAFLD-related molecular pathways in the livers of mice fed the HF/HS diet, including lipid and carbohydrate metabolism, cellular development, molecular transport, cell death and survival, and cell proliferation. These six top dysregulated pathways consisted of 347 DMR-containing genes that were significantly differentially methylated in the livers of male CC011 and CC042 mice fed the HF/HS diet and may play a significant role in NAFLD-like injury (Supplementary Table 3). It should be noted that the number of differentially methylated DMR-containing genes associated with these pathways was markedly higher in male CC042 than in male CC011 mice and female CC011 and CC042 mice (). Additionally, DNA methylation patterns of DMR-containing genes in the livers of HF/HS diet-fed male CC042 mice differed from those in male CC011 mice and female CC011 and CC042 mice. Specifically, the livers of male CC042 mice were characterized by predominant hypermethylation of DMR-containing genes (). This was evidenced by the fact that the number of hypermethylated DMR-containing genes at the most affected canonical pathways in the livers of male CC042 mice fed the HF/HS diet were 2–3 times greater than the number of hypomethylated DMR-containing genes (). In contrast, in the livers of HF/HS diet-fed male CC011 mice and female CC042 mice, the number of hypomethylated DMR-containing genes was higher than hypermethylated genes ( and 2c), while in the livers of female CC011 mice, the numbers of hypomethylated and hypermethylated genes were comparable ().
Figure 2. Pathway analysis of differentially methylated genes in the livers of male (a, b) and female (c, d) CC011 (a, c) and CC042 (b, d) mice. The number of DMR-containing genes and p-values of enriched molecular pathways were calculated using Ingenuity Pathway Analysis software.
Identification of NAFLD-related genes by pairing DNA methylation and gene expression profiles
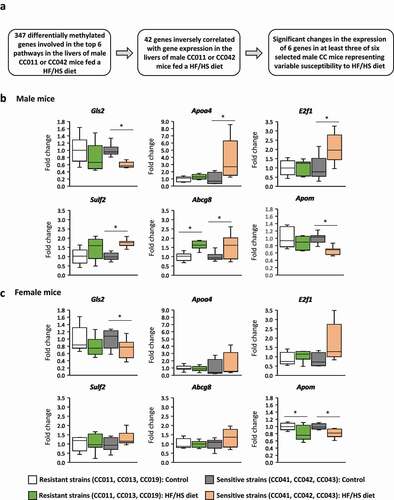
Previously, we reported that pairing gene-specific DNA methylation with gene expression profiles greatly increases the detection of critical disease-related genes [Citation31,Citation32]. Therefore, we examined the expression of the 347 DMR-containing genes, components of the six most dysregulated pathways (i.e., lipid metabolism, molecular transport, cellular development, cellular proliferation, carbohydrate metabolism, and cell death and survival) that were significantly differentially methylated in the livers of male CC011 and CC042 mice fed the HF/HS diet (Supplementary Table 3) by using RNA-seq gene expression data (GSE149863). We found that among these 347 genes, the expression of 42 genes (Supplementary Table 3) inversely correlated with DNA methylation (). Furthermore, we analysed the expression of these 42 genes in the livers of four additional male mouse strains, CC013, CC019, CC041, and CC043. In our previous study, we demonstrated that these strains exhibit the differential severity of NAFLD-like liver injury [Citation21]. CC013 and CC019 mouse strains were identified as resistant, whereas CC041 and CC043 were sensitive strains [Citation21]. Based on the gene expression analysis of the 42 inversely methylated and expressed genes, we selected six genes, Gls2, Apoa4, E2f1, Sulf2, Abcg8, and Apom, the expression of which was significantly altered in at least three of the six (CC011, CC013, CC019, CC041, CC042, and CC043) strains, for further analysis. We found that the average expression of all these genes was greatly altered, two genes, Gls2 and Apom, being down-regulated and four genes, Apoa4, E2f1, Sulf2, and Abcg8, being up-regulated, in the livers of male CC041, CC042, and CC043 mice, strains that are sensitive to HF/HS diet-induced liver injury (). In contrast, no difference in their expression was found in the livers of CC011, CC013, and CC019 mice, strains that are resistant to NAFL-like liver injury, except Abcg8 gene that was significantly over-expressed in the livers of the resistant strains (). Two genes, Gls2 and Apom, were slightly down-regulated in the livers of HF/HS-diet fed female mice ().
Figure 3. Identification of critical NAFLD-related and DMR-containing genes in the livers of male and female CC011, CC013, CC019, CC041, CC042, and CC043 mouse strains. (a) Algorithm of identification of NAFLD-related differentially expressed and DMR-containing genes in the livers of male and female mice. The relative expression of Gls2, Apoa4, E2f1, Sulf2, Abcg8, and Apom in the livers of resistant (CC011, CC013, CC019) and sensitive (CC041, CC042, CC043) mice fed a HF/HS diet compared to control diet. (b) male mice, (c) female mice. * Significant (p < 0.05; Mann-Whitney Rank Sum test) difference in gene expression in the livers of mice fed a HF/HS diet compared to control diet.
Analysis of DNA methylation of these genes showed an inverse correlation between the extent of DNA methylation of Gls2, Apoa4, E2f1, Sulf2, and Apom and their expression in the livers of NAFL-prone male CC042 mice, with the Gls2 and Apom genes being hypermethylated and the Apoa4, E2f1, and Sulf2 genes being hypomethylated (Supplementary Table 4). In contrast, no methylation changes, except hypomethylation of Abcg8, were found in male CC011 mice fed the HF/HS diet (Supplementary Table 4). We also did not find significant changes in DNA methylation in Gls2, Apoa4, E2f1, Sulf2, Abcg8, or Apom genes in the livers of female CC011 and CC042 mice (data not shown).
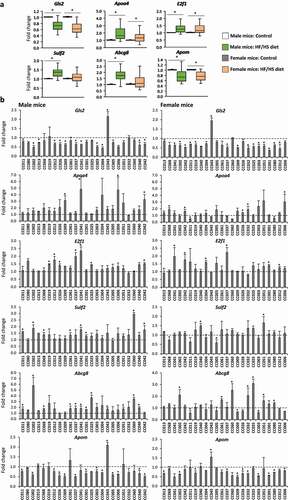
Finally, we investigated the expression of these six genes at the population level in the 24 male and female CC mouse strains using a single-gene qRT-PCR approach. The most notable changes in gene expression at the population level, based on an average fold change, were an over-expression of Apoa4 and E2f1 and reduced expression of Gls2 and Apom in the livers of male and female mice (), while increased expression of Sulf2 and Abcg8 was found only in the livers of male mice. The magnitude of inter-strain changes in gene expression substantially varied between strains and sexes () with the most notable changes being a reduced expression of Gls2, found in 12 and 14 of the individual male and female CC strains, and Apom4, found in 13 and 10 individual male and female CC strains. Correlation analysis between the absolute level of gene expression and osmium staining in the livers of CC mice fed an HF/HS diet showed significant association between Apoa4 expression and extent of lipid accumulation in the livers of male CC mice fed the HF/HS diet (Supplementary Figure 2).
Figure 4. Expression of NAFLD-related and DMR-containing genes in the livers of CC mouse strains. (a) Box and whisker plots representing the relative expression of Gls2, Apoa4, E2f1, Sulf2, Abcg8, and Apom in the livers of 24 male and female CC mouse strains fed a HF/HS diet compared to control diet. (b) Strain-specific changes in expression of Gls2, Apoa4, E2f1, Sulf2, Abcg8, and Apom genes in the livers of male and female CC mice fed a HF/HS diet. Gene expression was measured by qRT-PCR. The results of gene expression are presented as an average fold change in the livers of CC mice fed a HF/HS diet relative to respective values of CC mice fed a control diet, which were assigned a value 1 (dashed line).
DMR-associated gene expression changes in an in vitro model of diet-induced steatosis and in human NAFL livers
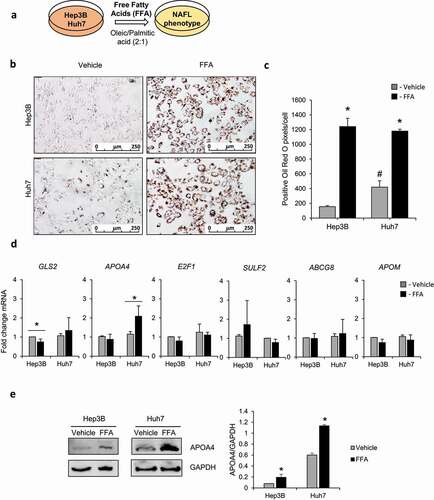
To investigate the consequences of alterations in expression of the DMR-containing genes (i.e., Gls2, Apoa4, E2f1, Sulf2, Abcg8, and Apom) found in the livers of CC mice fed the HF/HS diet, we utilized an in vitro model of diet-induced hepatic steatosis. Specifically, human Hep3B and Huh7 cells, liver cell lines with different genetic backgrounds, were cultured with oleic acid and palmitic acid for 7 days (), which resulted in substantial intracellular lipid accumulation compared to vehicle-treated control cells ( and 5c). Using this model, we analysed the expressions of GLS2, APOA4, E2F1, SULF2, ABCG8, and APOM genes (). Similar to the gene expression changes observed in CC mice after feeding the HF/HS diet ( and 4b), the level of APOA4 mRNA was elevated in the oleic and palmitic acid-treated Huh7 cells (), and the level of APOA4 protein was increased by 2.4- and 1.9-fold in Hep3B and Huh7 cells, respectively (). The expression of GLS2 was slightly, but significantly, decreased in Hep3B cells after treatment with oleic and palmitic acids compared to vehicle-treated control cells ().
Figure 5. Gene expression of NAFLD-related genes using an in vitro model of steatosis. (a) Schematic of NAFLD in vitro model using human liver cell lines Hep3B and Huh7 treated with oleic acid and palmitic acid. (b) Representative images of Oil Red O staining of Hep3B and Huh7 cells treated with the vehicle (DMSO) or oleic and palmitic acid (FFA). (c) Positive Oil Red O pixels count in vehicle- or oleic and palmitic acid-treated Hep3B and Huh7 cells. n = 4, error bars denote standard deviation. Significant (p < 0.01; Student’s t-test) difference between FFA- and vehicle-treated cells. # Significant (p < 0.01; Student’s t-test) difference between vehicle treated cells; and (d) Expression of GLS2, APOA4, E2F1, SULF2, ABCG8, and APOM genes in Hep3B and Huh7 oleic and palmitic acid-treated cells as determined by quantitative real-time PCR analysis. Average from n = 3, error bars denote standard deviation. * denotes p value <0.05. * Significant (p < 0.05; Student’s t-test) difference between FFA- and vehicle-treated cells. (e) Western blot analysis of APOA4 protein expression in Hep3B and Huh7 oleic and palmitic acid- or vehicle-treated cells. Western blot quantification in fold change APOA4 levels standardized to GAPDH. * Significant (p < 0.05; Student’s t-test) difference between FFA- and vehicle-treated cells.
Next, using a publicly available dataset [GSE126848; 30], we analysed the expression of the GLS2, APOA4, E2F1, SULF2, ABCG8, and APOM genes in the livers of male NAFL patients and individuals with normal liver histology. We observed significant downregulation of the GLS2 gene and upregulation of the E2F1 gene in the livers of NAFL patients (Supplementary Figure 3).
Discussion
NAFLD is a highly prevalent liver disease and a global health problem, with approximately 1.5 billion people being affected [Citation1,Citation2]. NAFLD is strongly associated with obesity and metabolic syndrome, but other factors, including dysregulated epigenetic mechanisms, also contribute to the development and progression of the disease [Citation6–8]. Important unknowns in the NAFLD epidemic are the determinants of the interpatient variation in the severity and stratification of the disease, and molecular and pathological drivers of its progression. A more complete understanding of these is critical to establishing potential diagnostic and therapeutic targets for NAFLD. In this study, we investigated DNA methylome alterations in CC011 and CC042 HF/HS diet-fed mice, strains characterized by differences in the severity of NAFL-like liver injury and present several important findings about the relationship between DNA alterations and severity of NAFL-like liver injury.
First, we show that CC mice that have a severe NAFL-like phenotype can be distinguished from CC mice with a mild NAFL phenotype by their genomic DNA methylation profiles. This was evidenced by the fact that NAFL-prone male CC042 mice fed the HF/HS diet had a considerably greater number of DMRs as compared to male CC011 mice and female CC011 and CC042 mice. More importantly, we observed a marked difference in the patterns of DNA methylation. While the development of NAFL in both mouse strains was accompanied by genomic DNA hypomethylation and DNA hypermethylation events, male CC042 mice were characterized by extensive genome-wide DNA hypermethylation changes, while predominant genome-wide DNA hypomethylation changes were observed in male CC011 mice and female CC011 and CC042 mice. This pattern is in good agreement with our previous report [Citation33] demonstrating that the development of severe NAFLD-like liver injury in male WSB/EiJ mice, induced by feeding a choline- and folate-deficient diet for 12 weeks, was accompanied by extensive genomic DNA hypermethylation, whereas DNA hypomethylation was found in A/J male mice, a strain characterized by mild NAFLD-like liver injury.
Next, by applying a pathway enrichment analysis of DMR-associated genes following combined analysis of DNA methylation of DMR-containing genes and their expression, we identified several genes (two hypermethylated genes, Gls2 and Apom, and four hypomethylated genes Apoa4, E2f1, Sulf2, and Abcg8) exhibiting an inverse correlation between gene-specific methylation and gene expression in the livers of NAFL-like sensitive male CC042 mice, whereas only a slight decrease in the extent of Gls2 and Apom expression and no changes in the methylation profiles of these genes was found in the livers of HF/HS diet-fed female mice. Furthermore, the expression of these genes in the livers of male mice from other mouse strains, characterized by the prominent NAFL-like liver injury, differed markedly from their expression in the livers of male mice from less vulnerable mouse strains.
Two genes, Gls2 and Apom, in addition to being hypermethylated in male CC042, were markedly down-regulated at the population level and in the majority of male and female CC mouse strains. The Gls2 gene encodes phosphate-activated glutaminase 2, a rate-controlling liver-type mitochondrial glutaminase that catalyses the hydrolysis of glutamine to glutamate. Recently, Du et al. [Citation34] induced NAFLD by feeding C57BL/6 mice a Western diet for 16 weeks, a choline-deficient, L-amino acid-defined high-fat diet for 12 or 22 weeks, or a methionine/choline-deficient diet supplemented with 0.15% ethionine for 3 weeks and demonstrated a marked reduction of the GLS2 protein in liver. Likewise, Simon et al. [Citation35] showed that feeding male C57BL/6 mice a 0.1% methionine/choline devoid diet for 2 or 4 weeks reduced hepatic Gls2 mRNA and GLS2 protein levels. Furthermore, Liu et al. [Citation36] reported DNA hypermethylation-associated decreased expression of GLS2 in human hepatocellular carcinoma.
The Apom gene, a member of the apolipoprotein family, is also primarily expressed in the liver [Citation37]. Similar to our finding, several studies have reported down-regulation of Apom in experimental and clinical NAFLD. In particular, Thymiakou et al. [Citation38] found a pronounced reduction of Apom expression in the steatotic livers of liver-specific Hnf4 KO mice, and Niu et al. [Citation39] demonstrated a 25% reduction of APOM in patients with NAFLD and type 2 diabetes. These reports indicate the involvement of Apom in the pathogenesis of NAFLD. This suggestion is supported by the results of two recent studies [Citation40,Citation41] showing the development of spontaneous liver steatosis in ApoM-knockout mice.
The Apoa4 gene was the only gene that was hypomethylated and markedly over-expressed in the livers of CC mouse strains sensitive to NAFL-like liver injury. Apoa4 encodes apolipoprotein A-IV, a 46-kDa lipid-binding protein that plays a critical role in the regulation of lipid and glucose metabolism [Citation42]. Our findings of hypomethylation and over-expression of Apoa4 in NAFL are in good agreement with previous reports of an increased expression of Apoa4 in different transgenic [Citation43,Citation44] and dietary models of NAFLD [Citation39,Citation45]. Furthermore, the over-expression of APOA4 was demonstrated in human steatotic livers [Citation44] during the initial stage of liver fibrosis [Citation46] and in NASH-derived hepatocellular carcinoma [Citation47].
Finally, using an in vitro model of diet-induced hepatic steatosis, we demonstrate a similar pattern of expression of these genes, especially APOA4 and GLS2, in human liver cell lines compared to the pattern found in the livers of CC mice fed the HF/HS diet. More importantly, the expression of GLS2 was decreased in the livers of male patients with NAFL. In contrast to the gene expression alterations found in the livers of mice fed the HF/HS diet, we did not find significant changes in the expression of APOA4, SULF2, ABCG8, and APOM genes in male human NAFL patients, using a publicly available dataset [GSE126848]. This result may be due to the small number of patients; however, down-regulation of APOM and up-regulation of APOA4 were reported in studies with a larger NAFL patient cohort [Citation39,Citation44,Citation46].
There are a few limitations in this study. A one-time snapshot of DNA methylation changes does not allow the identification of unique disease-driving alterations and their functional role in the formation of NAFLD-specific phenotypes as opposed to transitory passenger DNA methylation alterations. Another limitation is associated with the translational applicability of NAFLD/NASH animal models to human NAFLD [Citation18,Citation48]. Even though it has been demonstrated that the nutritional HF/HS diet model NAFLD/NASH we used in the present study represents all the pathophysiological, metabolic, histological, transcriptomic, and clinical features of human disease [Citation49] and is applicable to study the susceptibility and interindividual and sex-specific variabilities in the pathogenesis and progression of NAFL at the population level [Citation22], further research is needed to validate our findings at the broader genetically diverse population. Despite these limitations, we were able to demonstrate that alterations in hepatic DNA methylation are an early pathophysiological event in the development of NAFLD and may be an important contributing factor for the formation of NAFLD phenotype. Furthermore, the results of our study demonstrate an association between the severity of NAFLD and the magnitude of genome-wide DNA methylation changes. In addition, we identified that the Gls2, Apoa4, and Apom genes were differentially methylated and expressed in the livers of NAFL-prone mice. More importantly, these genes were differentially expressed at the population level and were independent of genetic background and sex. This indicates that evaluation of the expression and DNA methylation status of these genes can be potentially applied for the diagnosis of NAFLD, especially its severity, in a genetically diverse population.
List of abbreviation
CC: Collaborative Cross; HCC: hepatocellular carcinoma; HF/HS: high fat and high sucrose; NAFL: nonalcoholic fatty liver; NAFLD: nonalcoholic fatty liver disease; NASH: nonalcoholic steatohepatitis; DMRs: differentially methylated regions; NGS: next-generation sequencing.
Disclosure statement
Arun J. Sanyal is the President of Sanyal Biotechnology, LLC, and has stock options in Genfit, Akarna, Tiziana, Indalo, and Durect. He has served as a consultant to AbVie, Astra Zeneca, Nitto Denko, Ardelyx, Conatus, Nimbus, Amarin, Salix, Tobira, Takeda, Fibrogen, Jannsen, Gilead, Boehringer, Lilly, Zafgen, Novartis, Novo Nordisk, and Pfizer. He has served as an unpaid consultant to Exhalenz, Intercept, Echosens, Immuron, Galectin, Fractyl, Northsea Pharma, Gencia, Syntlogic, Affimune, Chemomab, Nordic Bioscience Zydus, and Bristol Myers Squibb. His institution has received grant support from Gilead, Salix, Tobira, Bristol Myers, Shire, Intercept, Merck, Astra Zeneca, Malinckrodt, Cumberland, and Novartis. He receives royalties from Elsevier and UptoDate. Virginia Commonwealth University has ownership interests in Sanyal Biotechnology, LLC.
Data availability statement
The data that support the findings of this study are available in Gene Expression Omnibus depository at https://www.ncbi.nlm.nih.gov/geo/, reference numbers GSE149863 and GSE126848. These data were derived from the following resources available in the public domain: https://www.ncbi.nlm.nih.gov/geo/query/acc.cgi?acc=GSE149863 and https://www.ncbi.nlm.nih.gov/geo/query/acc.cgi?acc=GSE126848. Any additional data that support the findings of this study are available from the corresponding author, IP, upon request.
Additional information
Funding
References
- Younossi Z, Tacke F, Arrese M, et al. Global perspectives on nonalcoholic fatty liver disease and nonalcoholic steatohepatitis. Hepatology. 2019;69(6):2672–2682.
- Estes C, Razavi H, Loomba R, et al. Modeling the epidemic of nonalcoholic fatty liver disease demonstrates an exponential increase in burden of disease. Hepatology. 2018;67(1):123–133.
- Friedman SL, Neuschwander-Tetri BA, Rinella M, et al. Mechanisms of NAFLD development and therapeutic strategies. Nat Med. 2018;24(7):908–922.
- Sanyal AJ. Past, present and future perspectives in nonalcoholic fatty liver disease. Nat Rev Gastroenterol Hepatol. 2019;16(6):377–386.
- Eslam M, Sanyal AJ, George J, et al. MAFLD: a consensus-driven proposed nomenclature for metabolic associated fatty liver disease. Gastroenterology. 2020;158(7):1999–2014.
- Eslam M, Valenti L, Romeo S. Genetics and epigenetics of NAFLD and NASH: clinical impact. J Hepatol. 2018;68(2):268–279.
- Sinton MC, Hay DC, Drake AJ. Metabolic control of gene transcription in non-alcoholic fatty liver disease: the role of the epigenome. Clin Epigenetics. 2019;11(1):104.
- Cespiati A, Youngson NA, Tourna A, et al. Genetics and epigenetics in the clinic: precision medicine in the management of fatty liver disease. Curr Pharm Des. 2020;26(10):998–1009.
- Pirola CJ, Gianotti TF, Burgueño AL, et al. Epigenetic modification of liver mitochondrial DNA is associated with histological severity of nonalcoholic fatty liver disease. Gut. 2013;62(9):1356–1363.
- Baumeier C, Saussenthaler S, Kammel A, et al. Hepatic DPP4 DNA methylation associates with fatty liver. Diabetes. 2017;66(1):25–35.
- Wegermann K, Henao R, Diehl AM, et al. Branched chain amino acid transaminase 1 (BCAT1) is overexpressed and hypomethylated in patients with non-alcoholic fatty liver disease who experience adverse clinical events: a pilot study. PLoS One. 2018;13(9):e0204308.
- Loomba R, Gindin Y, Jiang Z, et al. DNA methylation signatures reflect aging in patients with nonalcoholic steatohepatitis. JCI Insight. 2017;2:e96685.
- Murphy SK, Yang H, Moylan CA, et al. Relationship between methylome and transcriptome in patients with nonalcoholic fatty liver disease. Gastroenterology. 2013;145(5):1076–1087.
- Hotta K, Kitamoto A, Kitamoto T, et al. Identification of differentially methylated region (DMR) networks associated with progression of nonalcoholic fatty liver disease. Sci Rep. 2018;8:13567.
- Hoang SA, Oseini A, Feaver RE, et al. Gene expression predicts histological severity and reveals distinct molecular profiles of nonalcoholic fatty liver disease. Sci Rep. 2019;9(1):12541.
- Govaere O, Cockell S, Tiniakos D, et al. Transcriptomic profiling across the nonalcoholic fatty liver disease spectrum reveals gene signatures for steatohepatitis and fibrosis. Sci Transl Med. 2020;12(572):eaba4448.
- Santhekadur PK, Kumar DP, Sanyal AJ. Preclinical models of non-alcoholic fatty liver disease. J Hepatol. 2018;68(2):230–237.
- Farrell G, Schattenberg JM, Leclercq I, et al. Mouse models of nonalcoholic steatohepatitis: toward optimization of their relevance to human nonalcoholic steatohepatitis. Hepatology. 2019;69(5):2241–2257.
- Borowa-Mazgaj B, de Conti A, Tryndyak V, et al. Gene expression and DNA methylation alterations in the glycine N-methyltransferase gene in diet-induced nonalcoholic fatty liver disease-associated carcinogenesis. Toxicol Sci. 2019;170(2):273–282.
- Cazanave S, Podtelezhnikov A, Jensen K, et al. The transcriptomic signature of disease development and progression of nonalcoholic fatty liver disease. Sci Rep. 2017;7(1):17193.
- Dreval K, Tryndyak V, de Conti A, et al. Gene expression and DNA methylation alterations during non-alcoholic steatohepatitis-associated liver carcinogenesis. Front Genet. 2019;10:486.
- de Conti A, Tryndyak V, Willett RA, et al. Characterization of the variability in the extent of nonalcoholic fatty liver induced by a high-fat diet in the genetically diverse Collaborative Cross mouse model. FASEB J. 2020;34(6):7773–7785.
- Threadgill DW, Miller DR, Churchill GA, et al. The Collaborative Cross: a recombinant inbred mouse population for the systems genetic era. ILAR J. 2011;52(1):24–31.
- Saul MC, Philip VM, Reinholdt LG, et al. High-diversity mouse populations for complex traits. Trends Genet. 2019;35(7):501–514.
- Bolger AM, Lohse M, Usadel B. Trimmomatic: a flexible trimmer for Illumina sequence data. Bioinformatics. 2014;30(15):2114–2120.
- Krueger F, Andrews SR. Bismark: a flexible aligner and methylation caller for Bisulfite-Seq applications. Bioinformatics. 2011;27(11):1571–1572.
- Trapnell C, Pachter L, Salzberg SL. TopHat: discovering splice junctions with RNA-Seq. Bioinformatics. 2009;25(9):1105–1111.
- Trapnell C, Williams BA, Pertea G, et al. Transcript assembly and quantification by RNA-Seq reveals unannotated transcripts and isoform switching during cell differentiation. Nat Biotechnol. 2010;28(5):511–515.
- Schmittgen TD, Livak KJ. Analyzing real-time PCR data by the comparative CT method. Nat Protoc. 2008;3(6):1101–1108.
- Suppli MP, Rigbolt KTG, Veidal SS, et al. Hepatic transcriptome signatures in patients with varying degrees of nonalcoholic fatty liver disease compared with healthy normal-weight individuals. Am J Physiol Gastrointest Liver Physiol. 2019;316(4):G462–G472.
- Tryndyak VP, Han T, Muskhelishvili L, et al. Coupling global methylation and gene expression profiles reveal key pathophysiological events in liver injury induced by a methyl-deficient diet. Mol Nutr Food Res. 2011;55(3):411–418.
- Tryndyak V, de Conti A, Doerge DR, et al. Furan-induced transcriptomic and gene-specific DNA methylation changes in the livers of Fischer 344 rats in a 2-year carcinogenicity study. Arch Toxicol. 2017;91(3):1233–1243.
- Tryndyak VP, Han T, Fuscoe JC, et al. Status of hepatic DNA methylome predetermines and modulates the severity of non-alcoholic fatty liver injury in mice. BMC Genomics. 2016;17(1):298.
- Du K, Chitneni SK, Suzuki A, et al. Increased glutaminolysis marks active scarring in nonalcoholic steatohepatitis progression. Cell Mol Gastroenterol Hepatol. 2020;10(1):1–21.
- Simon J, Nuñez-García M, Fernández-Tussy P, et al. Targeting hepatic glutaminase 1 ameliorates non-alcoholic steatohepatitis by restoring very-low-density lipoprotein triglyceride assembly. Cell Metab. 2020;31(3):605–622.
- Liu J, Zhang C, Lin M, et al. Glutaminase 2 negatively regulates the PI3K/AKT signaling and shows tumor suppression activity in human hepatocellular carcinoma. Oncotarget. 2014;5(9):2635–2647.
- Chen Z, Hu m. The apoM-S1P axis in hepatic diseases. Clin Chim Acta. 2020;511:235–242.
- Thymiakou E, Othman A, Hornemann T, et al. Defects in high density lipoprotein metabolism and hepatic steatosis in mice with liver-specific ablation of hepatocyte nuclear factor 4A. Metabolism. 2020;110:154307.
- Niu L, Geyer PE, Wewer Albrechtsen NJ, et al. Plasma proteome profiling discovers novel proteins associated with non-alcoholic fatty liver disease. Mol Syst Biol. 2019;15(3):e8793.
- Zhang X, Zhang P, Gao J, et al. Autophagy dysregulation caused by ApoM deficiency plays an important role in liver lipid metabolic disorder. Biochem Biophys Res Commun. 2018;495(4):2643–2648.
- Shi Y, Lam SM, Liu H, et al. Comprehensive lipidomics in apoM−/− mice reveals an overall state of metabolic distress and attenuated hepatic lipid secretion into the circulation. J Genet Genomics. 2020;47(9):523–534.
- Wang F, Kohan AB, C-M L, et al. Apolipoprotein A-IV: a protein intimately involved in metabolism. J Lipid Res. 2015;56(8):1403–1418.
- VerHague MA, Cheng D, Weinberg RB, et al. Apolipoprotein A-IV expression in mouse liver enhances triglyceride secretion and reduces hepatic lipid content by promoting very low density lipoprotein particle expansion. Arterioscler Thromb Vasc Biol. 2013;33(11):2501–2508.
- Kang M, Kim J, H-T A, et al. Human leucine zipper protein promotes hepatic steatosis via induction of apolipoprotein A-IV. FASEB J. 2017;31(6):2548–2561.
- Kim H, Worsley O, Yang E, et al. Persistent changes in liver methylation and microbiome composition following reversal of diet-induced non-alcoholic-fatty liver disease. Cell Mol Life Sci. 2019;76(21):4341–4354.
- Wang P-W, Hung Y-C, T-H W, et al. Proteome-based identification of apolipoprotein A-IV as an early diagnostic biomarker in liver fibrosis. Oncotarget. 2017;8(51):88951–88964.
- Dechassa ML, Tryndyak V, de Conti A, et al. Identification of chromatin-accessible domains in non-alcoholic steatohepatitis-derived hepatocellular carcinoma. Mol Carcinog. 2018;57(8):978–987.
- Asgharpour A, Cazanave SC, Pacana T, et al. A diet-induced animal model of non-alcoholic fatty liver disease and hepatocellular cancer. J Hepatol. 2016;65(3):579–588.
- Nevzorova YA, Boyer-Diaz Z, Cubero FJ, et al. Animal models for liver disease – a practical approach for translational research. J Hepatol. 2020;73(2):423–440.