
ABSTRACT
Hepatocellular carcinoma (HCC) is mostly triggered by environmental and life-style factors and may involve epigenetic aberrations. However, a comprehensive documentation of the link between the dysregulated epigenome, transcriptome, and liver carcinogenesis is lacking. In the present study, Fischer-344 rats were fed a choline-deficient (CDAA, cancer group) or choline-sufficient (CSAA, healthy group) L-amino acid-defined diet. At the end of 52 weeks, transcriptomic alterations in livers of rats with HCC tumours and healthy livers were investigated by RNA sequencing. DNA methylation and gene expression were assessed by pyrosequencing and quantitative reverse-transcription PCR (qRT-PCR), respectively. We discovered 1,848 genes that were significantly differentially expressed in livers of rats with HCC tumours (CDAA) as compared with healthy livers (CSAA). Upregulated genes in the CDAA group were associated with cancer-related functions, whereas macronutrient metabolic processes were enriched by downregulated genes. Changes of highest magnitude were detected in numerous upregulated genes that govern key oncogenic signalling pathways, including Notch, Wnt, Hedgehog, and extracellular matrix degradation. We further detected perturbations in DNA methylating and demethylating enzymes, which was reflected in decreased global DNA methylation and increased global DNA hydroxymethylation. Four selected upregulated candidates, Mmp12, Jag1, Wnt4, and Smo, demonstrated promoter hypomethylation with the most profound decrease in Mmp12. MMP12 was also strongly overexpressed and hypomethylated in human HCC HepG2 cells as compared with primary hepatocytes, which coincided with binding of Ten-eleven translocation 1 (TET1). Our findings provide comprehensive evidence for gene expression changes and dysregulated epigenome in HCC pathogenesis, potentially revealing novel targets for HCC prevention/treatment.
Introduction
Hepatocellular carcinoma (HCC) is the most prevalent primary liver cancer. It is among most commonly diagnosed cancers (~1 M cases/year) in the world, and the 3rd leading cause of cancer death worldwide[Citation1], [Citation2]. In the US and Canada, HCC has one of the fastest rising incidence rates amongst all cancers in the last two decades [Citation2]. Due to late onset of symptoms, the majority of patients are diagnosed at advanced stages, with a 5-year survival rate of only 3% [Citation3]. Identification of new effective strategies to prevent or delay liver cancer development is critical, however, these solutions are only possible upon understanding HCC biology.
HCC is mostly triggered by environmental and life-style factors, including hepatitis B/C infection, excessive alcohol intake, smoking, aflatoxin-contaminated food, and diets low in fruits and vegetables [Citation4–6]. Recent evidence also indicates that body fatness is causally linked to liver cancer [Citation7,Citation8]. The connection between HCC and imbalanced diet and body fatness may be attributed to metabolic disturbances, which mediate epigenetic aberrations [Citation9]. Indeed, alterations in the epigenome have been shown to play a critical role in HCC [Citation4–6,Citation9–17].
Epigenetics refers to mechanisms of regulating gene expression without changes in the underlying DNA sequence, which includes DNA methylation, covalent histone modifications, chromatin remodelling complexes, nucleosome positioning, and non-coding RNA mechanisms [Citation18]. Although histone modifications, together with DNA-binding complexes, may signal changes in chromatin structure, DNA methylation acts by eventually stabilizing gene transcription and thus providing stable long-term regulation [Citation18]. DNA methylation is regulated by methylating (i.e., DNA methyltransferases, DNMTs) and demethylating enzymes (i.e., Ten-Eleven Translocation, TET proteins) [Citation19,Citation20]. Importantly, DNA methylation within gene regulatory regions, such as promoters and enhancers, is associated with gene silencing. In contrast, loss of DNA methylation within those regions may cause gene activation [Citation12,Citation19,Citation21]. Aberrations in DNA methylation patterns have been linked to cancer initiation, progression, and metastasis [Citation12,Citation19]. Hypermethylation and silencing of tumour suppressor genes, and hypomethylation and activation of oncogenes and pro-metastatic genes, have been described in tumours from nearly all types of cancer, including HCC [Citation12,Citation14,Citation21–24].
Before genome-wide technologies were developed, researchers were already reporting on the role of DNA methylation in HCC in connection to the environmental nature of HCC aetiology [Citation25–30]. Ethanol intake or methyl donor-deficient diets in rodents, for instance, were documented to decrease global levels of DNA methylation and lead to liver cirrhosis and HCC [Citation4,Citation11,Citation15,Citation31–33]. Hepatic levels of the ubiquitous methyl donor S-adenosylmethionine (SAM) were also decreased during liver carcinogenesis and coincided with a decreased ratio of SAM to S-adenosylhomocysteine (SAH) [Citation4,Citation11,Citation15,Citation31–33]. SAH, which is produced after SAM donates a methyl group, is a known inhibitor of methyltransferases [Citation34]. Thus, the SAM/SAH ratio is often used as an indicator of perturbations in DNA methylation machinery. Importantly, dysregulated SAM biosynthesis has been detected in human HCC and other liver diseases [Citation35].
Studies using omics approaches, including our work, re-enforced the role of epigenetics in HCC [Citation12–14,Citation21–24,Citation36]. We established, for the first time, an epigenomic-transcriptomic signature of human HCC and a functional map of this signature [Citation12]. Aberrant DNA methylation within certain genes was proposed to serve as a biomarker for early HCC detection [Citation13,Citation24], and targeting some of the differentially methylated genes was mechanistically shown to exert anti-cancer effects [Citation14,Citation21,Citation36]. Despite all the pieces of evidence for the role of epigenetics in HCC, a comprehensive investigation of the link between the dysregulated epigenome, transcriptome, and liver carcinogenesis remains to be undertaken. Such knowledge is essential to develop effective treatments and preventive approaches in HCC.
In the current study, we have therefore provided a comprehensive documentation of transcriptome perturbations in a rat model of human HCC where Fischer-344 (F344) rats chronically exposed to a choline-deficient diet develop hyperplastic nodules, liver cirrhosis and HCC tumours within a 52-week exposure [Citation37]. Using RNA sequencing technology (RNA-seq), we have identified genes, processes, and pathways that are altered in livers of rats with HCC tumours as compared to healthy livers, and thus could be potentially relevant to HCC development and progression. Interestingly, we have detected higher amounts of genes that were upregulated and these genes were also characterized by higher magnitudes of changes compared to downregulated genes and fell into oncogenic functional categories. Previous studies in HCC patients, HCC cell lines, and in various models of HCC, including choline-deficiency-, methyl-donor-deficiency- and carcinogen-driven tumours, have demonstrated remodelling of the DNA methylation patterns and/or upregulation and hypomethylation of candidate oncogenes as important characteristics of liver carcinogenesis [Citation11–14,Citation17,Citation21,Citation24,Citation38]. Therefore, we have further investigated whether transcriptional upregulation of the candidate oncogenes was accompanied by alterations in DNA methylation status in our in vivo HCC model. We have found a decrease in DNA methylation at gene promoters of key upregulated players in oncogenic signalling. Further mechanistic studies in human cells have shown TET1 binding within MMP12 promoter; a promoter that was the most profoundly demethylated in HCC tumours.
Materials and methods
Rat model
Animals and experimental timeline
F344 rats were housed 2 per cage in a temperature-controlled (24°C) room with a 12-h light/dark cycle, and given ad libitum access to water and food. Rats arrived at the animal facility at 4 weeks of age. During the 4-week acclimation period, all rats were fed a choline sufficient L-amino acid defined (CSAA) diet. Following acclimation, the rats were randomly assigned the 2 experimental groups, Group 1: CSAA and Group 2: choline deficient L-amino acid defined (CDAA) (n = 6 per experimental group). CSAA diet and CDAA diet were purchased and pelleted by Dyets Inc., Bethlehem, PA, USA. Food consumption and body weight was measured every week throughout the 52-week timeline. Rats were sacrificed, using exposure to carbon dioxide followed by cervical dislocation, at 52 weeks post methyl donor-deficient diet start point. Tumour samples (or nodules, or liver tissue in case no tumours were observed) were collected to determine histological changes and tumour grade, and to isolate DNA and RNA for further analyses. Nodule/tumour volume was measured using the formula: tumour volume = (length × width2)/2. DNA was processed for bisulphite conversion and pyrosequencing in order to estimate DNA methylation of target genes. RNA was used for RNA-seq and qRT-PCR to test gene expression.
Rats were treated strictly following the animal use protocol #1,112,000,342 approved by the Institutional Animal Care and Use Committee at the involved institutions.
Histopathological analysis
Four micrometre tissue sections were stained with haematoxylin and eosin, and a board-certified veterinary pathologist microscopically examined the slides. The interpretations were based on standard histopathological morphologies. The pathologist was blinded to the diet treatment.
Human cell culture and invasion assay
Human HCC HepG2 cells were purchased from ATCC (HB8065) and human untransformed hepatocytes (normal hepatocytes, NorHep) were obtained from Celprogen (33,003–02). HepG2 cells were maintained in MEM medium (Gibco) supplemented with 2 mM glutamine (Sigma-Aldrich), 10% foetal bovine serum (FBS, Gibco), 1 U/ml penicillin and 1 µg/ml streptomycin (Gibco). NorHep cells were maintained in human hepatocyte cell culture complete medium (Celprogen). Cells were grown in a humidified atmosphere of 5% carbon dioxide at 37°C. Cells were plated at a density of 4–5 × 10⁵ per a 10-cm tissue culture dish on day 1, followed by 4-day culture until 80% confluency (day 2–5).
The ability of HepG2 and NorHep cells to invade through extracellular matrix was evaluated by Boyden chamber invasion assay using the Cell Invasion Assay Kit (Chemicon Int.), as we previously described [Citation21]. Briefly, inserts with 50,000 cells in serum-free media were dipped in lower chambers filled with complete media. Following 24-hour incubation at 37°C, cells that invaded through the matrix of inserts were stained and counted under the microscope.
Western blot analysis
Total proteins were extracted using RIPA buffer. Following electrophoresis in fast cast SDS-PAGE gels (Bio-Rad), the separated proteins were transferred onto a TransBlot Turbo Polyvinylidene Fluoride (PVDF) membrane using a Trans-Blot Turbo Transfer System (Bio-Rad). ChemiDoc imaging system (Bio-Rad) was then used to verify transfer of proteins onto PVDF membranes, followed by blocking the membranes in EveryBlot Blocking Buffer. Membranes were subsequently incubated overnight at 4°C with the primary polyclonal antibody, anti-MMP12 (1:1000; AB6010, Millipore), and then for 1 h at room temperature with secondary antibody horseradish peroxidase-conjugated goat anti-rabbit IgG (1:2000; 7074, Cell Signalling Technology). After incubation, pictures were taken in ChemiDoc imaging system to visualize total protein content which is used as a loading control for protein normalization, as we previously described [Citation39]. The Clarity Western ECL Substrate (Bio-Rad) was applied on the membranes and chemiluminescent signal was acquired on ChemiDoc MP (Bio-Rad). Densitometry of band intensities was measured in Image Lab software (Bio-Rad).
RNA isolation and quantitative reverse-transcription PCR (qRT-PCR)
Total RNA was isolated from rat liver tissues and cell cultures using TRIzol (Invitrogen) followed by cDNA synthesis using AMV reverse transcriptase (Roche Diagnostics), according to the manufacturer’s protocol. CFX96 Touch Real-Time PCR Detection System (Bio-Rad) was used to amplify target sequences using 2 µl of cDNA as a template, 400 nM forward and reverse primers (please see Supplementary Table S1A for sequences), and 10 µl of SsoFast EvaGreen Supermix (Bio-Rad) in a final volume of 20 µl. The amplification reaction included denaturation at 95°C for 10 min, amplification for 60 cycles at 95°C for 10s, annealing temperature for 10s, 72°C for 10s, and final extension at 72°C for 10 min. The CFX Maestro Software (Bio-Rad) was used to quantify gene expression with a standard curve-based analysis. Quantitative RT-PCR data are presented as gene of interest/GAPDH (reference gene).
RNA sequencing (RNA-seq)
Total RNA was extracted from rat liver tissue samples collected at the end of the 52-week study using TRIzol (Invitrogen). Quality check was performed using an Agilent Bioanalyzer prior to library preparation. Libraries were prepared from four rats from each diet group, CSAA and CDAA, using the TruSeq Stranded kit (Illumina, San Diego, CA, USA) and sequenced four rats per lane using the HiSeq2500 on high-throughput mode (1x50 bp reads). Reads were quality trimmed and Illumina TruSeq adapter sequences were removed. FastQC and FastX were run to ensure quality of data before and after trimming. Reads were aligned to the rat rn6 reference genome using Tophat2 [Citation40]. Bioconductor packages Cufflinks, DESeq2, and EdgeR were used for differential expression analysis [Citation41–43]. Differentially expressed genes that appeared in results of all three packages were deemed robust to the choice of statistical model selected and were considered in our analyses. RNA sequencing data are available in Gene Expression Omnibus (GEO, accession number: GSE199443).
Measurement of SAM/SAH levels by liquid chromatography-mass spectrometry (LC-MS)
For quantification, stock solutions of SAM and SAH were prepared using powders from Sigma-Aldrich (cat. no. A9384 and A4377, respectively). The stocks were pooled and diluted in acetonitrile:water (ACN:H2O) (1:1, v/v) to a set of eight calibration standards for interpolation of liver sample concentrations. Internal standards of deuterated versions, SAM-d3 and SAH-d4, were purchased from CDN Isotopes (product no. D-4093) and Cayman Chemical (item no. 9,000,372), respectively. Internal standard solutions were pooled at final concentrations of 50 µM SAM-d3 and 75 µM SAH-d4 in ACN:H2O (1:1, v/v).
For sample preparation, ~10 mg of liver tissue, 1 mL of methanol:water (4:1, v/v), 30 µL of internal standard, and ~0.4 g of 1.0 mm glass beads were added to a 2-mL screw-capped tube. The samples were homogenized with a Mini-Beadbeater-24 (Biospec, San Diego, CA) for 30 seconds. The homogenate was transferred to a clean tube, combined with washings from rinsing the glass beads (2 x 200 µL of methanol), stored for 2 hours at −20°C to extract metabolites, and then centrifuged. The supernatant was concentrated to 100 µL in ACN:H2O (1:1, v/v) for analysis on LC-MS.
The analysis was performed on a Bruker Impact II™ Ultra-High Resolution Qq-Time-of-Flight Mass Spectrometer (Bruker Daltonics, Bremen, Germany) coupled with an Agilent 1290 Infinity Liquid Chromatography (Agilent Technologies, Palo Alto, CA) system. The mobile phases were 10 mM ammonium acetate at pH 4.8 in 5% ACN in H2O (MP A) and 5% H2O in ACN (MP B). With a flow rate of 0.150 mL/min, the LC gradient went from 95% MP B to 5% MP B over 20 minutes and held for 5 minutes. The gradient went back to 95% MP B over a minute and was allowed to equilibrate for 18 minutes before the next injection.
Samples were injected at 5 µL each onto a ZIC-pHILIC column (200 Å, 5 µm particle size, 2.1 × 150 mm) (EMD Millipore), for hydrophilic interaction chromatography (HILIC) positive ionization mode analysis. For mass calibration, 5 µL of 150 mM sodium formate was injected. Mass spectra peak areas were integrated for SAM, SAH, SAM-d3, and SAH-d4 in each calibration standard to generate calibration curve plots. The plots of peak area ratios of SAM/SAM-d3 and SAH/SAH-d4 against the concentrations of each of the eight calibration standards were used to back calculate the concentrations in liver samples.
Global levels of DNA methylation and DNA hydroxymethylation using LC-MS
For quantification of global levels of DNA methylation and hydroxymethylation, stock powders of 5-methyl-2’-deoxycytidine (5mdC), 5-hydroxymethyl-2’-deoxycytidine (5hmdC) (item no. 16,166 and 18,162 from Cayman Chemical, respectively), 2’-deoxycytidine (dC), and 2’-deoxyguanosine (dG) (cat. no. D3897 and D7145 from Sigma Aldrich, respectively) were used to prepare a set of eight calibration standards. dG was used as an internal standard, as the base pairs dC and dG are found in a 1:1 ratio [Citation44]. The calibration curve ranged in percentages of 5mdC/dG and 5hmdC/dG. Twelve DNA hydrolyzate samples were analysed alongside the standards.
For analysis, the method used was reversed-phase separation coupled with positive electrospray ionization on the same LC-MS platform used to measure SAM/SAH levels, a Bruker Impact II™ Ultra-High Resolution Qq-Time-of-Flight Mass Spectrometer (Bruker Daltonics, Bremen, Germany) coupled with an Agilent 1290 Infinity Liquid Chromatography (Agilent Technologies, Palo Alto, CA) system. The mobile phases were 0.1% formic acid in H2O (MP A) and 0.1% formic acid in ACN (MP B). With a flow rate of 0.150 mL/min, the LC gradient went from 98% MP A to 75% MP A over 15 minutes. The gradient went back to 98% MP A over a minute and was allowed to equilibrate for 7 minutes before the next injection.
For each sample, 5 μL was injected onto an ACQUITY UPLC BEH C18 column (130 Å, 1.7 μm particle size, 1.0 × 100 mm) (Waters, Milford, Massachusetts). To perform internal mass calibration, 2 μL of 150 mM sodium formate was injected 2 minutes before the end of each run. Mass spectra peak areas were integrated for 5mdC, 5hmdC, dC, and dG in each calibration standard to generate calibration curve plots. The plots of 5mdC/dG and 5hmdC/dG peak area ratios against the target ratios were used to back calculate the DNA methylation and hydroxymethylation levels in the DNA hydrolyzate samples.
DNA isolation and pyrosequencing
A standard phenol:chloroform extraction protocol was used to isolate DNA from rat liver tissues, and cell cultures followed by DNA bisulphite conversion, as previously described [Citation45]. Bisulphite converted DNA was amplified with HotStar Taq DNA polymerase (Qiagen) and biotinylated primers specific to target regions (please see Supplementary Table S1B for primer sequences). Pyrosequencing of the biotinylated DNA strands was performed in the PyroMark Q48 Autoprep instrument (Qiagen). The percentage of DNA methylation at a single CpG site resolution was calculated using PyroMark Q48 software.
Chromatin immunoprecipitation and quantitative ChIP (qChIP)
Chromatin immunoprecipitation was performed as previously described [Citation45,Citation46]. Briefly, human HepG2 HCC cells and primary normal hepatocytes (NorHep), each representing three biological replicates, were fixed with formaldehyde, incubated with protease inhibitors, lysed and subjected to cycles of sonication. Samples were pre-cleared with protein G agarose followed by centrifugation. Supernatants were divided into three sub-samples. One sub-sample was maintained as input. The second sub-sample served as negative control and was incubated with rabbit IgG non-specific antibody (negative control, Millipore, NI01). The third sub-sample was incubated with anti-TET1 rabbit antibody (Millipore, ABE1034). The next day, the fraction of DNA bound to antibodies was washed, eluted, and used as a template for qChIP.
ChIP DNA at an amount of 25 ng of input, antibody bound (TET1) and IgG bound DNA was used as starting material in all conditions. Levels of TET1 binding were expressed as (Bound-IgG)/Input. Primers used in qChIP are listed in Supplementary Table S1C.
Statistical analyses
An unpaired t-test with two-tailed distribution was used for statistical analysis of pyrosequencing, qRT-PCR, and qChIP. All results represent n = 6 rats per group or three independent experiments in human cells. Results are presented as mean ± SD. qRT-PCR data, presented in boxplots, depict minimum, interquartile range (IQR), and maximum. The results were considered statistically significant when P < 0.05.
Results
Fully developed HCC tumours manifest in all rats exposed to carcinogenic CDAA diet for 52 weeks
The average body weight of rats with HCC tumours (CDAA group) was significantly lower than healthy rats (CSAA group), starting at week 12 of exposure to CDAA diet (). Other studies using similar HCC models have also observed slowed weight gain [Citation37,Citation47]. For example, rats fed a choline deficient diet for 9 weeks weighed 20% less than their choline sufficient counterparts [Citation47]. Final body weights at 52 weeks were approximately 495 g for healthy rats (CSAA) compared to 361 g for rats with HCC (CDAA, right panel of ). Final liver weights were the same between the CSAA and CDAA rats (). However, the relative liver weight of rats with HCC (CDAA) was higher compared to healthy rats (CSAA) due to the decrease in body weight of CDAA rats over the experimental timeline ().
Figure 1. Macroscopic and histopathological analyses of rat livers upon methyl donor deficient diet. (a) Average body weights of healthy rats on choline-sufficient diet (CSAA) and rats on carcinogenic choline-deficient diet (CDAA) over 52-week experimental timeline. Bar graph represents average final body weights of CSAA and CDAA groups at the 52-week time-point. (b) Average liver weights and relative liver weights of CSAA and CDAA groups at the 52-week time-point. (c) Representative histopathological images at 4x and 20x magnification of whole livers from CSAA and CDAA groups. (d) Number of liver nodules in CSAA and CDAA livers with representative images of livers from rats in CSAA and CDAA groups. Results represent mean ± SD, n = 6 rats per group, **P < 0.01.
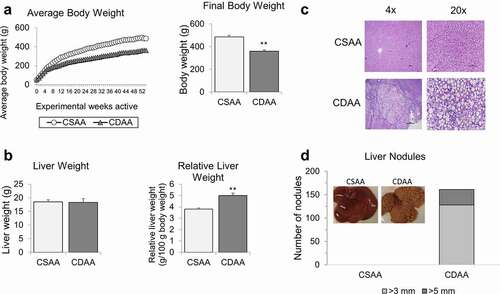
Macroscopic differences were observed when comparing the healthy livers from CSAA rats and livers with HCC from CDAA rats. The latter appeared yellow and contained numerous HCC tumour nodules. Representative histopathological images of livers from CSAA and CDAA rats are shown in . Hepatocellular lipidosis/steatosis, with medium to large well-defined non-staining vacuoles within hepatocytes, was present in the CDAA group. In those rats (CDAA), hepatic steatosis was accompanied by multiple solid HCC tumours characterized by large, atypical and vacuolated hepatocytes with abnormal lobular architecture and an absence of portal triads. Majority of the nodules observed in the CDAA livers were 3 mm or larger, but a portion of the nodules were even larger, measuring more than 5 mm (). HCC nodules were evenly distributed among the median and lateral lobes of the CDAA livers. No nodules were detected in livers of rats from CSAA group ().
Profound changes in gene expression profiles in livers of rats with HCC tumours as compared with healthy livers
To uncover the molecular pathogenesis of liver cancer, we performed RNA-seq of healthy CSAA livers and HCC CDAA livers. We discovered 1,236 upregulated and 612 downregulated genes in CDAA vs. CSAA, with statistically significant fold-change of 2 or higher (a list of genes in Supplementary Table S2). A chromosomal view of these changes is presented in using an Integrative Genome Visualization (IGV) tool. Each red bar represents a gene that is upregulated and each blue bar represents a gene that is downregulated in CDAA livers compared to CSAA livers. The highest increase in expression was detected for Cyp2c24 (159-fold upregulation, Supplementary Table S2), which belongs to Cyp2c members of the cytochrome P450 superfamily of enzymes. P450s are involved in drug metabolism and synthesis of lipids, and their overexpression was linked to increased metastasis [Citation48]. A gene with the biggest decrease in expression was Lhx8 (47-fold downregulation, Supplementary Table S2) from the LIM homeobox family of transcription factors involved in cell differentiation. Interestingly, Lhx transcription factors were found to be silenced in various cancers, including HCC [Citation49].
Figure 2. The landscape of genes differentially expressed in livers of healthy rats and HCC rats, as measured by RNA sequencing. (a) A chromosomal map of differentially expressed genes in livers of rats exposed to a choline-deficient diet (CDAA) as compared to healthy rats on a choline-sufficient diet (CSAA). (b) Functional analysis of genes differentially expressed in livers of CDAA vs. CSAA rats, using Gene ontology (in green) and KEGG pathway (in Orange) analyses. (c) Detailed analysis of metabolism-related pathways and corresponding genes that are downregulated (blue) or upregulated (red) within a given pathway in CDAA rats vs. CSAA rats based on RNA-seq. Categories with downregulated or upregulated genes are marked in blue and red, respectively. Grey boxes indicate categories with genes both upregulated and downregulated.
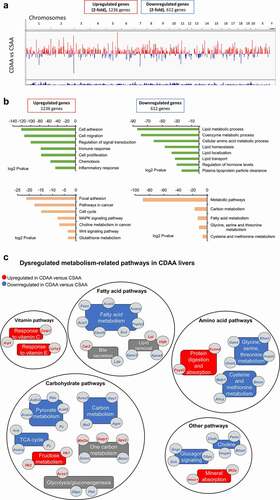
Significantly upregulated and downregulated genes were functionally analysed using GO and KEGG pathway analyses in the DAVID Knowledgebase [Citation50] (). Overall, differentially expressed genes were most enriched with two broad functional categories, namely oncogenic processes/pathways and macronutrient metabolism. Upregulated genes were associated with cancer-related functions and pathways, such as cell adhesion and migration, cell proliferation, signal transduction, immune and inflammatory response, cell cycle, and oncogenic signalling pathways like MAPK and Wnt signalling (, left panel). Genes associated with metabolic pathways, including utilization of carbohydrates, hormone and amino acid levels, and lipid processes such as homoeostasis, localization, transport, and lipoprotein clearance, were largely represented in the downregulated gene list (, right panel).
Changes in expression of metabolism-related genes involved in carbohydrate, fatty acid, amino acid, and vitamins are presented in . Pyruvate kinase 1 (Pklr), pyruvate carboxylase (Pc), acetyl-CoA synthetase 2 (Acss2), and ATP citrate lyase (Acly) are downregulated genes with various roles in carbohydrate metabolism. For example, Pklr catalyzes the rate-limiting step of glycolysis, while Pc is involved in carboxylation of pyruvate to oxaloacetate. Acss2 and Acly catalyse the synthesis of acetyl-CoA from short chain fatty acids (Acss2) or by cleavage of citrate (Acly). A gene encoding for the catalytic subunit of glucose-6-phosphatase (G6pc), which hydrolyzes glucose-6-phosphate to glucose during gluconeogenesis and glycogenolysis, was downregulated. G6pc downregulation has been associated in previous studies with accumulation of lipids in the liver [Citation51]. In addition, expression of fatty acid metabolism and lipid removal genes was largely decreased in the CDAA livers, including acetyl-CoA acetyltransferase 2 (Acat2), acetyl-CoA carboxylase alpha (Acaca), fatty acid synthetase (Fasn), and ELOVL fatty acid elongase 5 (Elovl5). Expression of several apolipoprotein genes, which are components of lipoproteins responsible for transport of lipids throughout the body, was reduced as well. Such changes may underlie the observed fat accumulation and impairment of lipid removal from the liver. Other robustly downregulated genes belonged to the patatin-like phospholipase domain containing protein family, Pnpla3 and Pnpla5. Interestingly, Pnpla3 has lipase activity towards triacylglycerols and its loss of function has been shown to promote fat accumulation in the liver [Citation52]. Among genes with the highest magnitude of suppression, we identified Slc5a9 (68.9-fold), which is an essential transporter of mannose and fructose, and aquaglyceroporin 7 (Aqp7) (34.9-fold), which is implicated in modulation of energy metabolism. Also downregulated were kyphoscoliosis peptidase (Ky) (31.8-fold downregulated), which belongs to the trans-glutaminase superfamily and is associated with muscle growth and myopathy, as well as Cyp2c11 (19.8-fold down) and Cyp2c7 (19.7-fold down), which are cytochrome P450 subunits that catalyse many reactions in drug and nutrient metabolism.
The expression of genes active in metabolizing certain amino acids was also decreased in liver of rats with HCC (CDAA). Specifically, glycine-N methyltransferase (Gnmt), dimethylglycine dehydrogenase (Dmgdh), adenosylhomocysteinase (Ahcy), and betaine-homocysteine S-methyltransferase (Bhmt), which are implicated in glycine, cysteine, and methionine metabolism, were downregulated (). Suppression of both Dmgdh and Bhmt was previously detected in HCC, and Dmgdh was reported to be a potential diagnostic and prognostic HCC marker [Citation53]. In human tissues, BHMT was downregulated in 85% of HCC tumours and low BHMT expression was associated with shorter overall patient survival [Citation54]. In addition, Dmgdh and Bhmt are crucial for choline metabolism. For example, Bhmt catalyzes the formation of methionine from betaine and homocysteine in the liver and kidney. Other genes from the choline metabolism pathway, choline dehydrogenase (Chdh) and phosphatidylethanolamine N-vmethyltransferase (Pemt), were suppressed (1.7-fold) in our dataset as well, further indicating the pathway impairment ().
Lipid removal and lipid transport pathways are impaired in livers of rats with HCC tumours as compared with healthy livers
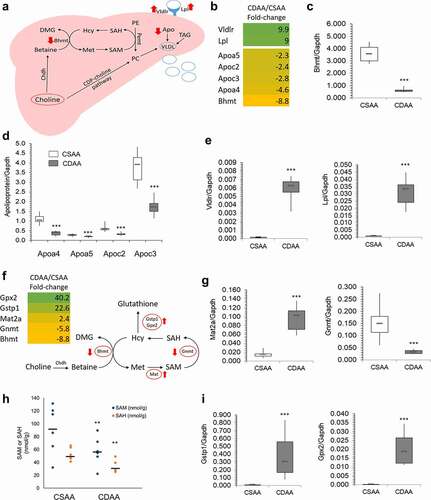
The impairment of the choline metabolism pathway inevitably links to lipid transport and lipid removal from the liver (). The presence of choline and betaine to form phosphatidylcholine (PC) in the liver is vital for assembly of very low-density lipoproteins (VLDL) that transport lipids out of the liver and into peripheral circulation. PC can be formed using exogenous CDP-choline pathway and endogenous choline pathways. The endogenous choline pathway mainly involves Bhmt, Chdh, and Pemt (). An 8.8-fold downregulation of Bhmt in CDAA livers compared to CSAA livers was observed in RNA-seq (), which was further validated by qRT-PCR showing 6.1-fold downregulation (). Other components, such as apolipoproteins, which are crucial for VLDL formation, were also downregulated (). Their reduced expression was reflected by qRT-PCR (), along with upregulation of lipid sensing genes, Vldr and Lpl ().
Figure 3. Lipid distribution and one-carbon metabolism pathways are altered upon carcinogenic choline-deficient diet. (a) Schematic of a lipid distribution pathway in the liver that is linked to choline metabolism. Red arrows indicate the direction of changes in gene expression as determined by RNA-seq and qRT-PCR. (b) Heat map based on fold-change values in RNA-seq for differentially expressed genes that are associated with a lipid distribution-related pathway (n = 4/group). (C, D, E) Boxplots depicting expression of Bhmt (c), apolipoproteins Apoa4, Apoa5, Apoc2, and Apoc3 (d), and Vldr and Lpl (e), on mRNA levels as validated by qRT-PCR in CSAA and CDAA livers. Results expressed as min, IQR, and max; n = 6 rats per group. ***P < 0.001. (f) Heat map based on fold-change values in RNA-sequencing for differentially expressed genes that are associated with a one-carbon metabolism pathway (n = 4/group). Schematic of one-carbon metabolism is shown in the right panel and red arrows indicate the direction of changes in expression of genes involved in the pathway. (g) Boxplots depicting expression of Mat2a and Gnmt on mRNA levels as validated by qRT-PCR in CSAA and CDAA livers. Results expressed as min, IQR, and max; n = 6 rats per group. ***P < 0.001. (h) SAM and SAH levels measured by liquid-chromatography mass-spectrometry (LC-MS)-based method in CSAA and CDAA livers. Results expressed as scatter plots; n = 6 rats per group. **P < 0.01 (CDAA vs. CSAA). (i) Boxplots depicting expression of Gstp1 and Gpx2 on mRNA levels as validated by qRT-PCR in CSAA and CDAA livers. Results expressed as min, IQR, and max; n = 6 rats per group. ***P < 0.001.
One-carbon metabolism and DNA methylation machinery are altered in livers of rats with HCC tumours as compared with healthy livers
Considering changes in genes related to choline metabolism and the involvement of choline in one-carbon metabolism (OCM), we next focused on alterations in OCM. The choline-related gene, Bhmt, is involved in OCM based on its role in forming methionine from homocysteine (). Methionine is then used to produce SAM via methionine adenosyltransferase (Mat) genes. We found that Mat2a was upregulated 2.4-fold by RNA-seq () and 5-fold by qRT-PCR (), suggesting a compensatory mechanism whereby methionine detected in the CDAA livers is quickly converted to SAM for use in methylation reactions compared to healthy CSAA livers (). Upon donating a methyl group, SAM is converted to S-adenosylhomocysteine (SAH) in a reaction catalysed by methyltransferases, for example glycine-N methyltransferase Gnmt (). Diminished OCM pathway may consequently leads to the disturbances in methylation reactions. Indeed, we identified various methyltransferases, including Gnmt, RNA methyltransferase (Mettl18), catechol-O-methyltransferase (Comt), and nicotinamide N-methyltransferase (Nnmt), to be suppressed in livers with HCC as compared to healthy livers (Supplementary Table S2). Reduced expression of Gnmt by approximately 5-6-fold was detected by RNA-seq () and qRT-PCR (). Gnmt regulates the SAM:SAH ratio by using SAM to form a product with no known metabolic function (i.e., sarcosine) so that the SAM:SAH ratio can be maintained [Citation55].
Gnmt downregulation could imply altered SAM and SAH levels. Therefore, we next measured SAM and SAH levels in liver tissues as an additional parameter indicative of any perturbations in OCM and methylation reactions. SAM and SAH levels were significantly lower in livers of CDAA rats, reflecting the contribution of the choline-deficient diet to disturbances in OCM (). An average of 91.8 nmol/g SAM and 52.7 nmol/g SAH was measured in healthy rat livers (CSAA), whereas livers with HCC (CDAA) had levels of 57.5 nmol/g SAM and 32.9 nmol/g SAH.
Another interesting aspect is a connection between OCM and oxidative stress. Increased oxidative stress and inflammation during carcinogenesis activates anti-oxidant networks, including glutathione-mediated actions. The synthesis of glutathione is regulated by the substrate, cysteine, which is synthesized from homocysteine via a trans-sulphuration pathway [Citation56]. An increase in glutathione biosynthesis decreases the pool of homocysteine available for OCM, which may additionally contribute to OCM impairment. We detected upregulation of glutathione S-transferase pi (Gstp1, placental isoform of glutathione-S-transferase), and glutathione peroxidase 2 (Gpx2), enzymes that are involved in glutathione utilization and thus glutathione-mediated antioxidant defence pathways [Citation57]. A very high 20–40-fold upregulation of the genes was detected by RNA-seq () and reproduced using qRT-PCR (). Of note, oxidative liver injury is an integral part of hepatocarcinogenesis and pre-neoplastic Gstp-positive loci in the liver are an established marker of cancer initiated cells [Citation58,Citation59].
Robust upregulation of oncogenes accompanies dysregulation of DNA methylation machinery in livers of rats with HCC tumours as compared with healthy livers
Among genes differentially expressed in livers with HCC (CDAA) as compared with healthy livers (CSAA), the amount of upregulated genes was almost double of the number of downregulated genes (). The maximum magnitude of fold-change reached 159 times for upregulated genes, whereas the maximum fold-change was 46.6 times for downregulated genes. Additionally, the amount of genes upregulated by 10-fold or higher was 116 as compared to only 28 genes that were at least 10-fold downregulated. Moreover, functional analyses of differentially expressed genes revealed that upregulated genes fell into categories of cancer-driving processes, and thus may play a potential oncogenic role (, left panel).
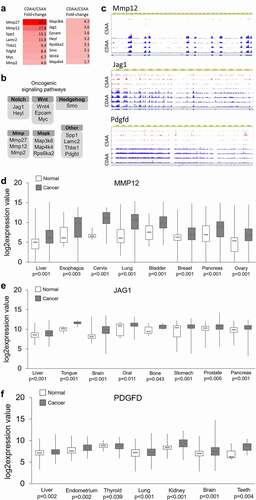
Therefore, we focused on upregulated genes and surveyed them for established and putative oncogenic functions using PubMed search engine. Interestingly, we identified numerous genes with cancer promoting functions and selected 16 of them for detailed study, as depicted in . The main rationale for our selection of the 16 genes was the magnitude of their upregulation and their implication in key oncogenic signalling pathways, which have been reported as overactive in many cancers, including HCC (). Browser tracks displaying RNA-seq data generated using the WashU Epigenome Browser are presented in for several highly upregulated oncogenes, namely matrix metallopeptidase 12 (Mmp12), jagged 1 (Jag1) from Notch signalling, and platelet-derived growth factor D (Pdgfd), implicated in p70S6K and ERK signalling (). The tracks clearly show more signal in CDAA group (blue peaks) than in CSAA group (red peaks). The highest changes were detected for metalloproteinases, Mmp27 and Mmp12, which were overexpressed by 65.1-fold and 27.8-fold, respectively (). Other established oncogenic players, such as Myc, Jag1, and Wnt4, were upregulated by 6.7-fold to 3-fold. Among the 16 selected upregulated genes linked to oncogenic pathways, we also found several genes with highly probable oncogenic functions, such as secreted phosphoprotein 1 (Spp1), thrombospondin 1 (Thbs1), and laminin C2 (Lamc2). Upregulation of all of the 16 selected oncogenes and putative oncogenes in CDAA vs. CSAA was quantitatively confirmed using qRT-PCR (Supplementary Figure S1). Using publicly available gene expression data, we further demonstrated upregulation of majority of the selected 16 genes in clinical samples of HCC and other types of cancer (, Supplementary Figure S2). Although upregulation of WNT4, LAMC2, and RPS6KA2 in tumours vs. normal tissue was not statistically significant in the datasets we analysed using GENT2 platform, the genes were previously reported to be overexpressed in HCC patients in other studies. For example, WNT4 was upregulated in HCC tissues as compared with normal adjacent tissue in the Gene Expression Omnibus database (GEO, GSE14520) [Citation60]. Recent studies on The Cancer Genome Atlas (TCGA) datasets indicated upregulation of LAMC2 [Citation61,Citation62] and RPS6KA2 [Citation63] in HCC tumours vs. normal adjacent tissue.
Figure 4. Upregulated oncogenes and oncogenic pathways in CDAA livers. (a) Heat map based on fold-change values in RNA-seq for differentially expressed genes with oncogenic functions (n = 4/group). (b) The differentially expressed oncogenes categorized into oncogenic signalling pathways based on GO function and KEGG pathway analyses generated by DAVID Knowledgebase.(c) Tracks depicting RNA-seq data for several top upregulated oncogenes, Mmp12, Jag1, and Pdgfd, generated using WashU Epigenome Browser. Red peaks indicate CSAA reads and blue peaks indicate CDAA reads from 4 rats per group which were analysed by RNA-seq. (d-f) Boxplots depicting publicly available data on expression of MMP12, JAG1 and PDGF in clinical samples in different types of cancer. The normal versus tumour gene expression data were obtained from Oncomine and GENT2 and are presented as log2-transformed median centred per array, and SD-normalized to 1 per array. All the presented changes are presented with a corresponding statistical significance level (P value).
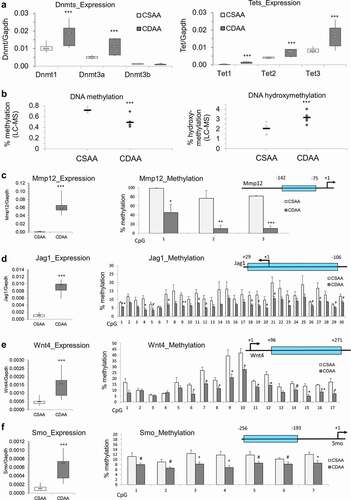
Previous studies in HCC patients, HCC cell lines, and in various models of HCC, including choline-deficiency-, methyl-donor-deficiency- and carcinogen-driven tumours, show upregulation of oncogenes through DNA hypomethylation of gene regulatory regions as an important step in liver carcinogenesis [Citation11–14,Citation17,Citation38]. In our study, we discovered a diminished OCM pathway and suppression of various methyltransferases, including Gnmt, Mettl18, Comt, and Nnmt. To determine whether DNA methylation is also disrupted and potentially contributes to oncogene upregulation, we assessed expression of DNA methyltransferases, Dnmts, using qRT-PCR. We found that Dnmt1 and Dnmt3a were significantly upregulated, while Dnmt3b showed no statistically significant change in CDAA livers compared to healthy CSAA livers (, left panel). Potentially, the upregulation of Dnmt1 and Dnmt3a is a compensatory response in order to maintain DNA methylation reactions. In addition, significant upregulation of Tet1, Tet2, and Tet3 in CDAA livers was observed, which suggests active demethylation (, right panel). These findings, accompanied by the previously discussed drop in SAM available for methylation reactions, suggest a dysregulated state of DNA methylation. Indeed, global levels of DNA methylation show a profound decrease while DNA hydroxymethylation rises in CDAA vs. CSAA livers (). Such perturbations in the DNA methylation machinery may consequently lead to a loci-specific loss of DNA methylation and increase in gene transcription. We therefore proceeded with an assessment of DNA methylation states within regulatory regions of oncogenes.
Figure 5. Dysregulation of DNA methylating and demethylating enzymes, and DNA hypomethylation of promoter regions of candidate oncogenes that are overexpressed in liver of rats exposed to carcinogenic choline-deficient diet. (a) Boxplots depicting expression of methylating enzymes Dnmts and demethylating enzymes Tets on mRNA levels as validated by qRT-PCR in CSAA and CDAA livers. Results expressed as min, IQR, and max. (b) Global levels of DNA methylation and DNA hydroxymethylation in CSAA vs. CDAA livers, as measured by liquid-chromatography mass-spectrometry (LC-MS)-based method in CSAA and CDAA livers. (c-f) The left panels show gene expression of Mmp12 (c), Jag1 (d), Wnt4 (e), and Smo (f), as measured by qRT-PCR in CSAA vs. CDAA livers. DNA methylation levels, as measured by pyrosequencing, are depicted in the right panels, along with maps of the tested regions. Numbers represent locations of first and last CpG sites relative to the transcription start site (TSS) (+1) within the tested region. Results are expressed as mean ± SD; n = 6 rats per group. # P < 0.1, *P < 0.05, **P < 0.01, ***P < 0.001.
Upregulation of candidate oncogenes corresponds with DNA hypomethylation in gene regulatory regions in livers of rats with HCC tumours as compared with healthy livers
Following qRT-PCR, candidate oncogenes were selected for DNA methylation analysis by pyrosequencing. Because activation of signalling pathways is a hallmark of cancer [Citation64] and highly upregulated genes fall into oncogenic signalling pathway category, we selected candidates that are considered to be upstream regulators of their respective pathways and whose alterations may have consequent downstream effects on the signal transduction. We assessed Mmp12 from the degradation of extracellular matrix pathway, Jag1 from Notch signalling, Wnt4 from Wnt signalling, and smoothened (Smo) from the Hedgehog pathway. Several lines of evidence implicate high expression of Mmp12 with HCC development and severity [Citation65,Citation66]. Mmp12 expression correlated with T-cell infiltration, tumour size, poor tumour cell differentiation, and poor prognosis in HCC [Citation65,Citation66]. Jag1 is a Notch ligand whose increased expression in cell membranes and cytoplasm of HCC tumour cells positively correlates with extrahepatic metastasis [Citation67]. Wnt4 is a Wnt ligand that binds to its associated frizzled (Fzd) receptor to activate the Wnt/β-catenin signalling pathway. Accumulating evidence demonstrates a major role for aberrant Wnt signalling in HCC [Citation68]. Smo is a G-protein coupled receptor for Hedgehog proteins and an established proto-oncogene in human HCC [Citation69]. Because promoter regions are strongly associated with regulation of gene transcription and their relation between species has been explored allowing a better translation of our results into human cells [Citation70], the DNA methylation status of promoter regions of these 4 genes was measured in CSAA and CDAA liver tissues. Pyrosequencing primers spanning each gene’s promoter region were designed to cover as much of the region as possible in an attempt to capture differential DNA methylation that may be mediating upregulation of these genes ().
A region just upstream of the Mmp12 TSS (−142 to −75) displayed robust hypomethylation of three CpG sites, with differential methylation as high as 67% for CpG #2 (). Among the 30 CpG sites measured surrounding the Jag1 transcription start site (TSS) (+29 to −106), four were significantly hypomethylated while 12 showed a trend towards decreased DNA methylation (P < 0.1), with differences reaching 9% (). A region downstream of the Wnt4 TSS (+96 to +271) contained 17 CpG sites, 10 of which were significantly hypomethylated by up to 19% in CDAA livers compared to CSAA livers (). Methylation differences, ranging from 3–5%, were significant or showed a trend towards hypomethylation for a region containing seven CpGs preceding the TSS of Smo gene (−256 to −193) ().
DNA hypomethylation within a promoter region of MMP12 is accompanied by TET1 binding and MMP12 upregulation in human HCC cells as compared to healthy hepatocytes
We next addressed whether hypomethylation of oncogenes in HCC is linked to changes in the interactions between DNA and demethylating enzymes, Tets. One of our candidates was Tet1 due to its potential oncogenic role in HCC [Citation12,Citation24,Citation71,Citation72]. TET1 upregulation in HCC tumours [Citation12], TET1 hypomethylation in blood DNA of individuals at risk for HCC development [Citation24,Citation71], and TET1-dependent demethylation and upregulation of an oncogene HMGA2 in HCC [Citation72] have been shown in recent studies. As Mmp12 showed the highest extent of upregulation and promoter hypomethylation in livers of rats with HCC tumours (CDAA) as compared with healthy livers (CSAA) (), we selected this gene for further mechanistic studies in human cells. MMP12 was robustly overexpressed at mRNA level in human HCC HepG2 cells as compared with human primary hepatocytes (NorHep) (). Protein level analysis by western blot confirmed a high level of MMP12 in HepG2 cancer cells (). Of note, we detected a lack of active MMP12 and a weak expression of zymogen in primary hepatocytes (). These changes in MMP12 expression were coincident with up to 24% lower DNA methylation levels within MMP12 promoter in HepG2 cells (). Of interest, TET1 was detected only at MMP12 promoter of HepG2 cells with no binding detected in primary hepatocytes (). Given that MMP12 is an oncogene implicated in breakdown of the extracellular matrix to facilitate cell remodelling, its overexpression and hypomethylation in HepG2 was accompanied by high invasive properties ().
Figure 6. Overexpression and DNA hypomethylation of MMP12 in human HepG2 HCC cells is accompanied by TET1 increased occupancy at MMP12 promoter region. (a-b) Expression of MMP12 in human HepG2 HCC cells and in human primary hepatocytes (NorHep), as measured by qRT-PCR (a) and western blot (b). In western blot analyses, reactive bands were visualized using the chemiluminescent protocol in the ChemiDoc MP Imaging System (Bio-Rad) and analysed using the Image Lab software. Protein loading was normalized with respect to total sample protein loaded using free stain gels. (c) DNA methylation levels across three CpG sites within MMP12 promoter region in HepG2 and NorHep, as measured by pyrosequencing. (d) TET1 binding within MMP12 promoter region in HepG2 and NorHep, as measured by quantitative chromatin immunoprecipitation (qChIP). (e) Number of HepG2 and NorHep cells that invaded through extracellular matrix within 24 hr, as assessed by Boyden chamber invasion assay. Results are expressed as mean ± SD; n = 3, ***P < 0.001.
DISCUSSION
Aberrations in the epigenome have been implicated as a driving factor in many cancer types, including liver cancer [Citation12]. Studies in HCC cell cultures, animal models of HCC of different aetiology, and on tissues from HCC patients clearly indicate an important role of epigenetic alterations, especially in the DNA methylation patterns [Citation4,Citation11–14,Citation17,Citation32,Citation37,Citation38,Citation73]. Numerous in vivo studies have used carcinogenic models based on choline deficiency and deficiency of other methyl donors; however, they have been mostly limited to investigating DNA methylation at a global level and within several candidate genes [Citation47,Citation74,Citation75]. For example, hypomethylation and overexpression of an oncogene, cMyc, was reported in livers of CDAA rat model [Citation38]. Another study identified upregulation of oncogenic microRNAs in rat livers in response to the CDAA diet but did not investigate a role for DNA methylation [Citation76]. Short-term feeding of the CDAA diet (4 days, 8 days, or 3 weeks) resulted in promoter hypermethylation of tumour suppressor genes E-cadherin, Cx26, and Rassf1a. At those early time-points, increased methylation of regulatory regions was not associated with gene repression [Citation74]. Thus, a comprehensive study with elaboration on mechanistic insights on epigenetic alterations of gene expression in HCC is lacking, which was the main rationale for our current study.
In the present study, we used a CDAA diet to trigger hepatocarcinogenesis in F344 rats at 52 weeks of exposure (). CDAA-mediated HCC is an established model where chronically applied CDAA diet leads to HCC development in F344 rats with 100% efficiency; without any need for carcinogen and pro-fibrotic agent applications. The model reliably recapitulates key aspects of human HCC, such as a long developmental stage and aetiology linked to environmental factors rather than an acute impact of carcinogens (e.g., in carcinogen-triggered rodent models) [Citation77,Citation78]. Of importance, steatosis (i.e., abnormal accumulation of fat in the liver) and steatosis-like phenotypes are major features of tumours in the CDAA model and closely match human HCC, especially in individuals with high body fatness who suffer from obesity-related non-alcoholic fatty liver disease, a condition increasingly associated with liver cancer in humans [Citation77,Citation78]. The CDAA rat model also has a clear hepatic pathological outcome in contrast to models of fatty liver disease based upon high-fat diet. Using RNA-seq, we generated a list of differentially expressed genes in the HCC rat model (total of 1,848 genes, CDAA vs. CSAA, ). Importantly, upon comparison of these data with differentially expressed genes in human HCC clinical samples (tumour vs. normal adjacent tissue, 6,401 differentially expressed genes), that we previously established [Citation12], we found a significant overlap of 888 genes (Fisher’s exact, P = 7.4E-52). These features qualify our model as a robust and practical tool to study interventions addressing human HCC.
Functional analyses of differentially expressed genes in livers of rats with HCC tumours (CDAA) as compared with healthy livers (CSAA) show dysregulation of metabolism-related genes, impairment of lipid removal pathways, and perturbations in one-carbon metabolism pathway (). Our findings support a recent hypothesis that metabolic changes occurring in cancer may be central to the disease [Citation64,Citation79,Citation80]. The complexity of energy metabolism and interrelatedness with other cancer hallmarks makes studying metabolism-associated changes important [Citation64].
Indeed, changes in the metabolic pathways could explain many hallmarks of HCC. Genes implicated in macronutrient metabolism, such as pyruvate kinase (Pklr), glucose-6-phosphatase (G6pc), acetyl-CoA synthetase (Acss2), acetyltransferase (Acat2) and carboxylase (Acaca), glycine-N methyltransferase (Gnmt), dimethylglycine dehydrogenase (Dmgdh), adenosylhomocysteinase (Ahcy), and betaine-homocysteine S-methyltransferase (Bhmt), are downregulated, indicating diminished liver functions in regulating metabolism (). Lipid accumulation in the liver could, at least partially, result from compromised VLDL and apolipoprotein synthesis upon low levels of phosphatidylcholine (). Moreover, dysregulation of one-carbon metabolism could lead to perturbations in methylation reactions that eventually may connect all the hallmarks through epigenetic (i.e., DNA methylation) and/or epitranscriptomic (i.e., RNA methylation) alterations of gene expression (). Interestingly, the epigenetic machinery also responds to changes in cellular metabolism and certain metabolites are substrates for epigenetic enzymes that modify DNA, RNA, and histone tails [Citation80]. For example, SAM, a direct metabolite of the essential amino acid methionine, is vital for the DNA methylation reaction acting as the methyl donor for Dnmts [Citation80]. Furthermore, Tet enzymes require alpha-ketoglutarate for their optimal activity in DNA demethylation [Citation80,Citation81].
We indeed detected downregulation of numerous methyltransferases, including RNA methyltransferase Mettl18 (Supplementary Table S2), and a decrease in SAM and SAH levels in HCC livers of CDAA rats as compared with healthy CSAA livers (). Expression of DNA methylating (Dnmts) and demethylating (Tets) enzymes was altered () along with a decrease in global levels of DNA methylation and an increase in DNA hydroxymethylation (), which indicates the impact on the DNA methylation machinery as well. Our findings suggest a shift towards DNA demethylation in HCC as reflected in Tets upregulation () and increase in DNA hydroxymethylation (). Interestingly, among upregulated pathways, we found a response to vitamin C (), which can constitute an additional mechanism contributing to higher Tet activity. Vitamin C reduces ferric iron Fe3+ to ferrous iron Fe2+ and makes ferrous iron available for the Tet catalytic centre to convert a methylated cytosine to hydroxymethylcytosine and further oxidized forms [Citation82].
Taking into account our previous findings on loci-specific hypomethylation and upregulation of cancer-driving genes in human HCC [Citation12–14,Citation17], we hypothesized that these disruptions in DNA methylation reactions could contribute to a robust upregulation of oncogenes and oncogenic signal transduction in the current study. Indeed, while genes downregulated in HCC tumours of CDAA group of rats fell mostly into the metabolic pathway category, overexpressed genes were enriched with oncogenic signalling pathways and processes, and were altered to a much higher extent as compared with suppressed genes (, Supplementary Figure S1). Upregulated oncogenes were involved in numerous signalling pathways that are important for cancer growth, migration and metastasis, including Notch, Wnt, and Hedgehog (Supplementary Figure S1). DNA methylation assessment of four of those genes (i.e., Mmp12, Jag1, Wnt4, and Smo), which were selected based on the magnitude of overexpression in HCC livers of CDAA rats, their functions in HCC and in oncogenic signalling, clearly showed a correlation between upregulation and promoter hypomethylation (). One could say that the observed changes are linked to the in vivo model we applied in the present study, where deficiency of choline inevitably disrupts one-carbon metabolism and DNA methylation reactions. However, we want to point out that dysregulation of one-carbon metabolism, low SAM/SAH ratio, and altered DNA methylation were also detected in other models of HCC and in patients with HCC [Citation12–14,Citation17,Citation32,Citation83]. To confirm further the biological relevance of our findings to human HCC, we compared the present data to our previous analysis on clinical samples from HCC patients [Citation12]. Of importance, among 230 genes that were upregulated and hypomethylated in human HCC (tumour vs. normal adjacent tissue) [Citation12], 23 genes overlapped with genes upregulated in rat HCC (CDAA vs. CSAA) (Fisher’s exact test, P = 0.008). This indicates similarities of aberrations observed between our rat HCC model and human HCC.
Our subsequent mechanistic studies on Mmp12 promoter, where the strongest DNA hypomethylation was detected, provided further support for the relevance of the rat model to human HCC. MMP12 was strongly overexpressed and hypomethylated in human HCC HepG2 cells as compared with human primary hepatocytes (). Of interest, DNA hypomethylation within the MMP12 promoter was accompanied by binding of a demethylating enzyme, TET1, whereas no TET1 binding was detected in primary hepatocytes (). Although TET1 has been shown to play anticancer or oncogenic roles depending on loci-specific targets, signalling pathways, cell types, and cancer types [Citation84], TET1 upregulation in HCC tumours and TET1-dependent demethylation and upregulation of an oncogene HMGA2 in HCC has been recently demonstrated [Citation72]. Importantly, TET1 was also found to be highly upregulated in clinical HCC samples in our previous study [Citation12]. We further demonstrated that TET1 is hypomethylated in blood DNA of individuals at risk for HCC development [Citation24] and others reported on TET1 hypomethylation in T cells as a potential early HCC detection tool [Citation71]. In several other cancer types, TET1 oncogenic role was also proposed [Citation85–87]. TET1-mediated hypomethylation has been shown to activate oncogenic signalling, including PI3K, EGFR, and PDGF pathways, and renewal and expansion of cancer stem cells in triple-negative breast cancer [Citation85,Citation86]. Activation of PI3K/AKT signalling through TET1-dependent mechanism has also been reported in endometrial cancer [Citation87].
The present study delivers a new comprehensive view of alterations of gene expression in an in vivo HCC model. The findings also suggest that aberrant expression of epigenetic enzymes, including Tets, may underlie changes in the HCC transcriptome. We show that dysregulation of metabolism and oncogenic signalling in HCC may be connected through Tets demethylating enzymes. TET1 relying on metabolic substrates could potentially be involved in demethylation and activation of oncogenes. This work provides many new avenues for future research exploring mechanistic changes driving HCC pathogenesis and major players for the development of novel targeted strategies in HCC prevention and therapy.
Disclaimer statement
This article reflects the views of the authors and does not necessarily reflect those of the U.S. Food and Drug Administration.
Supplemental Material
Download Zip (807.6 KB)Disclosure statement
No potential conflict of interest was reported by the authors.
Data Availability Statement
RNA sequencing data available in Gene Expression Omnibus (GEO, accession number: GSE199443).
Supplementary material
Supplemental data for this article can be accessed here
Additional information
Funding
References
- Sung H, Ferlay J, Siegel RL, et al. Global Cancer Statistics 2020: GLOBOCAN Estimates of Incidence and Mortality Worldwide for 36 Cancers in 185 Countries. CA Cancer J Clin. 2021;71(3):209–249.
- Siegel RL, Miller KD, Jemal A. Cancer statistics, 2015. CA Cancer J Clin. 2015;65(1):5–29.
- Singh S, Singh PP, Roberts LR, et al. Chemopreventive strategies in hepatocellular carcinoma. Nat Clin Pract Gastroenterol Hepatol. 2014;11(1):45–54.
- Asada K, Kotake Y, Asada R, et al. LINE-1 hypomethylation in a choline-deficiency-induced liver cancer in rats: dependence on feeding period. J Biomed Biotechnol. 2006;2006:17142.
- Park IY, Sohn BH, Yu E, et al. Aberrant epigenetic modifications in hepatocarcinogenesis induced by hepatitis B virus X protein. Gastroenterology. 2007;132(4):1476–1494.
- Schafer DF, Sorrell MF. Hepatocellular carcinoma. Lancet. 1999;353(9160):1253–1257.
- WCRF/AICR. Diet, Nutrition, Physical Activity and Liver Cancer. World cancer research fund international/American institute for cancer research 2015. World Cancer Research Fund International; 2015.
- WCRF/AICR. Diet, Nutrition, Physical Activity and Cancer: a Global Perspective. Continuous update project report 2018; A summary of the third report.
- Davila JA, Morgan RO, Shaib Y, et al. Diabetes increases the risk of hepatocellular carcinoma in the United States: a population based case control study. Gut. 2005;54(4):533–539.
- Lu SC, Mato JM. Role of methionine adenosyltransferase and S-adenosylmethionine in alcohol-associated liver cancer. Alcohol. 2005;35(3):227–234.
- Zapisek WF, Cronin GM, Lyn-Cook BD, et al. The onset of oncogene hypomethylation in the livers of rats fed methyl-deficient, amino acid-defined diets. Carcinogenesis. 1992;13(10):1869–1872.
- Stefanska B, Huang J, Bhattacharyya B, et al. Definition of the landscape of promoter DNA hypomethylation in liver cancer. Cancer Res. 2011;71(17):5891–5903.
- Stefanska B, Bouzelmat A, Huang J, et al. Discovery and validation of DNA hypomethylation biomarkers for liver cancer using HRM-specific probes. PloS one. 2013;8(8):e68439.
- Stefanska B, Suderman M, Machnes Z, et al. Transcription onset of genes critical in liver carcinogenesis is epigenetically regulated by methylated DNA-binding protein MBD2. Carcinogenesis. 2013;34(12):2738–2749.
- Pereira MA, Wang W, Kramer PM, et al. Prevention by methionine of dichloroacetic acid-induced liver cancer and DNA hypomethylation in mice. Toxicol Sci. 2004;77(2):243–248.
- Rogers AE. Methyl donors in the diet and responses to chemical carcinogens. Am J Clin Nutr. 1995;61(3):659S–65S.
- Toh TB, Lim JJ, Chow EK. Epigenetics of hepatocellular carcinoma. Clin Transl Med. 2019;8(1):13.
- Jones PA, Ohtani H, Chakravarthy A, et al. Epigenetic therapy in immune-oncology. Nat Rev Cancer. 2019;19(3):151–161.
- Beetch M, Harandi-Zadeh S, Shen K, et al. Dietary antioxidants remodel DNA methylation patterns in chronic disease. Br J Pharmacol. 2020;177(6):1382–1408.
- Rasmussen KD, Helin K. Role of TET enzymes in DNA methylation, development, and cancer. Genes Dev. 2016;30(7):733–750.
- Stefanska B, Cheishvili D, Suderman M, et al. Genome-wide study of hypomethylated and induced genes in liver cancer patients unravels novel anticancer targets. Clin Cancer Res off J Am Assoc Cancer Res. 2014;20(12):3118–3132.
- Mayol G, Martin-Subero JI, Rios J, et al. DNA hypomethylation affects cancer-related biological functions and genes relevant in neuroblastoma pathogenesis. PloS one. 2012;7(11):e48401.
- Cheishvili D, Boureau L, Szyf M. DNA demethylation and invasive cancer: implications for therapeutics. Br J Pharmacol. 2015;172(11):2705–2715.
- Lubecka K, Flower K, Beetch M, et al. Loci-specific differences in blood DNA methylation in HBV-negative populations at risk for hepatocellular carcinoma development. Epigenetics. 2018;13(6):605–626.
- Mansouri E, Khorsandi L, Abedi HA. Antioxidant effects of proanthocyanidin from grape seed on hepatic tissue injury in diabetic rats. Iran J Basic Med Sci. 2014;17(6):460–464.
- Atasever A, Yaman D. The effects of grape seed and colchicine on carbon tetrachloride induced hepatic damage in rats. Exp Toxicol Pathol. 2014;66(8):361–365.
- Charradi K, Elkahoui S, Karkouch I, et al. Protective effect of grape seed and skin extract against high-fat diet-induced liver steatosis and zinc depletion in rat. Dig Dis Sci. 2014;59(8):1768–1778.
- Carter LG, D’Orazio JA, Pearson KJ. Resveratrol and cancer: focus on in vivo evidence. Endocr Relat Cancer. 2014;21(3):R209–25.
- Lin HC, Chen YF, Hsu WH, et al. Resveratrol helps recovery from fatty liver and protects against hepatocellular carcinoma induced by hepatitis B virus X protein in a mouse model. Cancer Prev Res. 2012;5(7):952–962.
- Rawat D, Chhonker SK, Naik RA, et al. Modulation of antioxidant enzymes, SIRT1 and NF-kappaB by resveratrol and nicotinamide in alcohol-aflatoxin B1-induced hepatocellular carcinoma. J Biochem Mol Toxicol. 2021;35(1):e22625.
- Song Z, Zhou Z, Chen T, et al. S-adenosylmethionine (SAMe) protects against acute alcohol induced hepatotoxicity in mice. J Nutr Biochem. 2003;14(10):591–597.
- Shen L, Fang J, Qiu D, et al. Correlation between DNA methylation and pathological changes in human hepatocellular carcinoma. Hepato-gastroenterology. 1998;45(23):1753–1759.
- Mentch SJ, Mehrmohamadi M, Huang L, et al. Histone methylation dynamics and gene regulation occur through the sensing of one-carbon metabolism. Cell Metab. 2015;22(5):861–873.
- De Cabo SF, Hazen MJ, Molero ML, et al. S-adenosyl-L-homocysteine: a non-cytotoxic hypomethylating agent. Experientia. 1994;50(7):658–659.
- Li Z, Wang F, Liang B, et al. Methionine metabolism in chronic liver diseases: an update on molecular mechanism and therapeutic implication. Signal Transduct Target Ther. 2020;5(1):280.
- Cheishvili D, Stefanska B, Yi C, et al. A common promoter hypomethylation signature in invasive breast, liver and prostate cancer cell lines reveals novel targets involved in cancer invasiveness. Oncotarget. 2015;6(32):33253–33268.
- Nakae D, Yoshiji H, Mizumoto Y, et al. High incidence of hepatocellular carcinomas induced by a choline deficient L-amino acid defined diet in rats. Cancer Res. 1992;52(18):5042–5045.
- Tsujiuchi T, Tsutsumi M, Sasaki Y, et al. Hypomethylation of CpG Sites and c-myc gene overexpression in hepatocellular carcinomas, but not hyperplastic nodules, induced by a choline-deficient L-amino acid-defined diet in rats. Jpn J Cancer Res: Gann. 1999;90(9):909–913.
- Beetch M, Boycott C, Harandi-Zadeh S, et al. Pterostilbene leads to DNMT3B-mediated DNA methylation and silencing of OCT1-targeted oncogenes in breast cancer cells. J Nutr Biochem. 2021;98:108815.
- Kim D, Pertea G, Trapnell C, et al. TopHat2: accurate alignment of transcriptomes in the presence of insertions, deletions and gene fusions. Genome Biol. 2013;14(4):R36.
- Trapnell C, Roberts A, Goff L, et al. Differential gene and transcript expression analysis of RNA-seq experiments with TopHat and Cufflinks. Nat Protoc. 2012;7(3):562–578.
- Love MI, Huber W, Anders S. Moderated estimation of fold change and dispersion for RNA-seq data with DESeq2. Genome Biol. 2014;15(12):550.
- Robinson MD, McCarthy DJ, Smyth GK. edgeR: a Bioconductor package for differential expression analysis of digital gene expression data. Bioinformatics. 2010;26(1):139–140.
- Song L, James SR, Kazim L, et al. Specific method for the determination of genomic DNA methylation by liquid chromatography-electrospray ionization tandem mass spectrometry. Anal Chem. 2005;77(2):504–510.
- Lubecka K, Kurzava L, Flower K, et al. Stilbenoids remodel the DNA methylation patterns in breast cancer cells and inhibit oncogenic NOTCH signaling through epigenetic regulation of MAML2 transcriptional activity. Carcinogenesis. 2016;37(7):656–668.
- Brown SE, Suderman MJ, Hallett M, et al. DNA demethylation induced by the methyl-CpG-binding domain protein MBD3. Gene. 2008;420(2):99–106.
- Pogribny IP, Poirier LA, James SJ. Differential sensitivity to loss of cytosine methyl groups within the hepatic p53 gene of folate/methyl deficient rats. Carcinogenesis. 1995;16(11):2863–2867.
- Alzahrani AM, Rajendran P. The multifarious link between Cytochrome P450s and cancer. Oxid Med Cell Longev. 2020;2020:3028387.
- Wang X, He C, Hu X. LIM homeobox transcription factors, a novel subfamily which plays an important role in cancer (review). Oncol Rep. 2014;31(5):1975–1985.
- Sherman BT, Huang da W, Tan Q, et al. DAVID Knowledgebase: a gene-centered database integrating heterogeneous gene annotation resources to facilitate high-throughput gene functional analysis. BMC Bioinformatics. 2007;8(1):426.
- Rajas F, Dentin R, Cannella Miliano A, et al. The absence of hepatic glucose-6 phosphatase/ChREBP couple is incompatible with survival in mice. Mol Metab. 2021;43:101108.
- Trepo E, Romeo S, Zucman-Rossi J, et al. PNPLA3 gene in liver diseases. J Hepatol. 2016;65(2):399–412.
- Liu G, Hou G, Li L, et al. Potential diagnostic and prognostic marker dimethylglycine dehydrogenase (DMGDH) suppresses hepatocellular carcinoma metastasis in vitro and in vivo. Oncotarget. 2016;7(22):32607–32616.
- Jin B, Gong Z, Yang N, et al. Downregulation of betaine homocysteine methyltransferase (BHMT) in hepatocellular carcinoma associates with poor prognosis. Tumour Biol. 2016;37(5):5911–5917.
- Luka Z, Mudd SH, Wagner C. Glycine N-methyltransferase and regulation of S-adenosylmethionine levels. J Biol Chem. 2009;284(34):22507–22511.
- Vitvitsky V, Thomas M, Ghorpade A, et al. A functional transsulfuration pathway in the brain links to glutathione homeostasis. J Biol Chem. 2006;281(47):35785–35793.
- Krajka-Kuzniak V, Paluszczak J, Baer-Dubowska W. The Nrf2-ARE signaling pathway: an update on its regulation and possible role in cancer prevention and treatment. Pharmacol Rep. 2017;69(3):393–402.
- Pitot HC, Hikita H, Dragan Y, et al. Review article: the stages of gastrointestinal carcinogenesis–application of rodent models to human disease. Aliment Pharmacol Ther. 2000;14 Suppl 1:153–160.
- Bannasch P. Preneoplastic lesions as end points in carcinogenicity testing. I. Hepatic preneoplasia. Carcinogenesis. 1986;7(5):689–695.
- Han Q, Wang X, Liao X, et al. Diagnostic and prognostic value of WNT family gene expression in hepatitis B virusrelated hepatocellular carcinoma. Oncol Rep. 2019;42(3):895–910.
- Hu JW, Ding GY, Fu PY, et al. Identification of FOS as a candidate risk gene for liver cancer by integrated bioinformatic analysis. Biomed Res Int. 2020;2020:6784138.
- Bedon L, Dal Bo M, Mossenta M, et al. A novel epigenetic machine learning model to define risk of progression for hepatocellular carcinoma patients. Int J Mol Sci. 2021;23(1):22.
- Song ZB, Yu Y, Zhang GP, et al. Genomic instability of mutation-derived gene prognostic signatures for hepatocellular carcinoma. Front Cell Dev Biol. 2021;9:728574.
- Hanahan D, Weinberg RA. Hallmarks of cancer: the next generation. Cell. 2011;144(5):646–674.
- Gao H, Zhou X, Li H, et al. Role of matrix metallopeptidase 12 in the development of hepatocellular carcinoma. J Invest Surg. 2021 Apr; 34(4):366–372.
- He M-K, Le Y, Zhang Y-F, et al. Matrix metalloproteinase 12 expression is associated with tumor FOXP3+ regulatory T cell infiltration and poor prognosis in hepatocellular carcinoma. Oncol Lett. 2018;16(1):475–482.
- Xue TC, Zou JH, Chen RX, et al. Spatial localization of the JAG1/notch1/osteopontin cascade modulates extrahepatic metastasis in hepatocellular carcinoma. Int J Oncol. 2014;45(5):1883–1890.
- Wang W, Smits R, Hao H, et al. Wnt/beta-catenin signaling in liver cancers. Cancers (Basel). 2019;11(7):926.
- Sicklick JK, Li YX, Jayaraman A, et al. Dysregulation of the Hedgehog pathway in human hepatocarcinogenesis. Carcinogenesis. 2006;27(4):748–757.
- Xuan Z, Zhao F, Wang J, et al. Genome-wide promoter extraction and analysis in human, mouse, and rat. Genome Biol. 2005;6(8):R72.
- Zhang Y, Petropoulos S, Liu J, et al. The signature of liver cancer in immune cells DNA methylation. Clin Epigenetics. 2018;10(1):8.
- Shirai K, Nagae G, Seki M, et al. TET1 upregulation drives cancer cell growth through aberrant enhancer hydroxymethylation of HMGA2 in hepatocellular carcinoma. Cancer Sci. 2021;112(7):2855–2869.
- Pogribny IP, Ross SA, Wise C, et al. Irreversible global DNA hypomethylation as a key step in hepatocarcinogenesis induced by dietary methyl deficiency. Mutat Res. 2006;593(1–2):80–87.
- Shimizu K, Onishi M, Sugata E, et al. Disturbance of DNA methylation patterns in the early phase of hepatocarcinogenesis induced by a choline-deficient L-amino acid-defined diet in rats. Cancer Sci. 2007;98(9):1318–1322.
- Pogribny IP, Basnakian AG, Miller BJ, et al. Breaks in genomic DNA and within the p53 gene are associated with hypomethylation in livers of folate/methyl-deficient rats. Cancer Res. 1995;55(9):1894–1901.
- Wang B, Majumder S, Nuovo G, et al. Role of microRNA-155 at early stages of hepatocarcinogenesis induced by choline-deficient and amino acid-defined diet in C57BL/6 mice. Hepatology. 2009;50(4):1152–1161.
- Hebbard L, George J. Animal models of nonalcoholic fatty liver disease. Nat Clin Pract Gastroenterol Hepatol. 2011;8(1):35–44.
- Wei G, An P, Vaid KA, et al. Comparison of murine steatohepatitis models identifies a dietary intervention with robust fibrosis, ductular reaction, and rapid progression to cirrhosis and cancer. Am J Physiol Gastrointest Liver Physiol. 2020;318(1):G174–G88.
- Coller HA. Is cancer a metabolic disease? Am J Pathol. 2014;184(1):4–17.
- Sharma U, Rando OJ. Metabolic Inputs into the Epigenome. Cell Metab. 2017;25(3):544–558.
- Yin R, Mao SQ, Zhao B, et al. Ascorbic acid enhances Tet-mediated 5-methylcytosine oxidation and promotes DNA demethylation in mammals. J Am Chem Soc. 2013;135(28):10396–10403.
- Peng D, Ge G, Gong Y, et al. Vitamin C increases 5-hydroxymethylcytosine level and inhibits the growth of bladder cancer. Clin Epigenetics. 2018;10(1):94.
- Pascale RM, Feo CF, Calvisi DF, et al. Deregulation of methionine metabolism as determinant of progression and prognosis of hepatocellular carcinoma. Transl Gastroenterol Hepatol. 2018;3:36.
- Liu W, Wu G, Xiong F, et al. Advances in the DNA methylation hydroxylase TET1. Biomark Res. 2021;9(1):76.
- Good CR, Panjarian S, Kelly AD, et al. TET1-mediated hypomethylation activates oncogenic signaling in triple-negative breast cancer. Cancer Res. 2018;78(15):4–17.
- Bao B, Teslow EA, Mitrea C, et al. Role of TET1 and 5hmC in an obesity-linked pathway driving cancer stem cells in triple-negative breast cancer. Mol Cancer Res. 2020;18(12):1803–1814.
- Xie BY, Lv QY, Ning CC, et al. TET1-GPER-PI3K/AKT pathway is involved in insulin-driven endometrial cancer cell proliferation. Biochem Biophys Res Commun. 2017;482(4):857–862.