
ABSTRACT
Neurologically deceased organ donors (NDDs) generally display an immune response involving an intense production of pro-inflammatory cytokines referred to as the cytokine storm. The sudden surge of inflammatory mediators in circulation promotes tissue and organ damages and ultimately leads to poor transplant outcome. As microRNAs (miRNAs) are frequently proposed as key regulators of inflammation and are relatively stable in circulation, changes in their profiles could play a role in the onset of the cytokine storm in NDDs. In this proof-of-concept study, we sought to investigate differentially abundant circulating miRNAs in a temporal manner between neurological death and organ recovery and to assess the association between specific miRNAs and levels of inflammatory cytokines in blood. Plasma samples from five NDDs were obtained at multiple time points between organ donation consent and organ recovery. Using a time-course analysis and miRNA sequencing, we identified 32 plasma miRNAs fluctuating between consent and organ recovery (false discovery rate; q-value < 0.1). Eleven miRNAs relatively abundant (>100 reads) and detected in all samples were selected for further biological pathway analysis (miR-486-3p, miR-103a-3p, miR-106b-3p, miR-182-5p, miR-101-3p, miR-10a-5p, miR-125a-5p, miR-146b-5p, miR-26a-5p, miR-423-5p, miR-92b-3p). These miRNAs targeted genes such as c-JUN (TNF signalling pathway) and eEF2 (AMPK pathway), suggesting a potential role in regulation of inflammation. Our results contribute to a better understanding of the miRNAs dynamic after neurological death in organ donors and could potentially be used to predict the related early cytokine storm.Trial registration: ClinicalTrials.gov ID NCT03786991. Registered December 2018
Introduction
Kidney and liver transplantations are the preferred and frequently the last therapeutic option offered to patients with end-stage chronic kidney and liver disease. In 2019, the Global Observatory on Donation and Transplantation reported 153,863 organ transplantations worldwide, of which 100,097 were kidneys [Citation1]. Unfortunately, the current transplantations cover less than 10% of the global needs [Citation1]. Despite the progress made in surgical techniques, organ preservation and immunosuppression, long-term graft survival has not significantly improved in the last two decades [Citation2].
Currently, more than 60% of kidneys and 75% of livers available for transplantation are obtained from neurologically deceased organ donors (NDDs) [Citation1]. Compared to living donation, transplant function, graft survival and recipient survival are consistently inferior after neurological death donation [Citation3,Citation4]. Neurological death triggers pro-inflammatory reactions that stimulate the immune system, increase vascular permeability, recruit and activate leukocytes in solid organs [Citation5]. This rapid and intense surge in circulatory cytokines has been referred as the ‘cytokine storm.’ This process is initiated by acute brain injury and deteriorates at the time of neurological death, priming the organs for severe ischaemia–reperfusion injury when circulation is restored post-transplant [Citation6,Citation7]. This physiological state affects all organs, lead to organ damage and further decreased graft survival in recipients [Citation8–12]. Given the current organs shortage and the increased waiting list for transplantations, an urgent need to develop early personalized interventions to improve graft survival is required [Citation2,Citation13]. Although several biomarkers, e.g., pro-inflammatory cytokines such as TNF-α [Citation14–16], in the donors and recipients have been associated with graft dysfunction, the mechanisms underlying these events are poorly understood and their therapeutic potential remains questioned [Citation14,Citation17–20]. Additionally, while 20% of available organs are lost due to damage related to inflammatory markers [Citation21–23]; the cytokine storm remains a theoretical ideation rather than a clinical application. Furthermore, this entity has never been investigated in a way to unravel a yet unexplored solution to better treat donors and ultimately prevent the organs from being damaged when transplanted into a recipient.
In this context, microRNAs (miRNAs) appear as a promising and novel class of theranostic biomarkers (i.e., displaying both diagnostic and therapeutic characteristics) in several illnesses and conditions [Citation24–26]. miRNAs are small non-coding RNA molecules of approximately 19–24 nucleotides long that regulates gene expression post-transcriptionally [Citation27]. miRNAs are potential regulators of inflammation, immune cell communication and response [Citation28,Citation29] and accumulating evidence highlighted a role for miRNAs in complications following transplantation [Citation30]. For instance, miR-9, miR-10a, miR-21, miR-29a, miR-221 and miR-429 were increased in urinary samples of kidney recipients who suffered from a delay in the graft function early in the post-operative period (i.e., delayed graft function) [Citation31]. Interestingly, a prospective study showed that miR-182 triggers acute kidney injury and its inhibition improved kidney function in allograft recipients [Citation32]. In addition, circulating miR-99a and miR-210 were suggested for the early diagnosis of acute graft rejection among kidney recipients [Citation33,Citation34]. However, the role of miRNAs in donors, i.e., prior to organ recovery, and their potential involvement early in the inflammatory cascade following neurological death has not yet been examined.
The main goals of our current work were to identify biomarkers at the earliest time point between neurological death diagnosis and organ recovery, and to determine the cytokine storm peak during this time frame. To address these goals, we first performed a proof of concept study investigating the inflammatory cascade following neurological death up to organ recovery in NDDs. We aimed to identify changes in circulatory miRNAs abundance following neurological death and assessed their associations with plasma cytokine levels in five NDDs. Our findings provide supportive evidence to assess the predictive and therapeutic potentials of miRNAs in a larger cohort of patients.
Materials and methods
Study design and setting
This proof of concept translational study, which enrolled 5 neurologically deceased donors from a single centre, was nested within a multicenter larger observational study (EPI-Storm, NCT03786991) investigating the immune status of NDDs following neurological incident up to organs’ recovery. The study was approved by the Centre Intégré Universitaire de Santé et de Services Sociaux de l’Estrie – Centre hospitalier universitaire de Sherbrooke (CIUSSS de l’Estrie-CHUS) Research Ethic Board (REB approval #MP-31-2019-2960). The patient’s substitute decisions makers provided informed consent. Organ donations originate from brain-injured patients who die in an intensive care unit (ICU). From the time of consent for organ donation to the time of organ recovery – roughly 48 hours – a multidisciplinary care team strived for haemodynamic stability (e.g., fluid replacement therapy, administration of vasopressors) of the donor, assured physiologic homoeostasis (e.g., electrolyte supplementation and glucose control) and administered steroids or induced hypothermia to mitigate ischaemia-reperfusion injury [Citation35,Citation36].
Patient recruitment
Consented neurological deceased donors (NDDs) above 18 years of age were recruited in three intensive care units of the CIUSSS de l’Estrie-CHUS located in the province of Québec in Canada. Samples’ collection was performed between December 2018 and May 2019. The diagnosis of neurological death was confirmed when all the following criteria were met: 1) established aetiology capable of causing neurological death, 2) absence of confounding factors that mimic neurological death (e.g., alcohol or drug intoxication); 3) deep and unresponsive coma with the absence of motor responses 4) absence of brainstem reflexes following a clinical examen; and 5) absence of respiratory effort based on the apnea test [Citation37]. Patients were excluded when at least one of the following criteria was observed: active Staphylococcus aureus bacteraemia, positive human immunodeficiency virus, active neoplasia, and if the donor was under immunosuppressive therapy for at least three months. Additional exclusion criteria specific to the organ to be transplanted were enforced for liver (hepatitis A, B and C positive and liver failure defined as (i) International normalized ratio (INR) >1.5, (ii) hepatic encephalopathy (iii) aspartate aminotransferase, alanine aminotransferase > 2 times normal value) [Citation38]. As per eligibility criteria and the proof of concept nature of the study, a total of five NDDs were enrolled.
Data collection
A case report form was developed and calibrated for the herein study. Research staff collected data from ICU clinicians, bedside ICU monitors, and hospital records, starting (retrospectively) from the day of consent for organ donation until (prospectively) the time of organ recovery, an event preventing donation or decline of all organs by transplant programs.
Sample’s collection
Neurologically deceased donors had their blood drawn at the time of consent up to organs’ recovery, at the time of neurological death and then every 4 hours up to the time of incision. The research team was instructed to collect samples within 1 hour from the planned time points. Samples were collected as concomitantly as possible with routine draws (i.e., every 4 hours required by Transplant Québec).
Blood specimens were sampled via an arterial cannula in K2-EDTA tubes, promptly placed on ice, centrifuged at 4°C for 10 minutes at 2,500 g and immediately stored at −80°C. All specimens were stored at −80°C until biomarkers were analysed together (to avoid batch effects). This strategy has proven effective in basic science to enhance the quality, reliability, and validity of biomarker longitudinal studies [Citation39].
Quantification of plasma cytokines
Plasma TNF-α, IFN-γ, IL-1β, IL-2, IL-4, IL-6, IL-10, IL-11 and IL-12(p70) were measured by a custom Milliplex human cytokine panel kit (Millipore, catalogue # HSTCMAG-28SK) as per manufacturer’s protocol. This panel was selected based on their involvement in inflammatory signalling following neurological death and their association with impaired graft function following transplantation from neurologically deceased donors [Citation19,Citation40,Citation41]. Measurements were performed in duplicate and the average value was reported.
RNA extraction, library preparation and next-generation sequencing
RNA was extracted from 500 µL of plasma using mirVana Paris kit (Thermofisher Scientific, catalogue # AM1556) following manufacturer standard protocol for total RNA isolation. RNA was eluted in 75 µL of nuclease-free water, cthen mixed with 37.5 µL of chilled (4°C) 7 M ammonium acetate solution (Fisher Scientific, catalogue # 02002268) and subsequently 420 µL of cold (−20°C) absolute ethanol was added. RNA was precipitated overnight at −20°C, centrifuged at 16,000 g at 4°C for 30 minutes and washed twice with cold 80% ethanol. The RNA pellets were dried at room temperature for 30 minutes and solubilized in 5 µL of nuclease-free water. Libraries were prepared from 5 µL of RNA using the Truseq Small RNA Sample Prep kit (Illumina, catalogue # RS-200-0012) based on the procedure established by Burgos et al [Citation42]. Briefly, RNA samples were ligated with 3’ and 5’ adapters, reversed transcribed into complementary DNA (cDNA), barcoded (index 1–24) and PCR amplified (15 cycles) using halved volumes of the Truseq Small RNA Sample Prep kit’s reagents. cDNA products were then purified on a Novex 6% polyacrylamide TBE gels (ThermoFisher Scientific, catalog #EC6265BOX), size-selected (145–160bp) and eluted in 300 µL of ultrapure water. Libraries were precipitated according to manufacturer’s procedure (including an incubation of the precipitation mix at −80°C for 30 minutes) and the cDNA pellets were collected and suspended in 25 µL of 10 mM Tris-HCl (pH 8.5). Libraries quantification was assessed using the Kapa Illumina GA with Revised Primers-SYBR Fast Universal kit (Kapa Biosystems) and determination of the average size fragment was obtained using a LabChip GX (PerkinElmer) instrument. The libraries were normalized and pooled at 3 nM and then denatured in 0.05 N NaOH and neutralized using HT1 buffer. ExAMP was added to the mix following the manufacturer’s instructions. The pool libraries (now at 360pM) were loaded on a flowcell and ran on a HiSeq 4000 platform for 1 × 50 cycles (single-end mode) at Génome Québec Innovation Centre (Montréal, QC, Canada). A phiX library was used as a control and mixed with libraries at 1% level. The Illumina control software was HCS HD 3.4.0.38, the real-time analysis program was RTA v. 2.7.7. Program bcl2fastq2 v2.20 was then used to demultiplex samples and generate fastq reads.
miRNA sequencing data analysis
RNA sequencing data were processed using the Extra-Cellular RNA processing toolkit (exceRpt) pipeline version 4.6.3 using defaults parameters [Citation43]. Twenty-four plasma samples from the five NDDs were included in our full microtranscriptomic profiling using next-generation sequencing analysis (Supplementary Table 1). After data processing and quality assessment, samples with less than 1 million read and failed quality control were removed from the analysis (N = 3). A total of 21 samples were retained for further analyses. On average, 3.3 ± 3.2 million reads per sample were used for alignment. Of these, 98.7% mapped to the human genome.
Statistical analysis
A non-metric multidimensional scaling analysis (NMDS) ordination based on the Bray-Curtis dissimilarity metric was used to visualize the differences between cytokine profiles between patients as well as the miRNA profiles. These multivariate methods (using dissimilarity metric, ordination and permutational analysis of variance/multivariate statistics) were selected since it preserves statistical power as it greatly facilitates the visualization of multidimensional data sets. Significant differences in cytokine and miRNA profiles were assessed using a permutational multivariate analysis of variance (PERMANOVA) on respective Bray-Curtis distance matrix, using 100 000 permutations. These analyses were performed using the Vegan and the phyloseq packages in R [Citation44,Citation45]. The R package DESeq2 was used to identify differentially abundant miRNAs overtime using all detected miRNAs (N = 1,263) raw read counts as input as recommended [Citation46]. Default DESeq2 parameters were applied (correction for false discovery rate (FDR) set at q-value < 0.1) and the likelihood ratio test was applied to identify significant changes. The FDR q-value <0.1 was defined a priori of the analyses. Additionally, the rationale behind the use of q-value < 0.1 was that a less stringent FDR cut-off (q-value <0.1 instead of 0.05 for example) would allow the detection of a greater number of microRNAs in this proof of-concept study. Normalized read counts were obtained from the normalization method implemented in the DESeq2 function and were used to assess relative change in miRNAs between baseline (consent) and 8 hours following consent. Correlations using spearman coefficients were performed using miRNAs normalized read counts at consent (for the 11 selected miRNAs) and the relative change (Δ) between the cytokines plasma concentration at 8 hrs after consent (T1) and at consent (T0): relative difference Δ = (T1concentration -T0concentration)/T0concentration). Figures were generated using R package ‘ggplot2’ and ‘corrplot’ [Citation47,Citation48], while the heatmap was generated using Python data visualization library Seaborn [Citation49]. Analyses were performed using R software v. 4.0.2 with RStudio 1.3.1056 [Citation47, Citation50],
Biological pathway analysis
Biological pathway enrichment analysis was performed using DIANA miRpath with DIANA Tarbase v7.0 database [Citation51], which contains experimentally validated miRNAs’ mRNA targets only. The Kyoto Encyclopaedia of Genes and Genomes (KEGG) annotations were used to identify relevant pathways while applying an FDR q-value < 0.05.
Results
Characteristics of the NDD cohort
Demographics and clinical data are summarized in . Briefly, 4/5 (80%) of the donors were female, and were on median 72 (interquartile range [IQR] 21) years of age. Organs were declined intra-operatively for two NDDs. The median time between neurological death diagnosis and organ retrieval was 29.4 (IQR 32.3) hours. A total of 51 plasma samples were included in this study (Supplementary Table 1). Out of these 51 samples, all were assessed for cytokines measurements, and 24 of these were profiled for miRNAs by sequencing (, Supplementary Table 1). The time between hospital admission and neurological death diagnosis and consent to organ donation was variable between donors () as well as corresponding sample collection.
Figure 1. Main clinical events and sampling collection schedule for each neurologically deceased donors enrolled. Dotted lines are displaying blood specimen collection time points. Abbreviation Adm: Admission; Hosp: hospital; ICU: intensive care unit; ND: neurological death; OR: organ recovery.
Table 1. Characteristics of the five enrolled neurologically deceased donors.
Cytokines secretion following neurological death
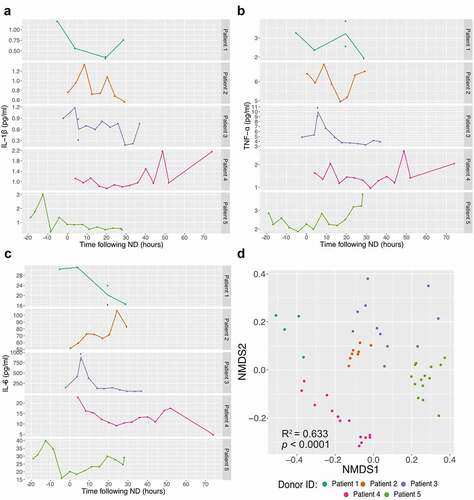
To investigate the inflammatory response profiles induced following neurological death and the secretion of circulatory inflammatory mediators in a time-course fashion, 9 cytokines: TNF-α, IL-1β, IL-6, IL-4, IL-10, IL-12(p70), IL-13, IL-2 and IFN-γ were quantified up to organ recovery in the 5 NDDs (, Supplementary Figure S1). The inflammation profiles of each NDD show that circulatory cytokines measured have levels that fluctuate rapidly after neurological death and those levels are divergent between patients (), Supplementary Figure S1). Non-metric multidimensional scaling (NMDS) ordination analysis using the Bray-Curtis dissimilarities showed that the profiles of cytokine levels are donor dependent (PERMANOVA: R2 = 0.633, p < 0.0001, )).
Figure 2. Inflammatory response in neurological deceased donors. Time course quantification of three cytokines: IL-1β (a), TNF-α (b) and IL-6 (c) highlights the frequent variation within NDDs over time (following neurological death diagnosis). Supplementary Figure 1 displays the others six cytokines quantified. Non-metric multidimensional scaling (NMDS) analysis ordination using the Bray-Curtis dissimilarity metric (quantification of 9 cytokines) between NDDs (d) demonstrates that samples collected from the same individuals tend to cluster together, suggesting higher homogeneity within donor (Stress value = 0.061, PERMANOVA: R2 = 0.633, p < 0.0001). Each point represents one time point and the dataset is coloured by patient.
Plasma miRNAs profiling and assessment of changes over time between consent to organ donation and organ recovery
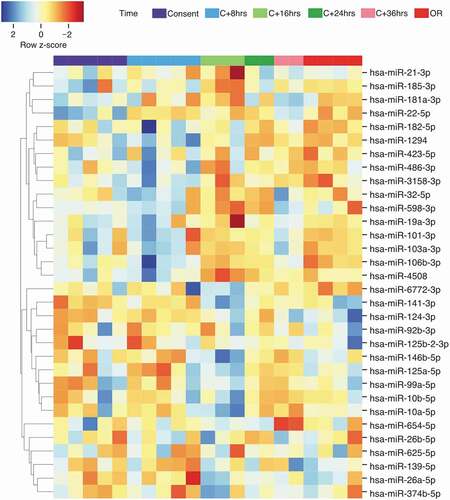
The miRNAs sequencing depth average is 1.65 M reads per sample. A total of 1,263 unique miRNAs were detected with ≥ 1 normalized read counts in at least one sample. Using a detection threshold of ≥ 5 miRNA reads per million of human genome mapped reads (RPM), 396 distinct miRNAs were detected in at least one sample. Of these, 372 (93.9%) were detected in ≥ 50%, 231 (58.3%) in ≥ 90% and 156 (39.4%) in all of the samples. All 1,263 miRNAs were tested for changes over time using the likelihood ratio test (DESeq2 R package) [Citation46]. Of these, 32 were found differently abundant between the different time points (False discovery rate q < 0.1). The relative abundance of the 32 differentially expressed miRNAs over time are shown in .
Figure 3. Heatmap and hierarchical clustering analysis of the 32 differentially abundant miRNAs identified in the time-course analysis. The relative abundance was obtained using z-score scaling of the rlog transformed counts. A negative z-score (in red) showed miRNA abundance that are lower than the mean. A positive z-score (in blue) showed miRNA abundance that are higher than the mean). OR: organ recovery.
Among the 32 identified miRNAs, 11 were detected in all 21 samples and found more abundant based on an arbitrary defined normalized read counts of >100. These miRNAs were considered the most promising and were thus selected for further analyses.
Interestingly, three patterns of variations seem to emerge for these miRNAs (). In brief, miR-486-3p, miR-103a-3p, miR-106b-3p, miR-182-5p and miR-101-3p abundance peaked 8 h post-consent ()). For miR-10a-5p, miR-125a-5p, miR-146b-5p, their abundance peaked 16 h following ND and declined afterwards ()). miR-26a-5p abundance also increased at 16 h post-consent, which was maintained until organ recovery ()). Finally, miR-423-5p abundance slowly decreased throughout the time-course analysis whereas the contrary was observed for miR-92b-3p ()).
Figure 4. miRNA showing changes following post-organ donation consent. A-E: miRNAs with changes at 8 h; F-I: miRNAs with changes at 16 h; J-K: miRNAs with continuous changes after ND; OR: Organ recovery. Time is represented as hours post-consent to organ donation. Each colour represents a specific patient and the p-values represent significant differences between each time point read counts.
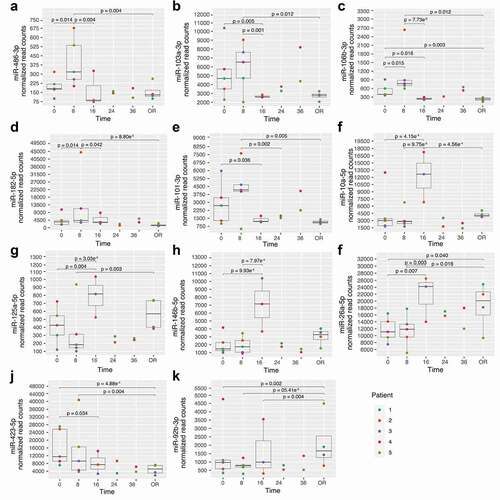
Figure 5. Biological pathway analysis of the 11 selected miRNAs. Pathways were identified through pathway union a posteriori method in DIANA miRpath [Citation51]. The x-axis shows -Log10 of FDR q-value. Pathways were considered significant at FDR q-value < 0.05. The numbers in the histogram bars represent the number of selected miRNAs associated with each biological pathway are identified in each bar.
![Figure 5. Biological pathway analysis of the 11 selected miRNAs. Pathways were identified through pathway union a posteriori method in DIANA miRpath [Citation51]. The x-axis shows -Log10 of FDR q-value. Pathways were considered significant at FDR q-value < 0.05. The numbers in the histogram bars represent the number of selected miRNAs associated with each biological pathway are identified in each bar.](/cms/asset/8e4c44fc-60fd-4efb-b08f-da2ef8db2d05/kepi_a_2076048_f0005_b.gif)
The NMDS analysis using the Bray-Curtis dissimilarity metric demonstrated that the miRNA profiles (11 selected miRNAs) were not donor dependent (stress value = 0.017, PERMANOVA: R2 = 0.267, p= 0.130, Supplementary Figure 2A). Interestingly, these miRNAs profiles showed a trend to cluster according to the time point post-consent, although it did not reach the significance level (stress value = 0.017, PERMANOVA: R2: 0.365, p = 0.061, Supplementary Figure 2B).
Selected miRNAs regulate biological pathways related to inflammation
A total of 36 putative biological pathways potentially regulated by the 11 most promising miRNAs were identified () [Citation51,Citation52]. Some of these pathways were related to cytokines production and release, inflammation, immune response such as MAPK signalling pathway, TGF-β signalling pathway, Wnt signalling pathways, among few others.
The gene intersection approach in DIANA miRpath was also applied to assess whether any of the identified targeted genes are regulated by many of the selected miRNAs. We found that miR-103a-3p, miR-106b-3p, miR-182-5p, miR-101-3p, miR-10a-5p, miR-125a-5p, miR-26a-5p and miR-423-5p target eEF2 (eukaryotic elongation factor 2) gene in the AMPK signalling pathway. Within this pathway, eEF2 is linked to protein synthesis inhibition. Similarly, miR-103a-3p, miR-101-3p, miR-10a-5p, miR-125a-5p, miR-146b-5p, miR-26a-5p and miR-92b-3p were predicted to target c-JUN (Jun proto-oncogene, AP-1 transcription factor subunit) gene within the TNF signalling pathway.
Selected miRNAs are correlated with change in cytokine levels
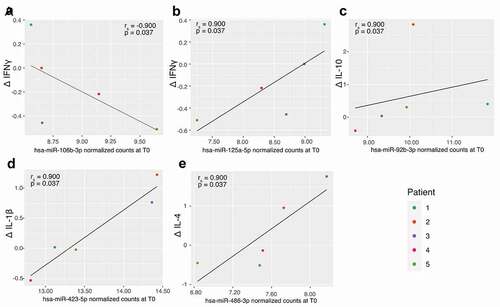
To assess whether the abundance of the selected miRNAs correlated with cytokine levels, spearman rank correlations were performed between miRNA abundance at time of consent (T0) and relative changes in cytokines levels (Δ) ( and Supplementary Table 2). We first observed correlations between miR-106b-3p (rs = −0.900, p = 0.037; )) and miR-125a-5p (rs = 0.900, p = 0.037; )) with ΔIFN-γ. Positive relationships were also observed between miR-92b-3p and ΔIL-10 (rs = 0.900, p = 0.037, )), miR-423-5p and Δ IL-1β (rs = 0.900, p = 0.037, )) and between miR-486-3p and Δ IL-4 (rs = 0.900, p = 0.037, )).
Figure 6. Correlation between selected miRNAs abundance at consent (T0) and changes in cytokines. A: hsa-miR-106b-3p and IFN-γ; B: hsa-miR-125a-5p and IFN-γ; C: hsa-miR-92b-3p and IL-10; D: hsa-miR-423-5p and IL-1β and E: hsa-miR-486-3p and IL-4.
Discussion
Organs recovered from neurologically deceased donors represent the most abundant source for transplantation but is also associated with reduced graft function compared to living donation [Citation3,Citation4]. The systemic inflammatory response following neurological death is associated with tissue damage and potentially lead to graft dysfunction in recipients [Citation5–7]. Accordingly, the identification of molecular mediators and potential biomarkers associated with the inflammatory response in the donors could increase transplant success. However, this innovative area of research remained relatively unexplored so far.
The results of this study supports the proof of concept that the cytokine secretion profiles are donor-specific and varies greatly following neurological death until organ recovery. This suggests that the cytokine secretion after neurological death is likely affected by donor-specific factors such as age, sex, medication and illnesses among others not identified in this study [Citation53]. Although we cannot exclude that other cytokines might be associated with neurological death, the secretion profile of the cytokines included in this study rapidly fluctuates in a donor-specific manner suggesting a lack specificity to use them as reproducible biomarkers and therapeutic targets to improve graft functions and success [Citation54,Citation55].
However, we have identified 11 promising candidates’ miRNAs based on their high detection rate and abundance in plasma using microtranscriptomic analyses. Interestingly, we observed three different miRNAs variation patterns which is also supported by a tendency of these miRNAs to cluster by time points. This could better reflect the biological adaptation to neurological death or the capacity of the miRNAs to regulate multiple inflammation-related genes. Moreover, compared to the cytokine profiles, the miRNA profiles did not cluster in a donor-specific manner. Altogether, these results support the concept that miRNAs could be a suitable approach to predict the cytokine storm and be used as reproducible therapeutic targets in neurologically deceased donors.
Many of our 11 promising miRNAs have been previously associated with graft dysfunction and related conditions [Citation31,Citation32,Citation56,Citation57]. Interestingly, miR-26a-5p displayed a peak concentration 16 hours after consent in our study and was previously associated with reduced neuronal apoptosis and reduced severe brain injury in a pre-clinical model [Citation58]. Briefly, miR-26a-5p upregulation in intracerebral haemorrhage alleviates neurological damage following cerebral injury in both in vitro and in a rat model, resulting in a decreased neuronal apoptosis [Citation58]. A binding site for miR-26a-5p was found on DAPK1 (death-associated protein kinase 1) a mediator of neuronal death [Citation59]. Our findings on miR-26a-5p are in accordance with both its expected expression response after cerebral injury and its potential role in protecting cells from death. They also support the rightness of our analytical strategy based on miRNA-Seq as well as its potential to identify novel miRNAs associated with the response to neurological death.
Among the biological pathways identified as relevant to transplantation outcomes, eight miRNAs are targeting eEF2 (eukaryotic elongation factor 2) in the AMPK signalling pathway. eEF2 deactivation by phosphorylation from eEF2 kinase was shown to inhibit protein translation and appears to play a protective role against cell death [Citation60,Citation61]. Interestingly, AMPK pathway was proposed as a protective pathway in ischaemic preconditioning to limit tissue damage related to ischaemia-reperfusion injury [Citation62]. While activation of AMPK for organ preservation remains hypothetical, eEF2 translation regulation by miRNAs might lead to improve cell survival in donors and subsequently improve the recipients’ graft function.
Moreover, seven miRNAs (miR-103a-3p, miR-101-3p, miR-10a-5p, miR-125a-5p, miR-146b-5p, miR-26a-5p and miR-92b-3p) were predicted to target c-JUN, which transcribed a subunit of the activator protein-1 (AP-1) transcription factor. c-JUN is induced in response to apoptosis, inflammation and cytokine production such as TNF-α, IL-6 and IL-1β and was observed in the context of acute brain injury as well as in kidney ischaemia/reperfusion injury following renal transplant [Citation63–65]. Interestingly, the activation of c-JUN by phosphorylation is mediated by JNK (Jun N-terminal kinases) in response to stimuli such as pro-inflammatory cytokines and oxidative stress [Citation66,Citation67]. Inhibition of JNK signalling prevents the phosphorylation of c-JUN, which was accompanied by a protective effect from ischaemia/reperfusion injury in rat kidneys [Citation68]. Accordingly, miRNAs could potentially mediate c-JUN and thus offer novel targets to better understand the cytokine storm after ND which could prove beneficial to improve organ transplant success.
As an epigenetic mechanism, miRNAs act by being fine-tuners of gene expression and are thus important to homoeostasis in many physiological processes [Citation69,Citation70]. As such, their circulating levels must be tightly regulated to fulfill their role. Here, we demonstrated that miRNA circulating levels varied following ND. These variations could mediate the miRNA regulatory functions in their target cells, as miRNAs are known to act as hormone-like mediators of intercellular communication [Citation71,Citation72]. Recent evidences have shown that miRNA expression levels could be regulated by other miRNAs, by themselves or by other epigenetic mechanisms (i.e., DNA methylation, histone modification and RNA modification) [Citation73,Citation74]. The mechanisms behind epigenetic regulation of miRNAs are thus an avenue worth exploring to understand the deregulation of miRNAs in ND [Citation69]. MiRNAs are also located in the nucleus, supporting a potential role in transcriptional regulation as both activators and silencers and in chromatin remodelling [Citation75–78]. Other nuclear functions of miRNAs might also include stability of non-coding RNA and involvement in alternative splicing, by regulating long non-coding RNAs for example [Citation79–82]. An interesting hypothesis is how these non-canonical roles of miRNAs could contribute to deregulated miRNAs expression in physiological state such as ND. However, these mechanisms need further investigations and are beyond the scope of this study.
To the best of our knowledge, this is the first study that assessed the plasma microtranscriptomic changes in neurologically deceased donors. The use of next-generation sequencing allowed the identification of known and novel miRNAs as well as to quantify their respective abundance [Citation83]. As such, the assessment of miRNAs variation patterns following neurological death is a novel aspect and the main strength of the study. However, we did not had the opportunity to validate the present results with other quantitative methods such as qPCR or digital PCR. Nevertheless, we believe that our discovery approach based on miR-Seq is robust as multiple studies have demonstrated close correlations between next-generation sequencing data and qPCR [Citation84–87]. Nonetheless, next-generation sequencing is not easily applicable in clinical context and as such technical validation will be required to translate the use of miRNAs as biomarkers of the cytokine storm in NDDs.
Although NDDs are cared for in the ICUs, we implemented a rigorous sampling collection and process to limit any variability during samples manipulation. We acknowledge that the limited sample size and the impossibility to fully standardize the collection time point on the ND (which remains a sequential and long procedure) prevent us from drawing generalizable conclusions. The intrinsic limitations associated with the collection of samples from NDDs do not easily allow standardization of the collected timepoints. The samples selected for this study were chosen based on their clinical relevance during the patient management period, such as right before the organs were collected from the donors. We believe that these samples, even if collected at different post-hospital admissions and post-neurological death times, are clinically comparable. This limitation cannot be accounted for or corrected in the current study due to the limited number of samples. Some of the exploratory associations we report could have been impacted by the different sampling time-point orders, or imbalance related to comorbidities unique to donors. Further studies in larger cohorts of NDDs will help disentangle the impacts of these and other potential biases. Despite this limitation, this study remains pragmatic as we were able to observe changes in specific miRNA profile which support a strong association between miRNAs and the physiological response following neurological death. Another limitation in the associative nature of our results which were not experimentally confirmed. It is worth mentioning that these analyses were exploratory and only provide a broad picture of the potential physiological functions that could be regulated by the miRNAs after neurological death. The reader should consider these results with care and be aware of the limitations of this strategy. Future studies should include experiments to identify the cellular origins and target of the miRNAs associated with the inflammatory response to ND as well as the study of their functional roles in either organ transplant success or failure. Nevertheless, our study design and analytical procedures overall proved its capacity to identify known (miR-26a-5p) and novel promising miRNAs associated with the biological response to ND.
Conclusion
In this study, we have identified 11 miRNAs which were differentially abundant over time after neurological death. These selected miRNAs target genes that are involved in inflammation and immune response signalling pathways. Although the ability of these miRNAs to predict the inflammatory response in NDDs remains to be explored in a larger cohort, these first data suggest that miRNAs could be proposed to investigate the onset of the biological response to neurological death. These promising results emphasized the potential of using miRNAs as possible biomarkers in this population and improve graft function in recipients.
Authors’ contributions
Conception and design of the study: AAC, DL, MCB, LHT, LB, MHM, FDA. Acquisition of data: AAC, DL, CL, MHM. Analysis and interpretation of the data: AAC, DL, MCB, LHT, LFD, LB, FDA. Drafting of the manuscript: AAC, DL, MCB, LB, FDA. Final approval of the article: All authors.
Supplemental Material
Download Zip (1.9 KB)Acknowledgments
Authors would like to thank all members of Pr. Bouchard’s laboratory for scientific discussions and Ms. Lucie Bouffard for performing the cytokines quantification experiments. Authors much appreciated the support of Calcul Québec and Compute Canada for performing the computations on the heterogenous cluster Mammouth-Mp2 (Université de Sherbrooke). Authors sincerely want to acknowledge the donor’ families for their support to this project and thank the ICU staff and research coordinators for samples procurement.
Disclosure statement
No potential conflict of interest was reported by the author(s).
Data Availability Statement
The datasets from the current study are available from the corresponding author upon reasonable request.
Supplementary material
Supplemental data for this article can be accessed online at https://doi.org/10.1080/15592294.2022.2076048
Additional information
Funding
References
- Organ Donation and Transplantation Activities 2019 Report. Global Observatory on Donation and Transplantation (GODT) those 2019 data are based on the Global Observatory on Donation and Transplantation (GODT) data, produced by the WHO-ONT collaboration.
- Lodhi SA, Lamb KE, Meier-Kriesche HU. Solid organ allograft survival improvement in the United States: the long-term does not mirror the dramatic short-term success. Am J Transplant. 2011;11:1226–1235.
- Terasaki PI, Cecka JM, Gjertson DW, et al. High survival rates of kidney transplants from spousal and living unrelated donors. N Engl J Med. 1995;333:333–336.
- Hariharan S, Johnson CP, Bresnahan BA, et al. Improved graft survival after renal transplantation in the United States, 1988 to 1996. N Engl J Med. 2000;342:605–612.
- Kosieradzki M, Rowiński W. Ischemia/reperfusion injury in kidney transplantation: mechanisms and prevention. Transplant Proc. 2008;40:3279–3288.
- Smith M. Physiologic changes during brain stem death–lessons for management of the organ donor. J Heart Lung Transplant. 2004;23:S217–222.
- Barklin A. Systemic inflammation in the brain-dead organ donor. Acta Anaesthesiol Scand. 2009;53:425–435.
- Cohen O, La Zerda DJ D, Beygui R, et al. Donor brain death mechanisms and outcomes after heart transplantation. Transplant Proc. 2007;39:2964–2969.
- Saito T, Takahashi H, Kaneda H, et al. Impact of cytokine expression in the pre-implanted donor lung on the development of chronic lung allograft dysfunction subtypes: cytokines in pre-implant donor lung and CLAD. Am J Transplant. 2013;13:3192–3201.
- Weiss S, Kotsch K, Francuski M, et al. Brain death activates donor organs and is associated with a worse I/R injury after liver transplantation. Am J Transplant. 2007;7:1584–1593.
- Sánchez-Fructuoso AI, Prats D, Marques M, et al. Does donor brain death influence acute vascular rejection in the kidney transplant? Transplantation. 2004;78:142–146.
- Fijter JWD, Mallat MJK, Doxiadis IIN, et al. Increased immunogenicity and cause of graft loss of old donor kidneys. J Am Soc Nephrol. 2001;12:1538–1546.
- Wolfe RA, Ashby VB, Milford EL, et al. Comparison of mortality in all patients on dialysis, patients on dialysis awaiting transplantation, and recipients of a first cadaveric transplant. N Engl J Med. 1999;341:1725–1730.
- Cheung KP, Kasimsetty SG, McKay DB. Innate immunity in donor procurement. Curr Opin Organ Transplant. 2013;18:154–160.
- McLaughlin PJ, Aikawa AA, Davies HM, et al. Tumour necrosis factor in renal transplantation. Transplant Proc. 1991;23(1 Pt 2):1289–1290.
- Sonkar GK, Usha, Singh RG. Evaluation of serum tumor necrosis factor alpha and its correlation with histology in chronic kidney disease, stable renal transplant and rejection cases. Saudi J Kidney Dis Transpl. 2009;20(6):1000–1004.
- Wiggins MC, Bracher M, Mall A, et al. Tumour necrosis factor levels during acute rejection and acute tubular necrosis in renal transplant recipients. Transpl Immunol. 2000;8:211–215.
- Senturk Ciftci H, Demir E, Savran Karadeniz M, et al. Serum and Urinary Levels of Tumor Necrosis Factor-Alpha in Renal Transplant Patients. Exp Clin Transplant. 2018;16(6):671–675.
- Watts RP, Thom O, Fraser JF. Inflammatory signalling associated with brain dead organ donation: from brain injury to brain stem death and posttransplant ischaemia reperfusion injury. J Transplant. 2013;2013:521369.
- Field M, Dronavalli V, Mistry P, et al. Urinary biomarkers of acute kidney injury in deceased organ donors - kidney injury molecule-1 as an adjunct to predicting outcome. Clin Transplant. 2014;28:808–815.
- Mascia L, Mastromauro I, Viberti S, et al. Management to optimize organ procurement in brain dead donors. Minerva anestesiologica. 2009;75(3):125–133.
- Shah VR. Aggressive management of multiorgan donor. Transplant Proc. 2008;40:1087–1090.
- Dikdan GS, Mora-Esteves C, Koneru B. Review of randomized clinical trials of donor management and organ preservation in deceased donors: opportunities and issues. Transplantation. 2012;94:425–441.
- Mitchell PS, Parkin RK, Kroh EM, et al. Circulating microRNAs as stable blood-based markers for cancer detection. Proc Natl Acad Sci USA. 2008;105:10513–10518.
- Atif H, Hicks SD. A review of microRNA biomarkers in traumatic brain injury. J Exp Neurosci. 2019;13:117906951983228.
- Mori MA, Ludwig RG, Garcia-Martin R, et al. Extracellular miRNAs: from Biomarkers to Mediators of Physiology and Disease. Cell Metab. 2019;30(4):656–673.
- O’Brien J, Hayder H, Zayed Y, et al. Overview of microRNA Biogenesis, Mechanisms of Actions, and Circulation. Front Endocrinol (Lausanne). 2018;9:402.
- Ledeganck KJ, Gielis EM, Abramowicz D, et al. MicroRNAs in AKI and kidney transplantation. Clin J Am Soc Nephrol. 2019;14:454–468.
- Mas VR, Dumur CI, Scian MJ, et al. MicroRNAs as biomarkers in solid organ transplantation. Am J Transplant. 2013;13:11–19.
- Barry CT. Organ transplantation and microRNA expression [Internet]. In: MicroRNA in Regenerative Medicine. Elsevier; 2015 [cited 2021 Jan 12]. 835–862. Available from: https://linkinghub.elsevier.com/retrieve/pii/B9780124055445000320
- Khalid U, Newbury LJ, Simpson K, et al. A urinary microRNA panel that is an early predictive biomarker of delayed graft function following kidney transplantation. Sci Rep. 2019;9:3584.
- Wilflingseder J, Jelencsics K, Bergmeister H, et al. Inhibition ameliorates ischemic acute kidney injury. Am J Pathol. 2017;187:70–79. miR-182-5p.
- Tao J, Yang X, Han Z, et al. Serum microRNA-99a helps detect acute rejection in renal transplantation. Transplant Proc. 2015;47:1683–1687.
- Lorenzen JM, Volkmann I, Fiedler J, et al. Urinary miR-210 as a mediator of acute T-cell mediated rejection in renal allograft recipients. Am J Transplant. 2011;11:2221–2227.
- Ball IM, Hornby L, Rochwerg B, et al. Management of the neurologically deceased organ donor: a Canadian clinical practice guideline. Cmaj. 2020;192:E361–9.
- D’Aragon F, Lamontagne F, Cook D, et al. Variability in deceased donor care in Canada: a report of the Canada-DONATE cohort study. Can J Anaesth. 2020;67:992–1004.
- Shemie SD. Severe brain injury to neurological determination of death: Canadian forum recommendations. Can Med Assoc J. 2006;174:S1–12.
- Cordoba J, Dhawan A, Larsen FS, et al.; European Association for the Study of the LiverElectronic address: Clinical practice guidelines panel, Wendon, Panel members. EASL clinical practical guidelines on the management of acute (fulminant) liver failure. J Hepatol. 2017;66:1047–1081.
- Tworoger SS, Yasui Y, Chang L, et al. Specimen allocation in longitudinal biomarker studies: controlling subject-specific effects by design. Cancer Epidemiol Biomarkers Prev. 2004;13(7):1257–1260.
- Azarpira N, Nikeghbalian S, Kazemi K, et al. Association of increased plasma interleukin-6 and TNF-α levels in donors with the complication rates in liver transplant recipients. International Journal of Organ Transplantation Medicine. 2013;4(1):9–14.
- Venkateswaran RV, Dronavalli V, Lambert PA, et al. The proinflammatory environment in potential heart and lung donors: prevalence and impact of donor management and hormonal therapy. Transplantation. 2009;88:582–588.
- Burgos KL, Javaherian A, Bomprezzi R, et al. Identification of extracellular miRNA in human cerebrospinal fluid by next-generation sequencing. RNA. 2013;19:712–722.
- Rozowsky J, Kitchen RR, Park JJ, et al. exceRpt: a comprehensive analytic platform for extracellular RNA profiling. Cell Syst. 2019;8:352–357.e3.
- Oksanen J, Blanchet G, Friendly M, et al. vegan: Community Ecology Package [Internet]. 2020. Available from: https://CRAN.R-project.org/package=vegan
- McMurdie PJ, Holmes S. phyloseq: an R package for reproducible interactive analysis and graphics of microbiome census data. PLoS ONE. 2013;8:e61217.
- Love MI, Huber W, Anders S. Moderated estimation of fold change and dispersion for RNA-seq data with DESeq2. Genome Biol. 2014;15:550.
- R Core Team. R: a language and environment for statistical computing [Internet]. Vienna Austria: R Foundation for Statistical Computing; 2013. Available from: http://www.R-project.org/
- Hadley W. ggplot2: Elegant graphics for data analysis [Internet]. Springer-Verlag New York; 2016. Available from: https://ggplot2.tidyverse.org
- Waskom M, Botvinnik O, Gelbart M, et al. mwaskom/seaborn: v0.11.0 (Sepetmber 2020) [Internet]. Zenodo; 2020 cited 2020 Nov 27]. Available from 2020 Nov 27: https://zenodo.org/record/592845
- RStudioTeam. RStudio: integrated development for R. RStudio [Internet]. PBC, Boston MA: 2020. Available from http://www.rstudio.com/
- Vlachos IS, Zagganas K, Paraskevopoulou MD, et al. DIANA-miRPath v3.0: deciphering microRNA function with experimental support. Nucleic Acids Res. 2015;43:W460–466.
- Kanehisa M, Goto S. KEGG: Kyoto encyclopedia of genes and genomes. Nucleic Acids Res. 2000;28:27–30.
- Klein SL, Flanagan KL. Sex differences in immune responses. Nat Rev Immunol. 2016;16:626–638.
- Tarrant JM. Blood cytokines as biomarkers of in vivo toxicity in preclinical safety assessment: considerations for their use. Toxicol Sci. 2010;117:4–16.
- Moreno-Martinez L, Calvo AC, Muñoz MJ, et al. Are circulating cytokines reliable biomarkers for amyotrophic lateral sclerosis? Ijms. 2019;20:2759.
- Banerjee S, Cui H, Xie N, et al. Regulates differential activation of macrophages and inflammation. J Biol Chem. 2013;288:35428–35436. miR-125a-5p.
- Li J, He W, Wang Y, et al. miR-103a-3p alleviates oxidative stress, apoptosis, and immune disorder in oxygen-glucose deprivation-treated BV2 microglial cells and rats with cerebral ischemia-reperfusion injury by targeting high mobility group box 1. Ann Transl Med. 2020;8:1296.
- Zhang H, Lu X, Hao Y, et al. MicroRNA-26a-5p alleviates neuronal apoptosis and brain injury in intracerebral hemorrhage by targeting RAN binding protein 9. Acta Histochem. 2020;122:151571.
- Wei R, Zhang L, Hu W, et al. Long non-coding RNA AK038897 aggravates cerebral ischemia/reperfusion injury via acting as a ceRNA for miR-26a-5p to target DAPK1. Exp Neurol. 2019;314:100–110.
- Leprivier G, Remke M, Rotblat B, et al. The eEF2 kinase confers resistance to nutrient deprivation by blocking translation elongation. Cell. 2013;153:1064–1079.
- Kameshima S, Okada M, Yamawaki H. Eukaryotic elongation factor 2 (eEF2) kinase/eEF2 plays protective roles against glucose deprivation-induced cell death in H9c2 cardiomyoblasts. Apoptosis. 2019;24:359–368.
- Bouma HR, Ketelaar ME, Yard BA, et al. AMP-activated protein kinase as a target for preconditioning in transplantation medicine. Transplantation. 2010;90:353–358.
- Kanellis J, Ma FY, Kandane-Rathnayake R, et al. JNK signalling in human and experimental renal ischaemia/reperfusion injury. Nephrol Dialysis Transplantation. 2010;25:2898–2908.
- Hess J, Angel P, Schorpp-Kistner M. AP-1 subunits: quarrel and harmony among siblings. J Cell Sci. 2004;117:5965–5973.
- Raivich G, Behrens A. Role of the AP-1 transcription factor c-Jun in developing, adult and injured brain. Prog Neurobiol. 2006;78:347–363.
- Weston CR, Davis RJ. The JNK signal transduction pathway. Curr Opin Cell Biol. 2007;19:142–149.
- Ventura -J-J. JNK potentiates TNF-stimulated necrosis by increasing the production of cytotoxic reactive oxygen species. Genes Dev. 2004;18:2905–2915.
- Xu Y, Liu M, Peng B, et al. Protective effects of SP600125 on renal ischemia-reperfusion injury in rats. J Surg Res. 2011;169:e77–84.
- Yao Q, Chen Y, Zhou X. The roles of microRNAs in epigenetic regulation. Curr Opin Chem Biol. 2019;51:11–17.
- Sohel MH. Extracellular/circulating microRNAs: release mechanisms, functions and challenges. Achievements in the Life Sciences. 2016; 10:175–186.
- Bär C, Thum T, de Gonzalo-calvo D. Circulating miRNAs as mediators in cell-to-cell communication. Epigenomics. 2019;11:111–113.
- Boon RA, Vickers KC. Intercellular transport of microRNAs. Arterioscler Thromb Vasc Biol. 2013;33:186–192.
- Zisoulis DG, Kai ZS, Chang RK, et al. Autoregulation of microRNA biogenesis by let-7 and argonaute. Nature. 2012;486:541–544.
- Stavast C, Erkeland S. The non-canonical aspects of microRNAs: many roads to gene regulation. Cells. 2019;8:1465.
- Xiao M, Li J, Li W, et al. MicroRNAs activate gene transcription epigenetically as an enhancer trigger. RNA Biol. 2017;14:1326–1334.
- Weinberg MS, Morris KV. Transcriptional gene silencing in humans. Nucleic Acids Res. 2016;44:6505–6517.
- L-c L. Chromatin remodeling by the small RNA machinery in mammalian cells. Epigenetics. 2014;9:45–52.
- Hansen TB, Wiklund ED, Bramsen JB, et al. miRNA-dependent gene silencing involving Ago2-mediated cleavage of a circular antisense RNA: miRNA mediated cleavage of circular antisense RNA. EMBO J. 2011;30:45–52.
- Liang H, Zhang J, Zen K, et al. Nuclear microRNAs and their unconventional role in regulating non-coding RNAs. Protein Cell. 2013;4:325–330.
- Salmanidis M, Pillman K, Goodall G, et al. Direct transcriptional regulation by nuclear microRNAs. Int J Biochem Cell Biol. 2014;54:304–311.
- Leucci E, Patella F, Waage J, et al. microRNA-9 targets the long non-coding RNA MALAT1 for degradation in the nucleus. Sci Rep. 2013;3:2535.
- Chiyomaru T, Fukuhara S, Saini S, et al. Long non-coding RNA HOTAIR is targeted and regulated by miR-141 in human cancer cells. J Biol Chem. 2014;289:12550–12565.
- Tam S, Tsao M-S, McPherson JD. Optimization of miRNA-seq data preprocessing. Brief Bioinform. 2015;16:950–963.
- Shi Y, He M. Differential gene expression identified by RNA-Seq and qPCR in two sizes of pearl oyster (Pinctada fucata). Gene. 2014;538:313–322.
- Wu AR, Neff NF, Kalisky T, et al. Quantitative assessment of single-cell RNA-sequencing methods. Nat Methods. 2014;11:12550–12556.
- Griffith M, Griffith OL, Mwenifumbo J, et al. Alternative expression analysis by RNA sequencing. Nat Methods. 2010;7:843–847.
- Everaert C, Luypaert M, Maag JLV, et al. Benchmarking of RNA-sequencing analysis workflows using whole-transcriptome RT-qPCR expression data. Sci Rep. 2017;7:1559.