
ABSTRACT
Cadmium (Cd) is a toxic metal ubiquitous in the environment. In utero, Cd is inefficiently transported to the foetus but causes foetal growth restriction (FGR), likely through impairment of the placenta where Cd accumulates. However, the underlying molecular mechanisms are poorly understood. Cd can modulate the expression of imprinted genes, defined by their transcription from one parental allele, which play critical roles in placental and foetal growth. The expression of imprinted genes is governed by DNA methylation at Imprinting Control Regions (ICRs), which are susceptible to environmental perturbation. The imprinted gene Cdkn1c/CDKN1C is a major regulator of placental development, is implicated in FGR, and shows increased expression in response to Cd exposure in mice. Here, we use a hybrid mouse model of in utero Cd exposure to determine if the increase in placental Cdkn1c expression is caused by changes to ICR DNA methylation and loss of imprinting (LOI). Consistent with prior studies, Cd causes FGR and impacts placental structure and Cdkn1c expression at late gestation. Using polymorphisms to distinguish parental alleles, we demonstrate that increased Cdkn1c expression is not driven by changes to DNA methylation or LOI. We show that Cdkn1c is expressed primarily in the placental labyrinth which is proportionally increased in size in response to Cd. We conclude that the Cd-associated increase in Cdkn1c expression can be fully explained by alterations to placental structure. These results have implications for understanding mechanisms of Cd-induced placental dysfunction and, more broadly, for the study of FGR associated with increased Cdkn1c/CDKN1C expression.
Introduction
Cadmium (Cd) is a toxic heavy metal found ubiquitously throughout the environment. Identified as one of the top 10 chemicals of major public health concern by the World Health Organization, its adverse health effects include carcinogenesis, tubular impairment, and rapid bone demineralization [Citation1,Citation2]. With poor excretion rates and a long biological half-life of up to 30 years, Cd accumulates within organs inducing cytotoxicity, endocrine disruption, morphological changes, as well as disrupted epigenetic and gene expression profiles [Citation3–6].
Exposure to Cd during in utero development is associated with foetal growth restriction (FGR), malformation, and spontaneous abortion [Citation7]. FGR is defined as foetal weight that is below the 10th percentile for gestational age. FGR is most commonly caused by placental insufficiency, defined as the improper formation of the placenta and the inability to provide sufficient gas and nutrient exchange [Citation8–10]. Absorption of Cd is increased during pregnancy and it accumulates within the placenta, altering its morphology and transcriptional profile. Unlike other toxic metals including lead and arsenic, Cd does not cross the placental barrier efficiently, suggesting that the adverse effects of Cd on foetal development are primarily due to impaired placental function [Citation11,Citation12].
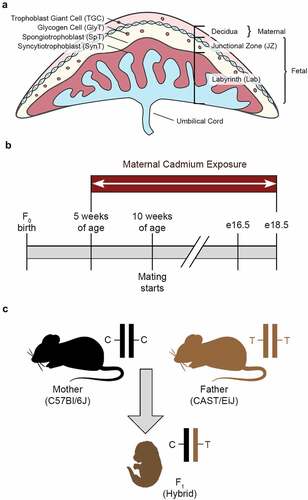
The murine placenta is comprised of three distinct layers: decidua, junctional zone (JZ), and labyrinth (Lab) () [Citation13,Citation14]. The decidua is of maternal origin and is separated from the JZ by a layer of trophoblast giant cells (TGCs), which mediate implantation and spiral artery formation [Citation15,Citation16]. The JZ is primarily composed of glycogen trophoblasts (GlyTs) and spongiotrophoblasts (SpTs), which serve as an energy store and the site of synthesis and secretion of hormones necessary for placental and foetal development [Citation9]. The Lab is comprised of syncytiotrophoblasts (SynT) that line the branched villi of the foetal vasculature enabling gas and nutrient exchange with the foetus [Citation17].
Figure 1. Murine placenta and experimental design (a) Mouse placental structure. (b) Mouse exposure and mating timeline. (c) Generation of hybrid F1 mice. Parental alleles in the F1 hybrid mice can be distinguished by SNPs.
Proper placental development requires high and prolific expression of imprinted genes, defined by their transcription from only one allele in a parent-of-origin specific manner. Imprinted genes are characterized by allele-specific DNA methylation at Imprinting Control Regions (ICRs), which acts in concert with other epigenetic mechanisms including post-translational histone modifications and long non-coding RNAs (lncRNAs) to regulate monoallelic expression [Citation18]. To date more than 150 human and mouse imprinted genes have been identified. Imprinted genes play key roles in regulating growth and development, and many of them are dysregulated in human foetuses affected by FGR [Citation19,Citation20]. Functional links between imprinted genes and FGR are further supported by mouse models of imprinted gene manipulation [Citation21]. Many of the imprinted growth regulators associated with FGR are expressed in the placenta, and in some cases disruption of these genes in the placenta alone is sufficient to induce FGR [Citation22,Citation23].
We and others have shown that exposure to environmental stressors during development can modulate imprinted gene expression with consequences for growth, development and disease [Citation24–27]. Cd exposure during development is associated with altered DNA methylation profiles at ICRs in human foetal cord blood [Citation28], suggesting that Cd could alter imprinted gene expression through an epigenetic mechanism. However, the effects of Cd on imprinted genes specifically in the placenta are not well understood. Therefore, determining whether Cd impacts ICR DNA methylation and modulates imprinted gene expression in this organ is important in understanding the mechanisms of Cd-induced FGR.
Cyclin-dependent kinase inhibitor 1C (Cdkn1c/CDKN1C) is an imprinted gene and potent growth regulator that functions by inhibiting the activity of cyclin-dependent kinases to control cell proliferation and differentiation [Citation29]. In mice, subtle changes to Cdkn1c expression can dramatically affect developmental size [Citation30]. In humans, CDKN1C loss-of-function mutations are associated with 5–10% of cases of the overgrowth disorder Beckwith-Wiedemann syndrome (BWS) and microduplications of the locus are implicated in Silver Russell syndrome (SRS) characterized by FGR [Citation31,Citation32]. Murine Cdkn1c is expressed from the maternally inherited allele and located within the Kcnq1 locus on chromosome 7, which consists of one paternally expressed and seven maternally expressed imprinted genes. The imprinting status and organization of the human KCNQ1 locus is conserved on chromosome 11 [Citation32]. Correct imprinted Cdkn1c expression is dependent on a hierarchy of epigenetic mechanisms. Allele-specific methylation established in the germline at the KvDMR1 ICR regulates paternally expressed Kcnq1ot1, a long non-coding RNA. Monoallelic expression of Kcnq1ot1 is required for the establishment of the Cdkn1c somatic ICR during post-fertilization development [Citation33,Citation34]. This ICR, which spans the Cdkn1c promoter and part of the gene body, is methylated on the paternally inherited allele where it represses Cdkn1c transcription.
Cdkn1c is susceptible to dysregulation by the developmental environment. In mice, exposure to a low protein diet during in utero development disrupts methylation patterns at the somatic ICR that persist into adulthood [Citation26]. The relationship between differential methylation and low protein intake at this locus has also been reported in human infants, where hypermethylation at the germline ICR is associated with maternal low protein and lipid consumption [Citation35]. In a mouse model of Cd-induced FGR, Cdkn1c transcript and protein levels are increased specifically in the placenta but the underlying causative mechanism is unclear [Citation6]. Based on these observations, and the known association between Cd exposure and DNA methylation changes at ICRs, we hypothesized that Cd exposure during in utero development is associated with loss of methylation at the Cdkn1c somatic ICR, causing a loss of imprinting (LOI) and increased Cdkn1c expression within the placenta leading to FGR. We tested this hypothesis using a hybrid mouse model of in utero Cd exposure, generated by crossing two divergent inbred strains to allow for discrimination of the parental alleles. We used micropunches to collect RNA separately from the JZ and Lab to determine how Cd affects both allele- and layer-specific expression of Cdkn1c. Together, our data provide novel insight into the effects of Cd on somatic and germline ICRs, placental morphology, and mechanisms of Cd-induced FGR.
Methods
Cd exposure and tissue collection
Animal work was approved by the North Carolina State University Institutional Animal Care and Use Committee, under protocols 16–045-B and 19–049-B. All mice were on a 14-hour/10-hour light/dark cycle at 30–70% humidity, 22°C ± 4°C. 5-week-old C57Bl/6J (B) female mice were exposed for 5 weeks to 0, 1, or 50 ppm CdCl2 through drinking water (Sigma-Aldrich, 202908). At 10 weeks B mice were mated with unexposed CAST/EiJ (C) males. Cd exposure continued throughout mating and gestation (). Embryos and placentae were dissected at e16.5 or e18.5; collected tissues were weighed, snap-frozen immediately upon dissection and stored at −80°C, or prepared for histological analysis as described below.
To isolate layer-specific tissue, micropunches (0.75 mm and 0.50 mm) were taken from the Lab and JZ, respectively, of fresh frozen e18.5 placentae using a cryostat. Unfixed placental samples were partially embedded in OCT compound (Tissue-Tek) to allow sectioning and punches to be taken from unembedded tissue. Punches were taken by hand and positioned visually using colouration of tissue to distinguish layers. Punches were pressed into each layer approximately 1–2 mm and removed carefully without disrupting surrounding tissue. All tissue punches were collected at −20°C and placed directly into homogenization buffer. 10 μm sections were taken from each sample before and after punching of each layer, sections were stored at −80°C, then prepared and stained with haematoxylin and eosin (H&E) using standard staining protocols to ensure layer specificity.
Nucleic acid isolation
For each exposure group at both e16.5 and e18.5, eight male and eight female placental samples representing at least four litters from independent dams were selected for further analysis. Tissues were homogenized and DNA/RNA was isolated with an AllPrep DNA/RNA/miRNA kit (Qiagen). DNA/RNA from layer-specific tissues were isolated using AllPrep DNA/RNA Micro kit (Qiagen). Nucleic acids were quantified on a Nanodrop 2000 and RNA integrity was confirmed by electrophoresis.
qRT-PCR
500 ng of total RNA from whole placenta or 100 ng of total RNA from micropunches was used to synthesize first strand cDNA according to the manufacturer’s protocol (M-MLV RT enzyme, Promega). qRT-PCR was performed in triplicate on 96-well plates with a QuantStudio 3 Real-Time PCR system (Applied Biosystems) using SsoAdvanced Universal SYBR Green Supermix (Bio-Rad). The cycling conditions were as follows: 95°C for 30 s; 40 cycles of 95°C for 15 s, 60°C for 30 s; dissociation curve of 60.0°C–95.0°C. The primer sequences are provided in Supplementary Table 1. Polr2a was used as a reference gene and was not significantly differentially expressed between treatment groups (data not shown). Gene expression was quantified using the ΔΔCt method [Citation36].
DNA methylation analysis
Genomic DNA was isolated as described above, then treated with sodium bisulphite using the Zymo EZ DNA Methylation Kit (Zymo Research). Bisulphite-converted DNA (bsDNA) was amplified by PCR and products were confirmed on an agarose gel. PCR amplicons were then pyrosequenced using a Pyromark Q96 MD Pyrosequencer (Qiagen). The primer sequences are provided in Supplementary Table 1. Methylation was determined for each CpG dinucleotide using Pyromark software (Qiagen).
Allele-specific expression analysis
cDNA was generated as described above and amplified by PCR using gene-specific primers. Products were confirmed on an agarose gel. Forward and reverse primers were designed using Pyromark software to include an SNP within the amplified and sequenced region to assign transcripts to the parental alleles. The primer sequences are provided in Supplementary Table 1. PCR amplicons were pyrosequenced as described above and the percent contribution of the two alleles to total transcript abundance was determined.
Bisulphite PCR, cloning and sequencing
bsDNA was generated as described above and amplified by PCR. PCR products were purified with the DNA Clean and Concentrator 5 kit (Zymo Research). The primer sequences are provided in Supplementary Table 1. Concentrated DNA amplicons were ligated into the pGEM-T Easy Vector (Promega). Plasmids were transformed into DH5α Competent Cells (Invitrogen) and cultured overnight according to the manufacturer’s protocol. Isolated colonies were selected through blue-white screening in the presence of X-gal (Meridian Bioscience) and IPTG (Meridian Bioscience) and cultured overnight. Plasmid DNA was isolated from liquid culture with Wizard Plus SV Minipreps DNA Purification Systems (Promega) and submitted to the NC State University Genomic Sciences Laboratory for sequencing using Sanger sequencing. Quality control and methylation analysis was completed using BiQ Analyser software [Citation37].
Reduced representation bisulphite sequencing
Genomic DNA was isolated from four female 0 ppm and four female 50 ppm exposed placentae, as described above. 100 ng of gDNA was digested with TaqaI (NEB) at 65°C for 2 hours followed by MspI (NEB) at 37°C overnight. Following enzymatic digestion, samples were used for library generation using the Ovation RRBS Methyl-Seq System (Tecan) following the manufacturer’s instructions. In brief, digested DNA was randomly ligated, and, following fragment end repair, bisulphite converted using the EpiTect Fast DNA Bisulphite Kit (Qiagen) following the Qiagen protocol. After conversion and clean-up, samples were amplified resuming the Ovation RRBS Methyl-Seq System protocol for library amplification and purification.
Libraries were measured using the Agilent 2200 TapeStation System and quantified using the KAPA Library Quant Kit ABI Prism qPCR Mix (Roche). Libraries were sequenced on a NextSeq 550 using single end 75 bp sequencing.
Following sequencing, the Illumina adapter reads were trimmed using Trim Galore! and a custom script was used to trim additional bases added during library creation to facilitate sequencing. Reads were mapped to the genome using Bismark and Bowtie 2 allowing for no mismatches. Following alignment, PCR duplicates were removed using a custom script. Each unique read had a randomized 6-mer barcode and if more than one read had the same start and end coordinates and the same barcode, all but one of the reads were discarded. Methylation at CpG sites was extracted using Bismark and CpG sites covered by at least 10 reads were analysed using the methylKit R package. Differentially methylated bases and regions were identified using a Fisher’s exact test for pairwise comparisons and a Chi-squared test for analyses with more than two groups. Data are deposited in the Gene Expression Omnibus under accession number GSE206182.
Histology
Placentae were collected at e18.5 and fixed in 4% formaldehyde for 24 hours. Fixed placentae were delivered in 70% ethanol to the NC State Histology Laboratory for dehydration and paraffin embedding. 10 µm‐thick sections were prepared and stained with H&E using standard staining protocols. Area fractions were determined using four samples from 0, 1, and 50 ppm exposure groups with a minimum of 4 sections analysed per sample. Total area was calculated using measurement tools in Photoshop (Adobe) and Lab and JZ area fractions were determined as percentage of total area.
Statistical analysis
All statistical analyses unless otherwise specified were performed using a one-way analysis of variance (ANOVA) or Student’s t-test. Data are presented as the mean ± standard error of the mean. *p < 0.05, **p < 0.01, ***p < 0.001, ****p < 0.0001. The numbers of animals, litters and samples used in each experiment are presented in Supplementary Table 2.
Results
In utero Cd exposure results in foetal growth restriction and altered organ weight
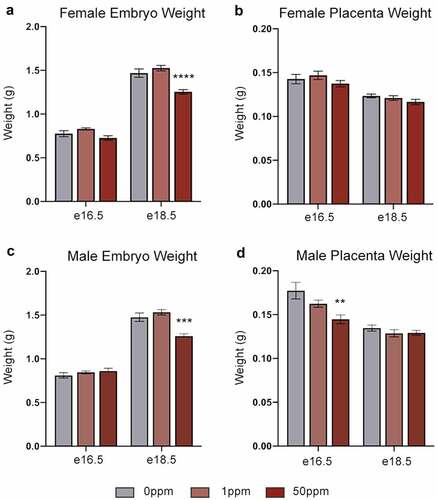
In utero Cd exposure causes reduced birth weights [Citation7] as well as alterations to organ weight and function [Citation38–40]. To study the underlying molecular mechanisms, we established a mouse model of in utero Cd exposure. B dams were exposed to 0 ppm, 1 ppm, or 50 ppm CdCl2 through drinking water for 5 weeks before mating with unexposed C males, and BxC hybrid embryos were collected at two time points, e16.5 and e18.5 (). Cd exposure had no impact on litter size or sex ratio (data not shown). Embryo weights of both females and males were unaffected in response to either CdCl2 concentration at e16.5 but were significantly decreased in response to 50 ppm CdCl2 at e18.5 (). In females, placental weights were unchanged in response to either CdCl2 concentration at both time points (). Male placentae showed a significant decrease at e16.5 in response to 50 ppm CdCl2 but this did not persist at 18.5 (). When placenta weights were expressed as a proportion of total embryo weights, female e18.5 placentas were significantly decreased and male e16.5 placentas were significantly increased, relative to their respective controls (Figure S1). Given our observation of Cd-associated foetal growth restriction, all embryonic organ weights were analysed as a proportion of total embryo weight. Females at e16.5 showed a significant decrease in liver weight in response to 50 ppm CdCl2, and heart weight in response to 1 ppm CdCl2 (). Males at e16.5 showed a significant decrease in liver weight at the 50 ppm CdCl2 concentration (). In both female and male e18.5 samples, brain and heart weights significantly increased, and liver weight significantly decreased in response to 50 ppm exposure (). Lung weight significantly decreased in females, but not males, exposed to 50 ppm CdCl2 (). These data show that 50 ppm CdCl2 exposure is associated with a strong foetal growth restriction phenotype at e18.5 and suggest the potential for liver, heart, lung, and brain dysfunction during development.
Figure 3. Effects of CdCl2 exposure on organ weights. All weights are normalized to embryonic weight and presented relative to controls. (a, b) Weights of e16.5 (a) and e18.5 (b) female organs. (c, d) Weights of e16.5 (c) and e18.5 (d) male organs. Data are presented as means ± SE. One-way ANOVA with Dunnett’s post-hoc test comparing 50 ppm and 1 ppm to 0 ppm. <p < 0.05, **p < 0.01, ***p < 0.001, ****p < 0.0001.
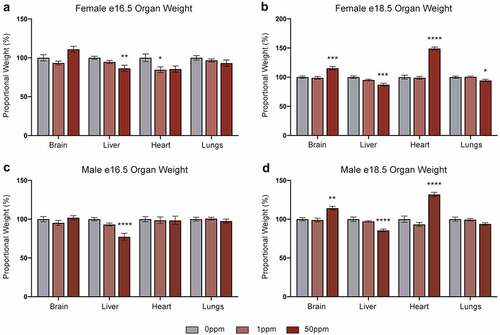
Figure 2. Effects of CdCl2 exposure on embryo and placenta weights (a, b) Weights of e16.5 and e18.5 female embryos (a) and placentae (b). (c, d) Weights of e16.5 and e18.5 male embryos (c) and placentae (d). Data are presented as means ± SE. One-way ANOVA with Dunnett’s post-hoc test comparing 50 ppm and 1 ppm to 0 ppm. *p<0.05, **p <0.01,***p<0.001, ****p<0.0001.
Cd exposure causes increased placental Cdkn1c expression
To determine the effects of Cd on Cdkn1c expression and the potential disruption to neighbouring imprinted genes within the Kcnq1 locus (), mRNA abundance in the placenta was analysed by qRT-PCR. As 50 ppm CdCl2 exposure had the strongest effects on organ and embryo weights, further analyses were conducted on placental tissue from the 0 ppm and 50 ppm exposure groups only.
Figure 4. The Kcnq1 locus and Cdkn1c expression. (a) Organization of the Kcnq1 locus showing paternally (p) expressed Kcnq1ot1, and the maternally (m) expressed Cdkn1c and Kcnq1 genes. Shaded circles represent methylated CpGs, unshaded circles represent unmethylated CpGs, CpG clusters represent ICRs. (b, c) Cdkn1c transcript abundance in e16.5 (b) and e18.5 (c) female placental samples. (d) Ratio of Cdkn1c transcripts in female placental samples derived from the maternally- and paternally inherited alleles. (e, f) Cdkn1c transcript abundance in e16.5 (e) and e18.5 (f) male placental samples. (g) Ratio of Cdkn1c transcripts in male placental samples derived from the maternally- and paternally inherited alleles. Data are presented as means ± SE. Student’s t-test, two-tailed, comparing 0 ppm and 50 ppm. *p < 0.05, **p < 0.01.
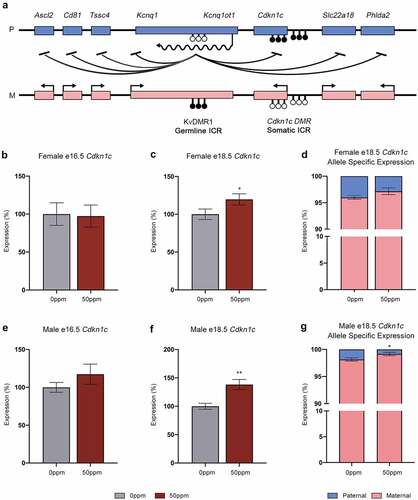
Expression of Cdkn1c was not altered at e16.5 in females () or males (), however at e18.5 it was significantly increased in both sexes due to CdCl2 exposure (). To determine whether this increased abundance is caused by inappropriate activation of the paternal allele, pyrosequencing was used to measure the contributions of the two parental alleles independently at e18.5. We exploited a single nucleotide polymorphism (SNP) between the parental B and C genomes to enable allelic discrimination. In female control placentae, 95% of Cdkn1c transcripts were derived from the maternal allele with no significant change to the percentage contribution in response to 50 ppm CdCl2 exposure (). Males displayed a significant increase in the ratio of maternal to paternal Cdkn1c transcripts in response to 50 ppm CdCl2 (). These data demonstrate that the increase in Cdkn1c expression is not due to activation of the repressed paternal allele, i.e., no LOI. An independent approach using qRT-PCR with primers specific to each of the parental alleles confirmed this result (data not shown).
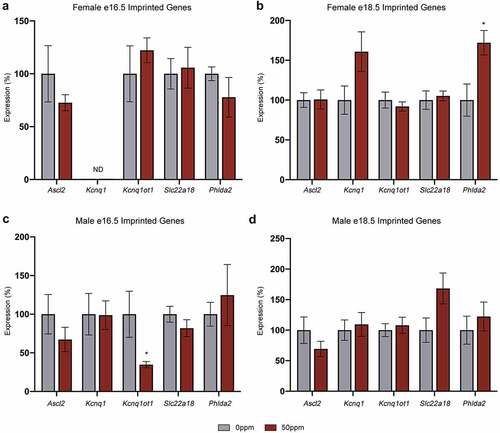
As Kcnq1ot1 establishes the imprinting status of genes within the Kcnq1 locus, the expression profiles of Kcnq1ot1, as well as Ascl2, Slc22a18, Phlda2, and Kcnq1, were analysed (). At e18.5, exposure to CdCl2 is associated with an increase in Phlda2 expression in females but not in males. The only other difference in expression was a reduction in Kcnq1ot1 in males at e16.5 in response to CdCl2 exposure. These results suggest that there is no broad disruption to imprinting at the Kcnq1 locus.
Figure 5. Gene expression at the Kcnq1 locus in placentae (a, b) Ascl2, Kcnq1, Kcnq1ot1, Slc22a18, and Phlda2 transcript abundance in e16.5 (a) and e18.5 (b) female placental samples. (c, d) Ascl2, Kcnq1, Kcnq1ot1, Slc22a18, and Phlda2 transcript abundance in e16.5 (c) and e18.5 (d) male placental samples. Data are presented as means ± SE. Student’s t-test, two-tailed, comparing 0 ppm and 50 ppm. *p < 0.05. ND = not detected.
Cd does not affect the methylation profile of the KvDMR1 or Cdkn1c somatic ICR in the placenta
Given the consistent effects of Cd on Cdkn1c expression in males and females, we focused on females only in our subsequent experiments. To determine the effects of Cd exposure on methylation status within the Kcnq1 locus at e18.5, pyrosequencing was used to analyse subsets of 4–8 CpG dinucleotides within the Cdkn1c somatic ICR and the KvDMR1 germline ICR. The Cdkn1c ICR consists of CpGs from –481 to +1946 relative to the Cdkn1c transcription start site. Four regions covering 23 CpGs across the ICR were analysed, comprised of two regions within the promoter (promoter site 1 (position −81 to −31) and promoter site 2 (position −23 to +27)) and two intragenic regions (intragenic site 1 (position +167 to +203) and intragenic site 2 (position +262 to +294)).
Only one of the 23 individual CpG dinucleotides analysed by pyrosequencing across the Cdkn1c somatic ICR showed a significant change in methylation (specifically a reduction) in response to 50 ppm CdCl2 exposure (). When data from these 23 CpGs were combined, there was no significant difference in methylation between the 0 and 50 ppm CdCl2 exposure groups (Figure S2). No changes in methylation were observed at any of the individual CpGs within KvDMR1 ().
Figure 6. Methylation of Cdkn1c somatic ICR and KvDMR1 in female e18.5 placentae. (a, b) Percent methylation of two subsets of CpGs within the promoter of the Cdkn1c ICR in female e18.5 placental samples, quantified by pyrosequencing. (c, d) Percent methylation of 2 subsets of CpGs within the intragenic portion of the Cdkn1c ICR in female e18.5 placental samples, quantified by pyrosequencing. (e) Percent methylation for a subset of CpGs at KvDMR1 in female e18.5 placental samples, quantified by pyrosequencing. (f) Percent methylation on the paternal allele for a subset of CpGs at the Cdkn1c promoter in female e18.5 placental samples, quantified through amplification, cloning and sequencing of bisulphite-modified DNA. (g) Visual depiction of the methylation profiles of representative samples from each of the treatment groups. Each row represents a single unique amplicon. Open circles represent unmethylated CpGs, shaded circles represent methylated CpGs, missing circles represent incomplete sequence data. Data are presented as means ± SE. Student’s t-test, two-tailed, comparing 0 ppm and 50 ppm. **p < 0.01.
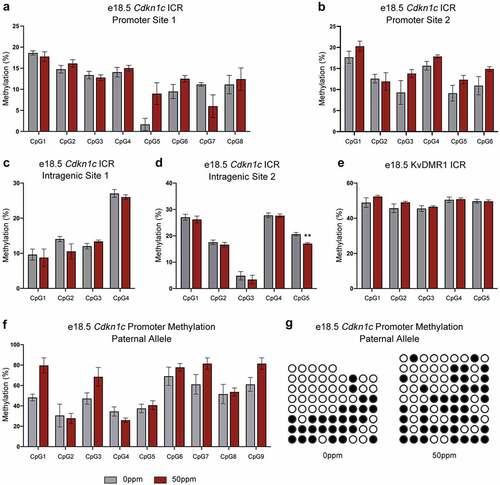
We validated the results at the Cdkn1c promoter by cloning and sequencing a separate section of the ICR that includes nine CpG dinucleotides (position −510 to −427 relative to the Cdkn1c transcription start site). This approach also enabled us to assign parental origin to the methylation profiles by exploiting an SNP within the amplified region. When clones were separated into those of maternal and paternal origin, no differences in methylation were observed on either allele in response to exposure ( and data not shown).
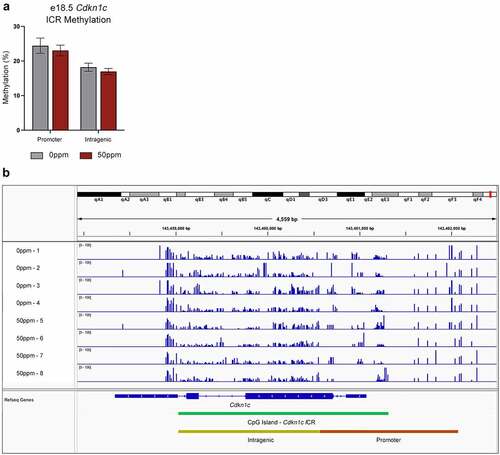
To further analyse the methylation state across the Cdkn1c somatic ICR, we performed RRBS on e18.5 female placentae. Consistent with our findings from targeted assays, neither the promoter or intragenic sites of the ICR were differentially methylated between 0 ppm and 50 ppm samples (). Genome-wide, only 66 differentially methylated CpGs were identified by RRBS, none of which mapped to the Cdkn1c somatic ICR or indeed to the entire Kcnq1 locus (Supplementary Table 3). Furthermore, no differentially methylated CpGs mapped to known ICRs within other imprinted domains across the genome.
Figure 7. RRBS analysis of Cdkn1c somatic ICR methylation in female placentae. (a) Total percent methylation across the Cdkn1c somatic ICR promoter and intragenic regions as measured by RRBS. (b) Visualization of methylated CpGs across the Cdkn1c promoter and gene for four 0 ppm and four 50 ppm exposed placental samples. Peak height represents percent methylation.
Together, these data from targeted and genome-wide approaches demonstrate that Cd exposure is not associated with a loss of methylation at the Cdkn1c somatic ICR. This provides further support that the Cd-associated increase in Cdkn1c expression in the placenta is not caused by LOI. Furthermore, there is no detectable loss of methylation at the KvDMR1 germline ICR, which together with the gene expression data indicate no apparent disruption to the imprinting mechanisms responsible for somatic ICR establishment within the Kcnq1 locus.
The labyrinth fraction of the placenta is increased in response to Cd exposure
To determine how Cd affects the spatial expression of Cdkn1c, micropunches were taken from frozen sections of e18.5 female placentae and Cdkn1c mRNA abundance was analysed. To confirm the accuracy of the punches, placental sections were taken before and after each punch and stained with H&E for visual inspection (). qRT-PCR was performed on each punch for the layer-specific markers Gcm1 and Tpbpa, specific to Lab and JZ respectively (). Together, these results confirmed the specificity of punches to each respective layer. Cdkn1c mRNA abundance was analysed by qRT-PCR across both layers, confirming its expression to be primarily within the Lab (). In contrast to qRT-PCR data from whole placenta, expression of Cdkn1c was not significantly changed in either layer in response to 50 ppm CdCl2.
Figure 8. Placental layer-specific gene expression and area fraction analysis. (a) H&E stained sections of a representative fresh frozen e18.5 female placenta prior to micropunches (top), after JZ micropunch (middle) and after Lab micropunch (bottom), showing the relative locations and sizes of the tissue micropunches. Scale bar = 500 μm. (b, c) Gcm1 (b) and Tpbpa (c) transcript abundance in e18.5 female placental Lab and JZ, demonstrating the specificity of the micropunches to each layer. Data are normalized to transcript abundance in the 0 ppm Lab (Gcm1) or 0 ppm JZ (Tpbpa). ND = not detected. (d) Cdkn1c transcript abundance in e18.5 female placental Lab and JZ. Data are normalized to transcript abundance in the 0 ppm Lab. (e) Representative e18.5 female placental samples paraffin-embedded and stained with H&E for area fraction analysis. Scale bar = 1 mm. (f) Area fractions of Lab and JZ calculated from total area visualized through H&E staining. Data are presented as means ± SE. B, C, E analysed by one-way ANOVA with Tukey’s post-hoc test comparing 0 ppm to 50 ppm exposures within Lab and JZ, and Lab to JZ within each 0 ppm and 50 ppm exposures. **p < 0.01, ***p < 0.001, ****p < 0.0001. F analysed by Student’s t-test, two-tailed, comparing 0 ppm and 50 ppm. ***p < 0.001. ND = not detected.
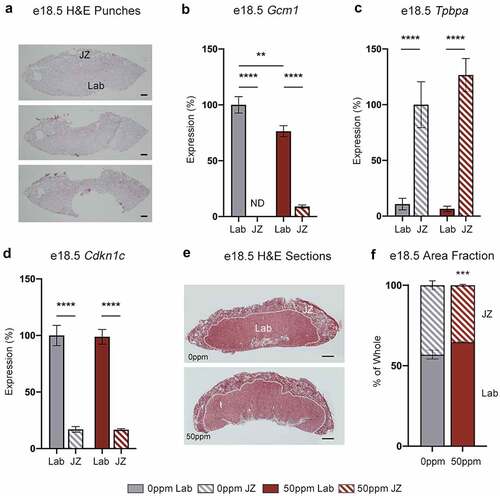
Separately, e18.5 female formaldehyde-fixed placental sections were stained with H&E and the relative proportions of the Lab and JZ were analysed (). The ratio of Lab to JZ was significantly increased in response to 50 ppm CdCl2 exposure (). Given that Cdkn1c is primarily expressed within the Lab, the Cd-induced increase in Cdkn1c observed in whole placenta could be explained by this morphological change to the placenta. To provide further support for this theory, we identified additional markers of the Lab and JZ, and analysed their expression in whole placental and micropunch samples. MafF, a basic region leucine zipper (bZIP)-type transcription factor belonging to the Maf family, was previously described to be a marker of the JZ in rats [Citation41,Citation42]. We detected a significant CdCl2-associated decrease in MafF expression within female e18.5 whole placenta samples but no change within either the JZ or Lab in placental micropunches, indicating that the decrease in MafF transcript in whole placenta is likely to be due to a reduction in the MafF-expressing JZ (Figure S3A and B). Conversely, Phlda2, another member of the Kcnq1 locus, is specific to the Lab in mice and restricted to the villous cytotrophoblast in humans [Citation43,Citation44]. Phlda2 showed increased expression in 50 ppm exposed e18.5 female whole placental samples with no differential expression detected in layer-specific micropunches, mirroring the results of Cdkn1c ( and S3C).
DISCUSSION
FGR affects 5 to 10% of pregnancies and is associated with 30% of stillborn infants [Citation8]. The number one cause of FGR is placental insufficiency, driven by insufficient spiral artery invasion and improper placental morphology. Cd accumulates within the placenta inducing structural and functional changes, and high maternal blood Cd levels are inversely associated with low birth weights [Citation45,Citation46]. This is a major public health concern given the ubiquity of Cd in the human environment and the emerging links between in utero exposure and long-term disease [Citation47,Citation48]. While mechanisms for Cd induced placental insufficiency and FGR have been proposed including reduced progesterone synthesis, iron deficiency, and altered glucose metabolism and transport, the roles of critical imprinted growth regulatory genes in this context have not been widely studied. One study previously reported an increase in the placental growth regulator Cdkn1c in response to Cd exposure but the underlying mechanism is unclear [Citation6].
Given the susceptibility of ICRs to environmental perturbation in development, we hypothesized that the Cd-associated increased expression of Cdkn1c is caused by activation of the repressed paternally inherited allele through alterations to DNA methylation. We used a hybrid mouse model of in utero CdCl2 exposure to test this hypothesis, enabling the two parental alleles to be studied independently. Consistent with prior research, our results show a significant reduction in embryo weight at late gestation in response to CdCl2 exposure accompanied by an increase in total Cdkn1c transcript levels in whole placenta. By exploiting SNPs between the two parental strains, we demonstrated no CdCl2-associated increase in transcripts from the paternal allele. These data demonstrate that the increase in Cdkn1c transcripts is not due to LOI. This finding is consistent with human studies demonstrating that CDKN1C is more highly expressed in the placentae of children with FGR but that imprinting is maintained [Citation49].
In further support of no LOI, pyrosequencing, bisulphite PCR and sequencing, and RRBS did not identify any overall significant loss of methylation at the Cdkn1c somatic ICR. While RRBS provided extensive coverage of the ICR, it is not as sensitive as pyrosequencing and therefore it is possible that a more targeted approach could detect subtle methylation changes; indeed, we did detect a small but significant CdCl2-associated decrease in methylation at one CpG in intragenic site 2 by pyrosequencing. However, the fact that no transcriptional activation from the paternal allele was observed suggests that any such changes have no functional impact on Cdkn1c expression. While prior experiments have shown that low protein diet can perturb the methylation status of the Cdkn1c ICR in mice, these effects are not observed with CdCl2 exposure, suggesting that this ICR may be epigenetically modulated only by a specific subset of environmental stressors [Citation26].
Our genome-wide survey of DNA methylation identified 66 differentially methylated CpGs. While not as sensitive as targeted methylation analyses, these data from RRBS indicate limited effect of CdCl2 on the methylome in e18.5 placenta. Furthermore, none of these CpGs map to any of the characterized germline or somatic ICRs in the mouse genome, suggesting that any effects that Cd has on placental imprinted gene expression are independent of changes to DNA methylation. We previously reported Cd-associated methylation changes in human newborn cord blood and maternal blood at ICRs [Citation28]. The discrepancy with the current study could be explained by the differences in tissue type analysed. The placenta, alongside brain, has the highest number of expressed imprinted genes, and its development and function are intimately connected to correct imprinted gene dosage [Citation50]. Given this role, it may be that DNA methylation at ICRs is more tightly regulated in placenta than in blood.
A previous study [Citation6] reported a transient loss of methylation at the Cdkn1c promoter ICR in e16.5 placentae in response to 20 ppm and 40 ppm Cd exposure. This was only significant when the methylation states of multiple CpG dinucleotides were pooled, a result that we did not observe when pooling data from e18.5 females in our study (Figure S2). Consistent with our observations, Xu et al [Citation6] did not detect this difference at later time points and at e16.5 it is not associated with an increase in Cdkn1c transcript abundance. The impact, if any, of this subtle and transient change is therefore unclear.
Correlations between loss of methylation at the KvDMR1 and reduced expression of CDKN1C in BWS patients have been demonstrated [Citation51]. Furthermore, deletions of the KvDMR1 in mice lead to the failure to establish allele-specific methylation at the somatic ICRs and cause LOI across the Kcnq1 locus [Citation52,Citation53]. Therefore, the increase in CdCl2-associated Cdkn1c expression could be due to DNA methylation changes at the germline ICR. However, we detected no such changes, providing further support that the increase in Cdkn1c is not driven by epigenetic mechanisms at the locus.
While changes to total placenta weight were not detected, area fraction analysis shows a proportional increase in the Lab, the site of Cdkn1c expression. By taking fixed amounts of each layer using micropunches, we demonstrated no changes to Cdkn1c expression in either the Lab or the JZ, indicating that the increase identified in total placenta is likely due to disrupted placental morphology induced by CdCl2 exposure. In further support of this, MafF and Phlda2 – markers of the JZ and Lab, respectively – showed changes in expression between 0 and 50 ppm samples that reflected the morphological changes in the placenta, and no differences were detected in micropunches. Taken together with our extensive analysis of allele-specific expression and DNA methylation, we conclude that the increase in Cdkn1c expression reported by us and others can be fully explained by changes to the composition of the placenta and the gene is not transcriptionally modulated at the single cell level. This finding has implications for the study of CDKN1C-associated FGR in humans, in which increased CDKN1C expression could potentially be explained by structural changes in the placenta.
While previous studies have shown that Cd exposure causes reduced placental weight, our results show no change in their raw weight. One likely cause is the removal of the decidua during our collection procedure, which was required to eliminate maternal tissue contamination that might bias our downstream allele-specific analyses. TGCs present in the decidua invade and reconfigure maternal spiral arteries to optimize maternal blood flow for nutrient and gas exchange. It has been shown that trophoblast migration is decreased in Cd exposure models which may partially account for the reduced placental weight phenotypes reported previously [Citation54].
Despite conservation of function, placental structure is highly divergent among eutherians. While the human placenta is structurally different to that of the mouse, different cell types perform equivalent functions. For example, the Lab layer of the mouse placenta and the chorionic villi of the human placenta are functionally analogous, as are mouse TGCs and human extravillous cytotrophoblast cells. Mouse and human placentae are both hemochorial and disc-shaped, and their development is driven largely by homologous genes [Citation55–57]. Together, these observations support the use of mouse models to understand fundamental mechanisms of placental development and function.
Although we demonstrate no LOI of the growth regulator Cdkn1c in Cd-induced placental dysfunction, our data provide a proof of principle that the hybrid mouse model can facilitate the study of imprinted gene regulation in response to environmental stressors. Our future work will leverage this capability to determine the role of other imprinted genes in this context.
Supplemental Material
Download Zip (187.6 KB)Acknowledgments
This work was funded by the National Institutes of Health under K22ES027510, P30ES025128 and T32ES007046. We thank members of the Patisaul Lab for technical support and members of the Cowley Lab for helpful discussion of the work and the manuscript.
Disclosure statement
No potential conflict of interest was reported by the author(s).
Supplementary material
Supplemental data for this article can be accessed online at https://doi.org/10.1080/15592294.2022.2088173
Additional information
Funding
References
- Rahimzadeh MR, Rahimzadeh MR, Kazemi S, et al. Cadmium toxicity and treatment: an update. Casp J Intern Med. 2017;8(3):135–17.
- Satarug S, Garrett SH, Sens MA, et al. Cadmium, environmental exposure, and health outcomes. Environ Health Perspect. 2010;118(2):182–190.
- Nordberg CDW, Nair P. Methacholine test and the diagnosis of asthma. J Allergy Clin Immunol. 2012;130(2):556.
- Satarug S, Baker JR, Urbenjapol S, et al. A global perspective on cadmium pollution and toxicity in non-occupationally exposed population. Toxicol Lett. 2003;137(1–2):65–83.
- Wang Y, Wang X, Wang Y, et al. Effect of cadmium on cellular ultrastructure in mouse ovary. Ultrastruct Pathol. 2015;39(5):324–328.
- Xu P, Wu Z, Yang W, et al. Dysregulation of DNA methylation and expression of imprinted genes in mouse placentas of fetal growth restriction induced by maternal cadmium exposure. Toxicology. 2017;390(July):109–116.
- Geng H-X, Wang L. Cadmium: toxic effects on placental and embryonic development. Environ Toxicol Pharmacol. 2019;67:102–107.
- Nardozza LMM, Caetano ACR, Zamarian ACP, et al. Fetal growth restriction: current knowledge. Arch Gynecol Obstet. 2017;295(5):1061–1077.
- Woods L, Perez-Garcia V, Hemberger M. Regulation of placental development and its impact on fetal growth—new insights from mouse models. Front Endocrinol (Lausanne). 2018;9(September):1–18.
- Salavati N, Smies M, Ganzevoort W, et al. The possible role of placental morphometry in the detection of fetal growth restriction. Front Physiol. 2019;10(JAN). 1–12.
- Kot K, Kosik-Bogacka D, Łanocha-Arendarczyk N, et al. Interactions between 14 elements in the human placenta, fetal membrane and umbilical cord. Int J Environ Res Public Health. 2019;16(9):1–13.
- Brako EE, Wilson, AK, Jonah, MM. et al. Cadmium pathways during gestation and lactation in control versus metallothoinein 1,2-knockout mice. Toxicol Sci. 2003;71(2):154–163.
- Watson ED, Cross JC. Development of structures and transport functions in the mouse placenta. Physiology. 2005;20(3):180–193.
- Burton GJ, Jauniaux E. What is the placenta? Am J Obstet Gynecol. 2015;213(4):S6.e1–SS6.e4.
- Silva JF, Serakides R. Intrauterine trophoblast migration: a comparative view of humans and rodents. Cell Adhes Migr. 2016;10(1–2):88–110.
- Simmons DG, Fortier AL, Cross JC. Diverse subtypes and developmental origins of trophoblast giant cells in the mouse placenta. Dev Biol. 2007;304(2):567–578.
- Simmons DG, Cross JC. Determinants of trophoblast lineage and cell subtype specification in the mouse placenta. Dev Biol. 2005;284(1):12–24.
- Tucci V, Isles AR, Kelsey G, et al. Genomic imprinting and physiological processes in mammals. Cell. 2019;176(5):952–965.
- Cordeiro A, Neto AP, Carvalho F, et al. Relevance of genomic imprinting in intrauterine human growth expression of CDKN1C, H19, IGF2, KCNQ1 and PHLDA2 imprinted genes. J Assist Reprod Genet. 2014;31(10):1361–1368.
- Eggermann T, Perez de Nanclares G, Maher ER, et al. Imprinting disorders: a group of congenital disorders with overlapping patterns of molecular changes affecting imprinted loci. Clin Epigenetics. 2015;7(1).
- Moore GE, Ishida M, Demetriou C, et al. The role and interaction of imprinted genes in human fetal growth. Philos Trans R Soc B Biol Sci. 2015;370(1663):20140074.
- Frost JM, Moore GE, Ferguson-Smith AC. The importance of imprinting in the human placenta. PLoS Genet. 2010;6(7):1–9.
- Constância M, Hemberger M, Hughes J, et al. Placental-specific IGF-II is a major modulator of placental and fetal growth. Nature. 2002;417(6892):945–948.
- Perera F, Herbstman J. Prenatal environmental exposures, epigenetics, and disease Frederica. Bone. 2008;23(1):1–7.
- Susiarjo M, Sasson I, Mesaros C, et al. Bisphenol A exposure disrupts genomic imprinting in the mouse. PLoS Genet. 2013;9(4):e1003401.
- de Pette M V, Abbas A, Feytout A, et al. Visualizing changes in cdkn1c expression links early-life adversity to imprint mis-regulation in adults. Cell Rep. 2017;18(5):1090–1099.
- Baptissart M, Bradish CM, Jones BS, et al. Zac1 and the imprinted gene network program juvenile NAFLD in response to maternal metabolic syndrome. Hepatology. 2022. DOI: 10.1002/hep.32363. n/a(n/a).
- Cowley M, Skaar DA, Jima DD, et al. Effects of cadmium exposure on DNA methylation at imprinting control regions and genome-wide in mothers and newborn children. Environ Health Perspect. 2018;126(3):1–12.
- Stampone E, Caldarelli I, Zullo A, et al. Genetic and epigenetic control of CDKN1C expression : importance in cell commitment and differentiation. 2018; 191: 1–24.
- Andrews SC, Wood MD, Tunster SJ, et al. Cdkn1c (p57 Kip2) is the major regulator of embryonic growth within its imprinted domain on mouse distal chromosome 7. BMC Dev Biol. 2007;7(1):1–14.
- Suntharalingham JP, Ishida M, Buonocore F, et al. Analysis of CDKN1C in fetal growth restriction and pregnancy loss. F1000Res. 2019 version 1; peer review: 2 approved;8:1–16.
- Chang S, Bartolomei MS. Modeling human epigenetic disorders in mice: beckwith-Wiedemann syndrome and silver-Russell syndrome. DMM Dis Model Mech. 2020;13(5):1–12.
- Mohammad F, Mondal T, Guseva N, et al. Kcnq1ot1 noncoding RNA mediates transcriptional gene silencing by interacting with Dnmt1. Development. 2010;137(15):2493–2499.
- Redrup L, Branco MR, Perdeaux ER, et al. The long noncoding RNA Kcnq1ot1 organises a lineage-specific nuclear domain for epigenetic gene silencing. Development. 2009;136(4):525–530.
- Tozzi MG, Moscuzza F, Michelucci A, et al. Nutrition, epigenetic markers and growth in preterm infants. J Matern Neonatal Med. 2019: 1–6.
- Livak KJ, Schmittgen TD. Analysis of relative gene expression data using real-time quantitative PCR and the 2-ΔΔCT method. Methods. 2001;25(4):402–408.
- Bock C, Reither S, Mikeska T, et al. BiQ Analyzer: visualization and quality control for DNA methylation data from bisulfite sequencing. Bioinformatics. 2005;21(21):4067–4068.
- Punshon T, Li Z, Jackson B, et al. Placental metal concentrations in relation to placental growth, efficiency and birth weight. Physiol Behav. 2017;176(1):139–148.
- Hudson KM, Belcher SM, Cowley M. Maternal cadmium exposure in the mouse leads to increased heart weight at birth and programs susceptibility to hypertension in adulthood. Sci Rep. 2019;9(1):1–13.
- Massanyi P, Massanyi M, Madeddu R, et al. Effects of Cadmium, Lead, and Mercury on the Structure and Function of Reproductive Organs Peter. Angew Chemie Int Ed. 2020;6(11):951–952. 1–31
- Shankar K, Zhong Y, Kang P, et al. RNA-seq analysis of the functional compartments within the rat placentation site. Endocrinology. 2012;153(4):1999–2011.
- Fujiwara KT, Kataoka K, Nishizawa M. Two new members of the maf oncogene family, mafK and mafF, encode nuclear b-zip proteins lacking putative trans-activator domain. 1993; 8(9): 2371–80.
- Frank D, Mendelsohn CL, Ciccone E, et al. A novel pleckstrin homology-related gene family defined by lpl/Tssc3, TDAG51, and Tih1: tissue-specific expression, chromosomal location, and parental imprinting. Mamm Genome. 1999;10(12):1150–1159.
- Saxena A, Frank D, Panichkul P, et al. The product of the imprinted gene IPL marks human villous cytotrophoblast and is lost in complete hydatidiform mole. Placenta. 2003;24(8–9):835–842.
- Johnston JE, Valentiner E, Maxson P, et al. Maternal cadmium levels during pregnancy associated with lower birth weight in infants in a North Carolina cohort. PLoS One. 2014;9(10):e109661.
- Luo Y, McCullough LE, Tzeng J-Y, et al. Maternal blood cadmium, lead and arsenic levels, nutrient combinations, and offspring birthweight. BMC Public Health. 2017;17(1):354.
- Green AJ, Hoyo C, Mattingly CJ, et al. Cadmium exposure increases the risk of juvenile obesity: a human and zebrafish comparative study. Int J Obes (Lond). 2018;42(7):1285–1295.
- Jackson TW, Ryherd GL, Scheibly CM, et al. Gestational cd exposure in the CD-1 mouse induces sex-specific hepatic insulin insensitivity, obesity, and metabolic syndrome in adult female offspring. Toxicol Sci. 2020;178(2):264–280.
- López-Abad M, Iglesias-Platas I, Monk D. Epigenetic characterization of CDKN1C in placenta samples from non-syndromic intrauterine growth restriction. Front Genet. 2016;7(APR):1–17.
- Hanna CW, Bartolomei MS. Placental imprinting: emerging mechanisms and functions. PLoS Genet. 2020;16(4):e1008709.
- Diaz-Meyer N, Day, CD, Khatod, K. et al. Silencing of CDKN1C (p57KIP2) is associated with hypomethylation at KvDMR1 in beckwith-wiedemann syndrome. J Med Genet. 2003;40(11):797–801.
- Fitzpatrick GV, Soloway PD, Higgins MJ. Regional loss of imprinting and growth deficiency in mice with a targeted deletion of KvDMR1. Nat Genet. 2002;32(3):426–431.
- Bhogal B, Arnaudo A, Dymkowski A, et al. Methylation at mouse Cdkn1c is acquired during postimplantation development and functions to maintain imprinted expression. Genomics. 2004;84(6):961–970.
- Brooks SA, Fry RC, Holm AA. Cadmium inhibits placental trophoblast cell migration via miRNA regulation of the transforming growth factor beta (TGF-β) pathway. Physiol Behav. 2017;176(3):139–148.
- Furukawa S, Kuroda Y, Sugiyama A. A comparison of the histological structure of the placenta in experimental animals. J Toxicol Pathol. 2014;27(1):11–18.
- Cox B, Kotlyar M, Evangelou AI, et al. Comparative systems biology of human and mouse as a tool to guide the modeling of human placental pathology. Mol Syst Biol. 2009;5(279):1–15.
- Hemberger M, Hanna CW, Dean W. Mechanisms of early placental development in mouse and humans. Nat Rev Genet. 2020;21(1):27–43.