
ABSTRACT
Few recurrent DNA mutations are seen in aggressive canine B cell lymphomas (cBCL), suggesting other frequent drivers. The methylated island recovery assay (MIRA-seq) or methylated CpG-binding domain sequencing (MBD-seq) was used to define the genome-wide methylation profiles in aggressive cBCL in Golden Retrievers to determine if cBCL can be better defined by epigenetic changes than by DNA mutations. DNA hypermethylation patterns were relatively homogenous within cBCL samples in Golden Retrievers, in different breeds and in geographical regions. Aberrant hypermethylation is thus suspected to be a central and early event in cBCL lymphomagenesis. Distinct subgroups within cBCL in Golden Retrievers were not identified with DNA methylation profiles. In comparison, the methylome profile of human DLBCL (hDLBCL) is relatively heterogeneous. Only moderate similarity between hDLBCL and cBCL was seen and cBCL likely cannot be accurately classified into the subtypes seen in hDLBCL. Genes with hypermethylated regions in the promoter-TSS-first exon of cBCL compared to normal B cells often also had additional hyper- and hypomethylated regions distributed throughout the gene suggesting non-randomized repeat targeting of key genes by epigenetic mechanisms. The prevalence of hypermethylation in transcription factor families in aggressive cBCL may represent a fundamental step in lymphomagenesis.
Introduction
Diffuse Large B Cell Lymphoma (DLBCL) is the most common subtype of lymphoma in humans and in dogs, accounting for 21% and 52% of all lymphomas, respectively [Citation1]. DLBCL is the most common subtype of aggressive B-cell lymphoma in dogs. Canine BCL (cBCL) shows remarkable similarities to human DLBCL (hDLBCL); both are treated with and respond to CHOP-like chemotherapy protocols, share a common cytologic and histologic appearance, and share common dysregulated pathways including NF-kB [Citation2–5]. The importance of the canine model for hDLBCL has been proven with the completion of clinical trials in companion dogs that have provided the necessary data to bring drugs into human clinical trials, including a topoisomerase 1 inhibitor (LMP744) [Citation6], an autologous vaccine with heat shock protein peptide complexes with hydroxylapatite [Citation7], and a PI3Kδ inhibitor (RV1001) [Citation8].
Genomic sequencing can define the underlying nucleic acid changes that lead to cellular transformation and the malignant biology of tumours. Understanding these changes can be used to create non-invasive diagnostics and assist in tumour classification for prognostication. Genetic studies have helped define the normal development of B cells and initiation and maintenance of cancer cells in hDLBCL [Citation9]. More recent sequencing studies in hDLBCL and cDLBCL/cBCL have evaluated the methylome. The canine and human methylomes (autosomes) are composed of a similar number of CpGs, ~24 million and ~25 million CpGs [Citation10], respectively. The canine methylome has a greater number of CGIs, ~45 thousand versus ~30 thousand CGIs (UCSC genome browser), but the CGIs are smaller on average than the human methylome (p < 2.2e-16, Wilcoxon rank sum). Epigenetic programming is precisely controlled in normal B-cell development, but aberrant DNA methylation can lead to cancers across different cell types and species [Citation11]. Focal hypermethylation has been utilized for subtyping hDLBCL. Supervised hierarchical clustering of hDLBCL with the HELP (HpaII tiny fragment enrichment by ligation-mediated PCR) promoter microarray showed a 91% predictive accuracy in classification of patients into the activated B cell (ABC) and germinal centre B cell (GCB) subgroups [Citation12]. A similar later study divided hDLBCL into six clusters based on degree and direction of methylation differences to normal germinal centre B-cells [Citation13]. ABC and GCB subtypes were distributed throughout the clusters in this study but showed skewing in their distributions. Human DLBCL subgroups with different prognoses are more clearly separated on the transcriptome and genome but the methylome can also be used to highlight the differences between the subgroups.
Genome-wide DNA methylation in cBCL that have included cDLBCL have been evaluated in only four studies to date [Citation14–17] and only one study, using microarrays, evaluated methylation from lymph node tissue in dogs with cBCL [Citation14]; none of these previous studies used purified B cells as a control. Similarities between cBCL and hDLBCL were seen at the pathway level. Pathways that were commonly hypermethylated in cBCL and hDLBCL included the homeobox and developmental pathways [Citation13,Citation18]. In general, although similarities in dysregulated genes at the genetic and epigenetic level can be shared, the genetic landscape is marked with differences [Citation2,Citation3,Citation19,Citation20]. For example, gene expression profiling (GEP) can separate hDLBCL into three categories, ABC, GCB, and unclassified. This hDLBCL cell of origin (COO) classification scheme has not resulted in consistent separation in cBCL [Citation19,Citation21]. The CD10, BCL6, and MUM1/IRF4 IHC markers that are used in hDLBCL as surrogates for COO GEP also fail to separate cBCL into COO categories [Citation19]. Unlike in hDLBCL, BCL6 does not appear to be commonly expressed [Citation19], and BCL2 and MYC expressions appear to be uniformly high and fail to be prognostic in cBCL [Citation22]. Recently, four prominent genetic subtypes, accounting for ~50% of hDLBCLs, termed MCD (based on the co-occurrence of MYD88L265P and CD79B mutations), BN2 (based on BCL6 fusions and NOTCH2 mutations), N1 (based on NOTCH1 mutations), and EZB (based on EZH2 mutations and BCL2 translocations) were described [Citation23]. Somatic mutations in these genes were not reported in studies of WGS in 6 dogs with cBCL [Citation24], RNA-seq in 62 dogs with cBCL, or WES in 64 Cocker Spaniels and Golden Retrievers with cBCL [Citation2]. A CD79B SNV was found in a targeted sequencing and WES study in 63 dogs with cBCL. Despite the genetic differences, the clinical similarities, such as response to CHOP-based chemotherapy protocols, have shown the value of cBCL as a model for hDLBCL.
Methylated-CpG island recovery assay and next generation sequencing (MIRA-seq) or methylated CpG binding domain sequencing (MBD-seq), is an affinity enrichment-based method to identify highly methylated areas using a whole genome-based approach. MIRA-seq was used in the current study for the advantages that the number of evaluable loci is not limited by space restrictions on a chip and because the procedure exploits the stark differences in areas of high-CpG-density such as CGIs [Citation11] in cancer and normal tissue methylomes and is thus well suited for identifying areas of interest that can be subsequently interrogated with methods that allow base pair resolution of methylation status [Citation25]. MIRA-seq was selected over more commonly used methods in human oncology due to the lower cost and greater CpG coverage of MIRA-seq compared to other comparable methods such as reduced representation bisulphite sequencing (RRBS), familiarity with analysing MIRA-seq data at our institution [Citation26,Citation27], and concordant performance of MIRA-seq compared to other methods [Citation28,Citation29]. The objective of this study was to characterize the genome-wide methylation patterns in aggressive cBCL in Golden Retrievers. The American Golden Retriever breed was selected due to the relatively low genetic variation and the high risk of developing lymphoma, estimated to be an 11.5% lifetime risk [Citation30] and an overall relative risk of 3.12 when compared to mixed breed dogs [Citation31]. The secondary objectives of this study were to determine if the methylome in cBCL is consistent within Golden Retrievers and to identify key epigenetically dysregulated genes by analysis of genic and intergenic regions.
Results
Samples and quality control
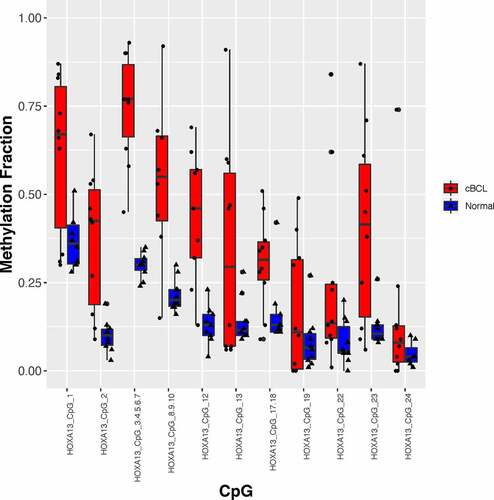
Lymph node aspirates from 23 Golden Retrievers with BCLs were included in the study, Table S1. The control group consisted of immunophenotypically sorted B cells from the blood and lymph nodes from seven dogs with palpably normal lymph nodes and blood smears. Normal B cells were defined as CD21+ cells with low forward and side scatter. MIRA-seq quality control parameters of libraries made from these samples were met and are included in the Supplementary Information and in Table S2. Three hypermethylated differentially methylated regions (DMRs) in cBCL, HOXA13, PITX2, and WT1, were evaluated at a higher resolution, in previously untested cBCL and normal cohorts, with the EpiTYPER, and S1 and Table S3. Methylation fraction was higher at each CpG in the cBCL compared to the normal cohorts, thus validating MIRA-seq results. Methylation profiles between normal T and B cells were compared as well for further validation of the MIRA-seq methods used in this study. Normal T and B cells had distinct methylation signatures that centred around T-cell receptor (TCR) and B-cell receptor (BCR) signalling (see detailed discussion in the Supplementary Information, Tables S4-6 and Figure S2).
Figure 1. Validation of the hypermethylated regions identified with MIRA-seq in cBCL was done with the EpiTYPER. Methylation fraction as determined by the EpiTYPER in the evaluable CpGs in the differentially methylated regions are shown for HOXA13. The black dots and triangles represent EpiTYPER data for cBCL and normal lymph node aspirate samples respectively. The bar plots represent the interquartile range and the horizontal line in the bar plots represent the median. The normal population included 10 dogs that did not develop lymphoma within a 1-year period.
More hypermethylated than hypomethylated DMRs were identified by MIRA-seq in cBCL
Normal B cells from peripheral blood and lymph node (n = 7) were compared to cBCL (n = 23) for differential methylation, Table S1. 13,982 hypermethylated and 4467 hypomethylated DMRs were identified in cBCL compared to normal B cells, Table S7 and S8. Considering only those in genes with an Ensembl gene ID, this corresponds to 8468 hypermethylated and 2127 hypomethylated genic DMRs. These DMRs represent 4271 hypermethylated and 1218 hypomethylated unique protein-coding genes (Ensembl gene symbols), 601 and 230 lincRNAs, 22 and 1 miRNAs, 15 and 7 pseudogenes, 1 and 0 snRNA, 2 and 0 miscRNA, 14 cfa-miR, and 1 (miRNA), respectively. In a previous canine microarray study in cDLBCL, 1011 hypermethylated and 183 hypomethylated DMRs were found [Citation14].
Differentially methylated regions (DMRs) in cBCL were preferentially located in CGIs and the first exon
The mean and median size of the DMRs were 424 bp and 298 bp (range 98–5398 bp) for those hypermethylated and 275 bp and 198 bp (range 98–2898 bp) for those hypomethylated, Figure S3. The hypermethylated and hypomethylated DMRs were enriched in the 5ʹUTR, promoter-TSS, exon, 3ʹUTR and transcription termination site (TTS) and were not enriched in the intron and intergenic space, Tables S9a and S9b. The hypermethylated cBCL DMRs were distributed most frequently around the TSS, Figure S4, more specifically 217 bp (median) downstream of the TSS. The median, mean and range for the length of the first exon (all canine genes from Ensembl) in Canis familiaris is 174 bp, 311 bp, 0–8007 bp. The hypermethylated DMRs were thus commonly located in the first exon and intron. This pattern follows the distribution of CGIs in the canine genome, Figure S4. Of the hypermethylated cBCL DMRs, 48.9% of the DMRs were in a CGI, 20.7% were in the CGI shores (within 2000 bp of the CGI) and 30.3% were in the CGI shelves and the open sea, Figure S5. In comparison, CGIs and shores represent only 1.69% and 8.27%, respectively, of the genomic space. DNA methylation in CGI shores can be strongly associated with gene expression, and can be highly conserved across species and tissue types, likely due to regulatory elements that are located in these regions [Citation32]. Distribution of the hypomethylated DMRs is described in the Supplementary Information and Figures S4 and S5.
cBCL has a distinct methylation signature from normal B cells
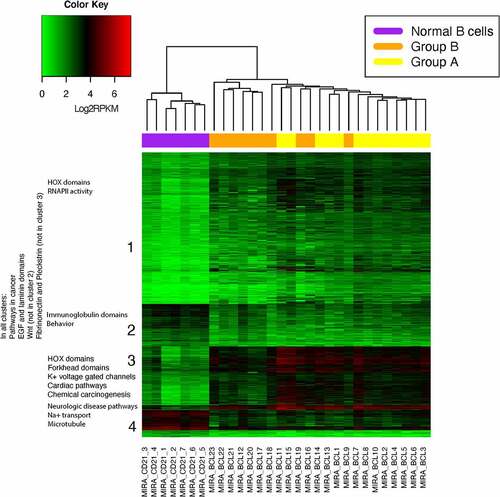
All of the normal B-cell samples separated from the cBCL samples with hierarchical clustering of the hypermethylated and hypomethylated DMRs, , and with a random forest model with all of the hypermethylated and hypomethylated DMRs, Figures S6-8. The cBCL samples separated into two branches in the hierarchical clustering of the hypermethylated and hypomethylated cBCL DMRs, . The mean Euclidean distance and Spearman correlation between the samples are included in Table S10a and b. The frequency for each branch was 26% and 74%. The two branches are likely due to a batch effect, since all of the libraries in the first branch were produced and sequenced at a later date and with a different DNA polymerase (Group B) compared to most of those in the second branch. Samples MIRA_BCL9, MIRA_BCL16, MIRA_BCL18, and MIRA_BCL19 were sequenced with the samples from the first branch, Group B, but clustered in the second branch, with all of the libraries that were produced and sequenced at an earlier date (Group A); see Supplementary Information for a detailed discussion and . Comparison of the MEDIPS QC metrics between Groups A and B, yielded significant differences in non-specific read pull-down p = 0.007 (% of reads that do not contain CG) and depth of CG coverage (% CG’s with >5x coverage) p = 0.018, Table S11. The libraries in Group B had more contaminating non-CG reads, a lower depth of CG coverage and the DMRs were less methylated than Group A. This could be due to technical variability in producing or sequencing the libraries or to real differences in the methylomes of the Group A and B samples. Batch correction of the cBCL data with Combat-seq was unable to completely correct the batch effect, and S9 [Citation33]. This is likely because Combat-seq was optimized for RNA-seq data, which typically has higher magnitudes of variations in read counts than MBD-seq. The batch corrected data were interpreted with caution since batch correction has been shown to introduce error in methylation datasets (e.g., microarray), and Combat-seq has not previously been applied to MBD-seq data [Citation34]. The difference in methylation between cBCL subgroups in Golden Retrievers is likely small and the batch effect seen in this study was larger than the difference in methylation between cBCL subgroups (if subgroups are present). All of the normal T and B cells were sequenced with the polymerase used in the group B samples and thus were not affected by the batch effect.
Figure 2. Batch corrected log2 transformed hypermethylated and hypomethylated rpkm data. The cBCL samples separated into 2 branches. These branches likely reflect a technical batch effect and not a biological difference. Samples MIRA_BCL9, MIRA_BCL16, MIRA_BCL18 and MIRA_BCL19 were sequenced with the first branch but clustered in the second branch and with all of the libraries that were produced and sequenced at an earlier date (Group A). DMRs were identified from the MIRA-seq of 23 cBCL and 7 normal B cell samples. The heatmap shows unsupervised hierarchical clustering of the 13,982 hypermethylated and 4467 hypomethylated DMRs in cBCL with a fold change value equal to or greater than 2. DMRs were identified with a q < 0.001 (Benjamin-Hochberg correction). Log2 of 1+ RPKM transformation of the values of each DMR was used for visualization purposes.
Pathways that were overrepresented in both the hypermethylome and hypomethylome included neurologic and PI3K-AKT pathways
KEGG pathways that were hypermethylated in cBCL compared to normal B-cells included neurologic and cardiac pathways and the PI3K-Akt and Wnt/Hippo signalling pathways, Table 12a. GO terms that were hypermethylated included neurologic, cardiac, and Wnt pathways, Table S12b. Hypermethylation occurred in genes with homeobox, tyrosine kinase (e.g., EGF), Wnt, G-protein coupled receptor, immunoglobulin, voltage-gated calcium channels, T-box transcription factor, and neurotransmitter-gated ion channel protein domains, Table 12c. The KEGG pathway that was also hypomethylated was the PI3K-Akt signalling pathway, Table S13a. GO terms that were also hypomethylated included neurologic pathways, more specifically pathways involved with microtubules (e.g., semaphorin, plexin, neuropilin, kinesin genes) and neurotransmitter activity, Table S13b. The specific neurologic GO terms that were enriched in the hypermethylated genes were different than for the hypomethylated genes. Hypomethylated protein domains in common with the hypermethylated gene list included tyrosine kinase (e.g., EGF), G-protein coupled receptor, immunoglobulin, plexin, semaphorin but also uniquely include tyrosine phosphatase, ephrin, FERM (4.1 protein, ezrin, radixin, and moesin), and cadherin domains, Table S13c. Many of the overrepresented pathways and protein domains were common to both hypermethylated and hypomethylated data sets and were also found when both hypermethylated and hypomethylated data sets were combined and analysed, Tables S12-14.
The HOX, TBX, NKX, FOX, and ONECUT transcription factor families and the Wnt pathway were overrepresented in the cBCL hypermethylome
The homeobox transcription factor families, HOX, NKX, and ONECUT, and TBX transcription factor families, and the homeobox domains were notably absent in the hypomethylated genes in cBCL compared to normal B-cells while 76.5% (26/34), 66.7% (10/15), 92.3% (12/13), and 100% (3/3) of the known Ensembl HOX, TBX, NKX, and ONECUT genes, respectively, in the dog were hypermethylated, and S10 and Table S15. Of the 32 canine FOX genes, 22 were hypermethylated and only one was hypomethylated. Seventy-eight per cent (15/19) of the known canine WNT genes had hypermethylated DMRs and only 15.8% (3/19) had a hypomethylated DMR. The negative regulators of the canonical Wnt pathway, the secreted frizzled-related proteins (SFRPs), dickkopf proteins (DKKs) and WIFI were also hypermethylated and none were hypomethylated. Likely multiple aspects of the Wnt pathway are dysregulated via differential methylation in cBCL. Promoter DNA hypermethylation in these transcription factor families, as also seen in human cancers, support a stem cell origin of cancer [Citation35,Citation36].
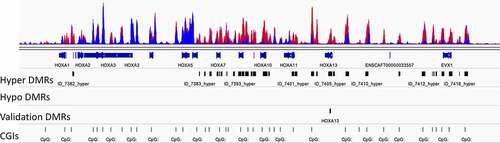
Figure 3. Focal areas of hypermethylation were distributed throughout the HOX clusters. The HOXA cluster on chromosome 14 is shown. The top track has the methylation profiles of 23 cBCL (red) and 7 normal B cell (blue) samples overlain. There were clusters of hypermethylated differentially methylated regions (DMRs) in the HOXA cluster. There were no hypomethylated DMRs in this region. A hypermethylated region in HOXA13 was selected for validation. CpG islands are shown in the bottom track.
A methylation signature of genes hypermethylated in cBCL is stable and conserved between dog breeds and geography
Upon intersection (with Bedtools) of the DMR locations in this study compared to the locations of the DMRs identified in the cDLBCL microarray study performed in an Italian population of dogs of various breeds diagnosed with cDLBCL, 94.3% (953/1011) of the hypermethylated, and 23.5% (43/183) of the hypomethylated DMRs were common [Citation14]. The most recent study from Hsu et al. could not be compared since a complete list of hypermethylated genes was not provided and the data was not found in the provided GEO accession.
A 10 DMR signature was able to distinguish normal B cells from cBCL confirming the reliability of DNA methylation to differentiate normal B cells from cBCL
The top 10 DMRs (10 hypermethylated DMRs) identified by a random forest model were used for a MDS plot and AUC curve, Figures S6-7 and Table S16. These 10 DMRs were located in the intergenic (5), intronic (2), 3ʹUTR (1), TTS (1) and exonic (1) regions. The mean decrease in Gini coefficient and mean decrease accuracy values were similar, and the variable importance curve was steep, Figure S8 and Table S16, indicating similar performance of DMRs, likely in the top few hundred, in a classifier. This 10-DMR classifier can be improved upon and tested on a new validation cohort of Golden Retrievers with cBCL to best evaluate the model. Pathway analysis was done on the top 100 DMRs (41 intergenic DMRs were not used in the analysis) and showed enrichment in the glucose homoeostasis and RNA polymerase II transcription factor activity GO processes, PI3K-Akt signalling pathway, and HOX domains, Table S17. Genes in the glucose homoeostasis pathway included IGF1R, CRTC2, SIDT2, and TCF7L2. Genes in the RNA polymerase II transcription factor activity pathways included homeobox genes (NKX2-4, POU4F3, MSX1, and OTX1), ATOH1, MYF6, NEUROG3, TCF7L2, TCF7, and ZMIZ1.
The hypermethylome of cBCL shared characteristics with different types of aggressive human lymphomas
Comparing hypermethylated genes to those found in studies of hDLBCL, 37% were similar to those found in a hDLBCL (all subgroups) [Citation13], and 60% were similar to those found an aggressive hBCL study [Citation18], Figure S11, Table S18, and S19. In Chambwe’s microarray study of hDLBCL, the 140 hDLBCLs were divided into 6 subgroups based on increasing magnitude of differences in methylation compared to normal germinal centre B cells controls. In that study, a higher difference in methylation compared to normal was associated with decreased survival and the clusters with lower methylation differences had a higher frequency of GCB hDLBCLs. The genes with hypermethylated promoters in common with our study and in all hDLBCL’s in the Chambwe study included CH25H, GRIN3A, GSC, MSX1, NEFM, NID1, PDE3A, PTHLH, PUS3, RASGRF2, SIX6, SP9, ZIC5, and ZNF462 [Citation13]. RASGRF2 has also been reported to be hypermethylated in other cBCL studies [Citation17,Citation37]. The protocadherin family contains 15 members in the dog and 6 and 3 of the PCDH genes were hypermethylated in cBCL compared to normal lymphocytes in the current study and in a previous cDLBCL microarray study, respectively, and none were hypomethylated [Citation14]. PCDH1, PCDH7, PCDH10, PCDH12, PCDH17 and PCDH20 were hypermethylated in cBCL in our study and have been reported to be hypermethylated in specific clusters of hDLBCL. Hypermethylation of PCDH17 also has been identified in human urological cancers [Citation38,Citation39], oesophageal cancer [Citation40], colorectal carcinoma [Citation41], and acute lymphoblastic leukaemia [Citation42] and has been associated with a poor prognosis. PCDH10 is a frequent and early methylation target in many cancers including hDLBCL [Citation43,Citation44]. Hypermethylation frequently leads to decreased gene expression of these PCDHs but the functional role of PCDHs in carcinogenesis is unknown. The methylation profile of cBCL in our study did not clearly align with a particular methylation cluster in hDLBCL identified in Chambwe’s study but based on the overlap of specific hypermethylated genes, was most similar to the hDLBCL clusters with higher levels of methylation and worse prognosis [Citation13], Table S18. Comparing enriched pathways, the cBCLs in our study most clearly aligned with a mid-methylation cluster (cluster C), which was characterized by hypermethylation of many important developmental genes, particularly homeobox and forkhead box family genes. Comparing these two hBCL studies to each other, only moderate similarity exists between hypermethylation profiles, suggesting that hBCL is a more heterogeneous disease than cBCL. The decreased epigenetic heterogeneity seen in cBCL may be due to decreased heterogeneity in the disease of cBCL compared to hBCL in general. In a study comparing the incidence of different types of lymphomas in dogs and humans, of the non-Hodgkin B cell lymphomas (excluding cases classified as ‘other’), 73% and 37% of cases were classified as DLBCL, respectively [Citation1]. Genes that were recurrently hypermethylated in multiple studies in cBCL and hDLBCL included FGF5 [Citation16], PITX2, TJP1, WNT2, and NEFL [Citation13,Citation14], Table S18. All of these genes except TJP1 were also hypermethylated in the human pan-cancer study [Citation45] and therefore are likely not specific to a cancer type or species. Previous GEP, exome, and methylation studies in cBCL have failed to stratify cBCL into similar subtypes as hDLBCL and thus our study lends support to the hypothesis that cBCL shares features that are characteristic of the different subtypes of hDLBCL but does not clearly align with a particular subtype.
There was little overlap of the hypomethylome of cBCL with aggressive human lymphomas
We compared hypomethylated genes in our study to hypomethylated genes in a hDLBCL study and an aggressive hBCL study and 14% [Citation13] and 0% [Citation18] of the genes in the human studies were found in our study, Figure S12, Table S19. Sixty-seven per cent of these hypomethylated genes that were in common with our study were also hypermethylated in our study. None of these DMRs were in the promoter region and were located in introns, intergenic, and 3’-UTR regions.
Discussion
Using a genome-wide methylation sequencing approach, the methylation profile of cBCL in Golden Retrievers showed a conserved hypermethylome. Further, there was almost complete overlap of hypermethylated genes with an Italian microarray study of different dog breeds, where only 9.3% of the dogs were Golden Retrievers; in the current North American study all of the dogs were Golden Retrievers [Citation37]. The Italian study also only included dogs diagnosed with DLBCL with histopathology and this current study included Golden Retrievers with BCLs including DLBCL and possibly other clinically aggressive subtypes. We conclude in this study that the hypermethylome in clinically aggressive cBCL is conserved in Golden Retrievers in the United States, but also propose that conservation is seen across breeds, geographical region, and aggressive cBCL subtypes. These results suggest that, despite suspected genetic differences between Golden Retrievers in the American and European lines [Citation46,Citation47,Citation48], aggressive cBCL is a relatively epigenetically homogenous disease. Confirmation of this finding would include future studies that include hierarchical clustering of cBCL from different breeds and countries with data that were generated and processed with similar methods. Expansion of this study to also include T-cell lymphomas (e.g., aggressive peripheral T cell lymphoma and T-zone lymphomas) would explore the hypothesis that the methylome of aggressive cBCL is distinct from other subtypes of canine lymphoma.
This study also describes the hypomethylome but our conclusions are mainly focused on the hypermethylome since the MIRA-seq method is more reliable for distinguishing hypermethylated than hypomethylated regions in cancer compared to normal. Hypomethylated DMRs were less conserved than hypermethylated DMRs across cBCL and hBCL studies and may have a less significant functional consequence in general. In cancers, hypomethylation tends to be global and can affect extensive blocks resulting in chromatin reorganization [Citation49] and chromosomal stability [Citation50] while hypermethylation tends to be more targeted, affecting specific genes. Hypomethylated DMRs have been shown to be more heterogeneous than hypermethylated DMRs in the same patient [Citation51] and thus are likely to be more dynamic across time, breed, region, and lymphoma subtype. The mean fold change of the RPKM values of the hypermethylated and hypomethylated DMRs were 6.92 (range 2.00–324.11) and 2.52 (range 2.00–69.43), respectively (Wilcoxon rank sum test, p < 2.2 e^-16). The lower fold change of hypomethylated DMRs compared to hypermethylated DMRs could contribute to the dynamic nature of the hypomethylome or alternatively would have required more power to find a statistical difference and would have been more subject to variability (e.g., technical, patient, environment, etc.).
A strength of this study is that hypermethylated and hypomethylated DMRs were queried throughout the genome and not restricted to pre-determined loci. The MIRA-seq method identified more DMRs than previous cBCL studies and provided the most comprehensive methylome of cBCL in Golden Retrievers compared to previous studies in cBCL. MIRA-seq has been previously shown to be more sensitive than other methods such as MeDIP-seq and reduced representation bisulphite sequencing (RRBS) microarrays [Citation52]. MIRA-seq is also more specific for the 5-methyl cytosine (5-mC) base modification compared to bisulphite-based techniques that cannot distinguish alternative DNA modifications such as 5-hydroxymethylation of cytosine [Citation53]. DMRs outside of the promoter have also been associated with functional consequences; for example, internal promoter, splice site, and TTS methylation has been linked to isoform switching [Citation54,Citation55]. In a study using the TCGA dataset, it was estimated that isoform switching caused by differential DNA methylation affected 10–21% of genes [Citation54]. Methylation around the TSS was correlated with decreased isoform usage while methylation in the 4th or further downstream exon bodies increased isoform usage by promoting elongation. It is expected similarly in cBCL that there is a functional consequence to the highly recurrent DMRs. We can speculate that these methylation differences contribute to favouring of alternative transcripts.
The HOX, FOX, ONECUT, TBX, WNT, and NKX genes were recurrently hypermethylated in cBCL [Citation14,Citation15,Citation16,Citation17] and may be candidate biomarkers for early disease detection in cBCL. The HOX, FOX, ONECUT, TBX, and NKX transcription factors are required for differentiation and are reversibly repressed by PRC2, a histone methyltransferase that can cause gene silencing, in human embryonic stem cells [Citation56]. In comparison, cancer cells are more likely to have promoter DNA hypermethylation in these transcription factor families than non-PRC2 targets, supporting a stem cell origin of cancer [Citation57,Citation58]. As a result, the HOX, FOX, ONECUT, TBX, WNT, and NKX genes are commonly hypermethylated across human solid cancers and are candidates for a pan-cancer methylation signature [Citation35, Citation36, Citation45, Citation59,Citation60,Citation61,Citation62,Citation63,Citation64]. As far as the author is aware, the HOX, FOX, TBX, WNT, and NKX genes have been found to be hypermethylated in only subsets of hDLBCLs. HOX and FOX hypermethylation was characteristic in a particular hDLBCL cluster and was seen in the clusters with the highest magnitude of methylation changes compared to normal germinal centre B cells [Citation13]. TBX, NKX, and WNT hypermethylation was also seen in subsets of hDLBCLs with the highest magnitude of methylation changes compared to normal germinal centre B cells but were not characteristic for a particular cluster [Citation13]. ONECUT hypermethylation was not found in any hDLBCL cluster [Citation13]. HOX, FOX, ONECUT, TBX, WNT, and NKX genes were not differentially methylated when all of the hDLBCL samples were compared to normal in this hDLBCL study [Citation13] and thus these genes have not previously been implicated as a key pathway in hDLBCL. With the exception of the HOX genes, these pathways have also not been previously implicated in cBCL. Consequential mutations in the ONECUT, NKX, TBX, WNT, and HOX genes were rare in a whole genome and RNA-seq study of hDLBCL, instead, epigenetic dysregulation may be a prevalent feature in lymphoma [Citation65].
The HOX genes are transcription factors that are responsible for specifying body position in the developing embryo and are also critical for growth and differentiation. The HOX genes have been recurrently implicated in cancer, most commonly as an oncogene, but also as a TSG [Citation66]. As a TSG, the HOX genes have been implicated in breast and lung carcinomas [Citation67]. In acute leukaemias, the HOX genes have been commonly implicated as an oncogene [Citation66] but also less frequently as a TSG [Citation68]. Widespread hypermethylation in the HOX gene clusters are a common finding in human pancreatic and lung carcinomas [Citation60,Citation67] and has been seen in canine acute leukaemias (data not yet published), human acute lymphoblastic leukaemias (data not yet published), B cell lymphomas such as human follicular [Citation69] and mantle cell lymphoma [Citation70] and canine melanoma [Citation71]. Potential mechanisms for the HOX gene hypermethylation seen in this study may be the overexpression of histone methyltransferases EZH2 (H3K27me3) and SETDB1 (H3K9me2/3) or DNMT3A mutation [Citation72]. EZH2 and SETDB1 can interact with DNA methyltransferases to cause hypermethylation. This mechanism has been shown in hDLBCL [Citation73] and hAML [Citation74] and EZH2 overexpression has been shown in cBCL [Citation75]. HOX gene hypermethylation in cBCL may just be an inconsequential product of aberrant hyperactivity of histone methyltranferases, association with other epigenetic features (e.g., CpG density, open chromatin, bivalent domains) [Citation76] or may have biologically significant roles, such as regulation of downstream enhancers [Citation60], activation of naïve stem cell resetting programmes or a more permanent arrest of differentiation programmes [Citation77]. ChIP-seq, transcriptomic, and mutational profiles in cBCL are needed to understand this prevalent finding in aggressive cBCL.
Limitations
The methylation status of particular CpGs cannot be evaluated with MIRA-seq and thus methylation at the base pair level of resolution was not determined in this study. Further resolution can be evaluated with methods such as the EpiTYPER, which was done for selected DMRs in this study. Histology was only done on two patients and the subtype of cBCL could not be confirmed in all cases. The flow cytometry profile inclusion criteria used in this study has been consistent with histologically diagnosed cDLBCL in previous studies [Citation22,Citation78], but this phenotype has not been directly compared to different types of cBCL. This profile also most consistently correlates with histologically diagnosed cDLBCL at the Clinical Immunology Lab at Colorado State University [Citation79]. Since cDLBCL is the most common WHO histologic diagnosis in dogs with high-grade B-cell lymphomas, 93–96%, the dogs included in this study were most likely to have cDLBCL [Citation79,Citation80,Citation81,Citation82]. It is possible that subtypes would have become more evident with increased sample numbers. Restricting the background genomic variability to Golden Retrievers living in the United States was used to overcome sample size limitations in the present study. The methylation profiles could not be correlated with clinical outcome since the patients were not treated with the same drug protocol. Approximately 16–32.7% of patients with aggressive lymphoma (mostly B cell) do not obtain a complete remission with a CHOP-based chemotherapy protocol [Citation83,Citation84,Citation85,Citation86,Citation87]. There is currently no test that can reliably identify these patients. Clinical correlations can answer the question of whether the methylome can identify these patients and if so are there epigenetic mechanisms that can explain chemoresistance. RNA was not specifically collected from most of the patients, and thus gene expression cannot be directly correlated with methylation profiles. High methylation cannot be definitively attributed to hypermethylation since amplifications cause a similar methylation profile. Future experiments should also include whole genome, exome, and RNA sequencing for a complete illustration of the genomic landscape.
Conclusions
Promoter hypermethylation was a prevalent and conserved feature in cBCL in Golden Retrievers. The epigenetic signature of cBCL in Golden Retrievers appeared to be similar to that identified in cDLBCL in different breeds in different countries. Support for subgroups in cBCL was not found in the methylation data. The methylome of cBCL was more homogenous than hDLBCL. The hypermethylome of cBCL did not share many similarities with hDLBCL as a whole but shared modest similarity with methylation subgroups within hDLBCL. Genes with hypermethylated DMRs in the promoter-TSS-first exon often also had multiple hyper and hypomethylated DMRs distributed throughout the gene suggesting multiple layers of epimutations. The prevalence of hypermethylation in transcription factor families in cBCL may represent a fundamental step in oncogenesis. Many of the genes that were hypermethylated in cBCL were also hypermethylated in many other human cancers. A pan-cancer hypermethylation signature that is able to detect a myriad of canine cancers likely exists.
Materials and methods
Patients
Samples were submitted to the Clinical Immunology Laboratory at Colorado State University Veterinary Teaching Hospital (CO), University of Missouri Veterinary Health Center (MO), and Texas A&M (TX). All dogs with lymphoma that were included in the study were client-owned dogs described by their owners as Golden Retrievers. Collection of samples at the University of Missouri was approved by the ACUC under protocol #9726. Samples contributed by the Clinical Immunology Laboratory at Colorado State University were from samples that remained after flow cytometry analysis. All dogs with lymphoma had diffuse peripheral lymphadenopathy and a predicted aggressive clinical course. All dogs had a flow cytometry profile consistent with cBCL, including a CD21+ lymphocytosis of intermediate to large lymphocytes and variable MHCII expression. Full staging diagnostics with abdominal ultrasound, thoracic radiographs, and bone marrow aspirate were not performed on all dogs. Lymph node samples were either biopsy or fine needle aspirate samples that were collected as part of the patient’s diagnostic plan. Dogs were excluded if they were ever treated with chemotherapy for lymphoma prior to sample collection.
The MIRA-seq lymphoma affected group included lymph node samples from 23 Golden Retrievers with BCL (fine needle aspirates). The MIRA-seq normal control dogs included CD21+ cells from 7 dogs (5 from lymph nodes and 2 from blood), CD4 + T cells from 4 dogs (all from lymph nodes), CD8 + T cells from 3 dogs (all from lymph node) and CD5+ cells from 2 dogs (all from blood). Normal lymph nodes were collected from healthy dogs undergoing terminal procedures for continuing education courses or from euthanized client owned dogs. The lymph nodes were dissociated, and single-cell suspensions were incubated with antibodies specific for canine CD5 (clone YKIX322.3, APC conjugated), canine CD21 (clone CA2.1D6, PE conjugated), canine CD4 (clone YKIX302.9, Pacific blue conjugated), and canine CD8 (clone YCATE55.9, FITC conjugated). Genetic variability from contamination with other cell types (e.g., T cells, other white blood cells, and connective tissue cells) was minimized by purifying lymphocyte subsets from normal control dogs by cell sorting. A clinical summary of the dogs included in the study can be found in Table S1.
Flow cytometry and cell sorting
Immunophenotyping by flow cytometry was performed on all lymphoma samples as previously described [Citation79], Table S20. A diagnosis of cBCL was established as previously described [Citation79]; in brief dogs with a CD21 lymphocytosis and forward scatter of >469 were included. CD4+, CD8+, and CD21+ populations, from normal lymph node suspensions and PBMCs, were purified using a MoFlo cell sorter (Beckman Coulter) with four-way sort capability. Purity of all populations was assessed by re-analysis after sorting and was greater than 90%.
PBMC processing for normal dogs
All normal dogs had a CBC with blood smear evaluation by a board-certified clinical pathologist to confirm the absence of atypical lymphocytes or a lymphocytosis at the time of blood PBMC collection. Blood samples were collected in mononuclear cell preparation (CPT) sodium citrate tubes (#362761, BD Biosciences) and processed according to the manufacturer’s protocol to isolate PBMCs.
Magnetic column based manual cell separation for normal dogs
If flow sorting was unavailable, the Miltenyi MACS system was used for separation of B and T cells from canine PBMCs. The manufacturer’s protocol was followed. Specifically, cells were run through a pre-separation filter (#130-041-407, Miltenyi), washed in PBS with 1% BSA, incubated with 1/100 dilution of mouse anti-canine CD21 (#MCA1781 R, Bio-Rad), washed with PBS with 1% BSA, incubated with goat anti-mouse IgG microbeads (130–048-402, Miltenyi), washed with MACS buffer (1:20 dilution of 130–091-376 with #130-091-222, Miltenyi), eluted in MS column (#130-041-201, Miltenyi).
DNA library preparation and sequencing
Genomic DNA was extracted with the DNeasy blood and tissue kit (Qiagen Sciences, Germantown, MD, USA). Spectrophotometric and fluorometric DNA quantification was done with the NanoDrop and Qubit platforms, respectively (NanoDrop products, Wilmington, DE, USA, and Life Technologies, Grand Island, NY, USA). One ug of genomic DNA was sonicated with the Covaris M220 focused ultrasonicator to ~350 bp fragments (Covaris Inc, Woburn, MA, USA). Clean-up was accomplished with 1.6x AMPure XP beads (Beckman Coulter Inc, Brea, CA, USA). Library preparation was performed with the NEBNext Ultra DNA Library Prep Kit for Illumina (#E7370, New England BioLabs Inc, Ipswich, MA, USA). The MethylCollector Ultra kit was used for the MIRA (#55005, Active Motif, Carlsbad, CA, USA). PCR enrichment and indexing was done with the NEBNext Multiplex Oligos for Illumina kit (#E7335, New England BioLabs Inc, Ipswich, MA, USA). PCR was performed on the C1000 Thermal Cycler (Bio-Rad, Hercules, CA, USA) with the following conditions, 98°C for 30s, 11 cycles of 98°C for 10s, 65°C for 30s, 72°C for 30s and a final extension of 72°C for 5 minutes. The conditions were revised to 98°C for 30s, 4 cycles of 98°C for 10s, 65°C for 75s, and a final extension of 72°C for 5 minutes, when the PCR buffer was changed to the Q5 Hot Start HF PCR Master Mix. Libraries were cleaned twice with 1x Agencourt AMPure XP beads (A63881, Beckman Coulter, Indianapolis, IN, USA). Qubit quantification and fragment analysis was done on the resulting library (Advanced Analytical Technologies, Ames, IA, USA). DNA libraries were pooled to 3–4 samples per lane on the HiSeq 2500 sequencer and sequenced as 100 bp single-end reads (Illumina, San Diego, CA, USA).
Quality editing and control
Reads were trimmed 15 bp at the 5ʹ end and filtered for quality (>30% N calls or >10% of the sequence with Phred quality < 20 were omitted) using Cutadapt v1.6 [Citation88]. Trimmomatic v0.32 was used to further select high quality reads [Citation89]. Reads were dropped if the read length <20. Reads were trimmed if the average quality per base < 20 (4-base sliding window). The ends of the reads were trimmed if the quality of the base was <10. Base quality was measured with the simplified log-likelihood approach. FastQC v0.11.2 was used to obtain summary QC statistics for the remaining reads.
Alignment
Remaining reads were then aligned to the Canis familiaris reference CanFam3.1 with BWA-MEM v0.7.10 with default parameters [Citation90].
MEDIPS Analysis of MIRA-seq data
Data was analysed with the Bioconductor MEDIPS package, v1.34.0 [Citation91]. The following parameters were specified: unique reads, reads were extended 300 nucleotides, and each chromosome was divided into 100 nucleotide fragments for binning purposes. Only the autosomes were analysed. Differential methylation was evaluated with the following parameters, Benjamini-Hochberg correction method, q-value of 0.001, EdgeR, ≥10 reads per 100 bp window. DMRs were annotated to Ensembl canfam3.1 version 96 (last modified on 3/13/19, 2:04:00 PM) with HOMER v4.8. Mitochondrial, scaffold, and sex chromosomal DNA were excluded. The promoter was defined as 1000 bp upstream and 100 bp downstream of the TSS (default in HOMER). DMRs were also manually annotated as in a promoter by two additional methods. Firstly, if the start or end of the DMR was within 500 bp upstream or 200 bp downstream of the TSS, the DMR was labelled as belonging to the promoter-TSS region. Secondly, if the DMR was in the region outlined with previous CAGE studies (Cap Analysis of Gene Expression) [Citation92,Citation93], the DMR was labelled as belonging to the promoter-TSS region. The Eukaryotic Promoter Database (EPD) has 7545 experimentally validated promoters, Cf_EPDnew_001 [Citation94]. This database represents the CAGE data that was further analysed (Ensembl version 92) and verified to only contain promoters that are associated with protein coding genes, on full chromosomes and annotated in UCSC with known transcripts. Differential methylation was evaluated in two separate analysis, 1) normal B cells were compared to normal T cells to identify DMRs and 2) normal B cells were compared to cBCL to identify DMRs. Batch correction was done with Combat-seq, sva version 3.38.0, with default parameters [Citation33].
Pathway analysis
Pathway analysis was done with open access software, David v6.8 and ConsensusPathDB v34 with default settings. Overrepresentation analysis based on the hypergeometric test was done with pathway-based sets in ConsensusPathDB with the following parameters (minimum overlap with input list = 2, p < 0.01).
Classifier analysis
To assess the predictive utility of DMRs and identify key predictors, a random forest classifier was constructed using hypermethylated and hypomethylated DMR rpkm values as input and tumour status (normal vs cBCL) as the target with the R randomForest package v4.6.14 [Citation95]. The model was constructed with 100,001 trees and default parameters otherwise. Variable importance was calculated as the Mean Decrease Gini value. Performance was estimated using the built in internal out-of-bag error method and reported as sensitivity, specificity, and overall accuracy from the confusion matrix. Data were visualized with ggplot, varImpPlot, and MDSplot.
DMR Data visualization
Heatmaps were done with gplots in R. Hierarchical clustering was done with the Euclidian average method. The log2 of the reads per kilobase per million mapped reads (RPKM) values were used.
Validation of DNA methylation with the EpiTYPER
Primers for regions in the HOXA13, PITX2, and WT1 genes, Table S21, were designed using the Agena Biosciences EpiDesigner online tool (www.epidesigner.com). DNA was bisulphite converted in duplicate with the EZ DNA Methylation kit (Zymo Research) and pooled prior to methylation analysis. The EZ DNA Methylation kit protocol was followed with the following modifications, an alternative cycling protocol of [Citation1] 95°C for 30s [Citation2], 50°C for 15 min [Citation3], 20 cycles of [Citation1] and [Citation2]. PCR reactions were performed in triplicate with the pooled bisulphite converted DNA with the following mixture for each 5 ul reaction, 2ul of template, 1x buffer (Agena Biosciences), 10 ng dNTP, 0.4 µM primer mix, and 0.2 unit DNA polymerase (Agena Biosciences). The SAP and MassCLEAVE reactions were done according to the manufacturer’s protocol. Methylation percentages were calculated based on the ratio of the unmethylated versus methylated peaks. A low and high methylation control were used for each primer. The low methylation control was produced from a histologically confirmed normal lymph node from a dog without cancer with two cycles of whole-genome amplification with the REPLI-g kit (Qiagen). The high methylation control was produced from a histologically confirmed normal lymph node from a dog without cancer and was purchased from EpigenDx.
Abbreviations
| ABC: activated B cells | = | |
| cBCL: canine aggressive B-cell lymphoma | = | |
| cDLBCL: canine diffuse large B-cell lymphoma | = | |
| CGI: CpG island | = | |
| CpG: cytosine-phospho-guanosine dinucleotide | = | |
| DMR: differentially methylated region | = | |
| GCB: germinal center B cells | = | |
| GEP: gene expression profiling | = | |
| GR: Golden Retriever | = | |
| hDLBCL: human diffuse large B-cell lymphoma | = | |
| hBCL: human aggressive B-cell lymphoma | = | |
| NHL: non-Hodgkin lymphoma | = | |
| PBMC: peripheral blood mononuclear cells | = | |
| TSS: transcription stop site | = | |
| TTS: transcription termination site | = | |
| UTR: untranslated region | = |
Data availability
Data was deposited into SRA under accession PRJNA808112.
Supplemental Material
Download Zip (5 MB)Acknowledgments
The authors would like to acknowledge Hans Rindt, Senthil Kumar, and Maren Fleer at the University of Missouri for technical assistance. The authors would like to acknowledge Obi L Griffith for bioinformatics assistance.
Disclosure statement
No potential conflict of interest was reported by the author(s).
Supplementary material
Supplemental data for this article can be accessed online at https://doi.org/10.1080/15592294.2022.2105033
Additional information
Funding
Related Research Data
References
- Seelig DM, Avery AC, Ehrhart EJ, et al. The comparative diagnostic features of canine and human lymphoma. Vet Sci. 2016;3(2). doi:10.3390/vetsci3020011
- Elvers I, Turner-Maier J, Swofford R, et al. Exome sequencing of lymphomas from three dog breeds reveals somatic mutation patterns reflecting genetic background. Genome Res. 2015;25(11):1634–1645.
- Bushell KR, Kim Y, Chan FC, et al. Genetic inactivation of TRAF3 in canine and human B-cell lymphoma. Blood. 2015;125(6):999–1005.
- Seelig DM, Ito D, Forster CL, et al. Constitutive activation of alternative nuclear factor kappa B pathway in canine diffuse large B-cell lymphoma contributes to tumor cell survival and is a target of new adjuvant therapies. Leuk Lymphoma. 2017;58(7):1702–1710.
- Mudaliar MA, Haggart RD, Miele G, et al. Comparative gene expression profiling identifies common molecular signatures of NF-kappaB activation in canine and human diffuse large B cell lymphoma (DLBCL). PLoS One. 2013;8(9):e72591.
- Burton JH, Mazcko C, LeBlanc A, et al. NCI comparative oncology program testing of non-camptothecin indenoisoquinoline topoisomerase i inhibitors in naturally occurring canine lymphoma. Clin Cancer Res. 2018;24(23):5830–5840.
- Marconato L, Frayssinet P, Rouquet N, et al. Randomized, placebo-controlled, double-blinded chemoimmunotherapy clinical trial in a pet dog model of diffuse large B-cell lymphoma. Clin Cancer Res. 2014;20(3):668–677.
- Gardner HL, Rippy SB, Bear MD, et al. Phase I/II evaluation of RV1001, a novel PI3Kdelta inhibitor, in spontaneous canine lymphoma. PLoS One. 2018;13(4):e0195357.
- Pasqualucci L, Dalla-Favera R. Genetics of diffuse large B-cell lymphoma. Blood. 2018;131(21):2307–2319.
- Komaki S, Shiwa Y, Furukawa R, et al. iMETHYL: an integrative database of human DNA methylation, gene expression, and genomic variation. Hum Genome Var. 2018;5(1):18008.
- Baylin SB, Jones PA. Epigenetic determinants of cancer. Cold Spring Harb Perspect Biol. 2016;8(9):a019505.
- Shaknovich R, Geng H, Johnson NA, et al. DNA methylation signatures define molecular subtypes of diffuse large B-cell lymphoma. Blood. 2010;116(20):e81–9.
- Chambwe N, Kormaksson M, Geng H, et al. Variability in DNA methylation defines novel epigenetic subgroups of DLBCL associated with different clinical outcomes. Blood. 2014;123(11):1699–1708.
- Ferraresso S, Arico A, Sanavia T, et al. DNA methylation profiling reveals common signatures of tumorigenesis and defines epigenetic prognostic subtypes of canine diffuse large B-cell lymphoma. Sci Rep. 2017;7(1):11591.
- Hsu CH, Tomiyasu H, Lee JJ, et al. Genome-wide DNA methylation analysis using MethylCap-seq in canine high-grade B-cell lymphoma. J Leukoc Biol. 2020;109(6):1089–1103.
- Yamazaki J, Jelinek J, Hisamoto S, et al. Dynamic changes in DNA methylation patterns in canine lymphoma cell lines demonstrated by genome-wide quantitative DNA methylation analysis. Vet J. 2018;231:48–54.
- Epiphanio TMF, Fernandes N, de Oliveira TF, et al. Global DNA methylation of peripheral blood leukocytes from dogs bearing multicentric non-Hodgkin lymphomas and healthy dogs: a comparative study. PLoS One. 2019;14(3):e0211898.
- Martin-Subero JI, Kreuz M, Bibikova M, et al. New insights into the biology and origin of mature aggressive B-cell lymphomas by combined epigenomic, genomic, and transcriptional profiling. Blood. 2009;113(11):2488–2497.
- Richards KL, Motsinger-Reif AA, Chen HW, et al. Gene profiling of canine B-cell lymphoma reveals germinal center and postgerminal center subtypes with different survival times, modeling human DLBCL. Cancer Res. 2013;73(16):5029–5039.
- Avery AC. The genetic and molecular basis for canine models of human leukemia and lymphoma. Front Oncol. 2020;10:23.
- Wu Y, Chang YM, Polton G, et al. Gene expression profiling of B cell lymphoma in dogs reveals dichotomous metabolic signatures distinguished by oxidative phosphorylation. Front Oncol. 2020;10:307.
- Curran KM, Schaffer PA, Frank CB, et al. BCL2 and MYC are expressed at high levels in canine diffuse large B-cell lymphoma but are not predictive for outcome in dogs treated with CHOP chemotherapy. Vet Comp Oncol. 2017;15(4):1269–1279.
- Schmitz R, Wright GW, Huang DW, et al. Genetics and pathogenesis of diffuse large B-cell lymphoma. N Engl J Med. 2018;378(15):1396–1407.
- Sparks A, Woods JP, Bienzle D, et al. Whole genome sequencing analysis of high confidence variants of B-cell lymphoma in Canis familiaris. PLoS One. 2020;15(8):e0238183.
- Aberg KA, McClay JL, Nerella S, et al. MBD-seq as a cost-effective approach for methylome-wide association studies: demonstration in 1500 case–control samples. Epigenomics. 2012;4(6):605–621.
- Almamun M, Levinson BT, Gater ST, et al. Genome-wide DNA methylation analysis in precursor B-cells. Epigenetics. 2014;9(12):1588–1595.
- Almamun M, Levinson BT, van Swaay AC, et al. Integrated methylome and transcriptome analysis reveals novel regulatory elements in pediatric acute lymphoblastic leukemia. Epigenetics. 2015;10(9):882–890.
- Harris RA, Wang T, Coarfa C, et al. Comparison of sequencing-based methods to profile DNA methylation and identification of monoallelic epigenetic modifications. Nat Biotechnol. 2010;28(10):1097–1105.
- Aberg KA, Chan RF, van den Oord EJCG. MBD-seq - realities of a misunderstood method for high-quality methylome-wide association studies. Epigenetics. 2020;15(4):431–438.
- Glickman LG, Nita T, and Roland. The Golden Retriever Club of America National Health Survey 1998-199899. Texas: Golden Retriever Club of America; 1999.
- Villamil JA, Henry CJ, Hahn AW, et al. Hormonal and sex impact on the epidemiology of canine lymphoma. J Cancer Epidemiol. 2009;2009:591753.
- Irizarry RA, Ladd-Acosta C, Wen B, et al. The human colon cancer methylome shows similar hypo- and hypermethylation at conserved tissue-specific CpG island shores. Nat Genet. 2009;41(2):178–186.
- Zhang Y, Parmigiani G, Johnson WE. batch effect adjustment for RNA-seq count data. NAR Genom Bioinform. 2020;2(3):lqaa078
- Price EM, Robinson WP. Adjusting for batch effects in DNA methylation microarray data, a lesson learned. Front Genet. 2018;9:83.
- Nehme E, Rahal Z, Sinjab A, et al. Epigenetic suppression of the T-box Subfamily 2 (TBX2) in human non-small cell lung cancer. Int J Mol Sci. 2019;20(5):1159.
- Wansleben S, Peres J, Hare S, et al. T-box transcription factors in cancer biology. Biochim Biophys Acta. 2014;1846(2):380–391.
- Aresu L, Ferraresso S, Marconato L, et al. New molecular and therapeutic insights into canine diffuse large B cell lymphoma elucidates the role of the dog as a model for human disease. Haematologica. 2018;104(6):e256–e259.
- Costa VL, Henrique R, Danielsen SA, et al. TCF21 and PCDH17 methylation: an innovative panel of biomarkers for a simultaneous detection of urological cancers. Epigenetics. 2011;6(9):1120–1130.
- Lin YL, Xie PG, Wang L, et al. Aberrant methylation of protocadherin 17 and its clinical significance in patients with prostate cancer after radical prostatectomy. Med Sci Monit. 2014;20:1376–1382.
- Haruki S, Imoto I, Kozaki K, et al. Frequent silencing of protocadherin 17, a candidate tumour suppressor for esophageal squamous cell carcinoma. Carcinogenesis. 2010;31(6):1027–1036.
- Model F, Osborn N, Ahlquist D, et al. Identification and validation of colorectal neoplasia-specific methylation markers for accurate classification of disease. Mol Cancer Res. 2007;5(2):153–163.
- Uyen TN, Sakashita K, Al-Kzayer LF, et al. Aberrant methylation of protocadherin 17 and its prognostic value in pediatric acute lymphoblastic leukemia. Pediatr Blood Cancer. 2017;64(3):e26259.
- Huang W, Xue X, Shan L, et al. Clinical significance of PCDH10 promoter methylation in diffuse large B-cell lymphoma. BMC Cancer. 2017;17(1):815.
- Ying J, Li H, Seng TJ, et al. Functional epigenetics identifies a protocadherin PCDH10 as a candidate tumor suppressor for nasopharyngeal, esophageal and multiple other carcinomas with frequent methylation. Oncogene. 2006;25(7):1070–1080.
- Su J, Huang YH, Cui X, et al. Homeobox oncogene activation by pan-cancer DNA hypermethylation. Genome Biol. 2018;19(1):108.
- Comazzi S, Marelli S, Cozzi M, et al. Breed-associated risks for developing canine lymphoma differ among countries: an European canine lymphoma network study. BMC Vet Res. 2018;14(1):232.
- Arendt ML, Melin M, Tonomura N, et al. Genome-wide association study of Golden Retrievers identifies germ-line risk factors predisposing to mast cell tumours. PLoS Genet. 2015;11(11):e1005647.
- Quignon P, Herbin L, Cadieu E, et al. Canine population structure: assessment and impact of intra-breed stratification on SNP-based association studies. PLoS One. 2007;2(12):e1324.
- Johnstone SE, Reyes A, Qi Y, et al. Large-scale topological changes restrain malignant progression in colorectal cancer. Cell. 2020;182(6):1474–89.e23.
- Eden A, Gaudet F, Waghmare A, et al. Chromosomal instability and tumors promoted by DNA hypomethylation. Science. 2003;300(5618):455.
- Yegnasubramanian S, Haffner MC, Zhang Y, et al. DNA hypomethylation arises later in prostate cancer progression than CpG island hypermethylation and contributes to metastatic tumor heterogeneity. Cancer Res. 2008;68(21):8954–8967.
- Bock C, Tomazou EM, Brinkman AB, et al. Quantitative comparison of genome-wide DNA methylation mapping technologies. Nat Biotechnol. 2010;28(10):1106–1114.
- Olkhov-Mitsel E, Bapat B. Strategies for discovery and validation of methylated and hydroxymethylated DNA biomarkers. Cancer Med. 2012;1(2):237–260.
- Chen YC, Elnitski L. Aberrant DNA methylation defines isoform usage in cancer, with functional implications. PLoS Comput Biol. 2019;15(7):e1007095.
- Shukla S, Kavak E, Gregory M, et al. CTCF-promoted RNA polymerase II pausing links DNA methylation to splicing. Nature. 2011;479(7371):74–79.
- Ringrose L, Paro R. Epigenetic regulation of cellular memory by the polycomb and trithorax group proteins. Annu Rev Genet. 2004;38(1):413–443.
- Widschwendter M, Fiegl H, Egle D, et al. Epigenetic stem cell signature in cancer. Nat Genet. 2007;39(2):157–158.
- Boyer LA, Plath K, Zeitlinger J, et al. Polycomb complexes repress developmental regulators in murine embryonic stem cells. Nature. 2006;441(7091):349–353.
- Yassi M, Shams Davodly E, Mojtabanezhad Shariatpanahi A, et al. DMRFusion: a differentially methylated region detection tool based on the ranked fusion method. Genomics. 2018;110(6):366–374.
- Mishra NK, Guda C. Genome-wide DNA methylation analysis reveals molecular subtypes of pancreatic cancer. Oncotarget. 2017;8(17):28990–29012.
- Kuasne H, Colus IM, Busso AF, et al. Genome-wide methylation and transcriptome analysis in penile carcinoma: uncovering new molecular markers. Clin Epigenetics. 2015;7(1):46.
- Lai HC, Lin YW, Huang TH, et al. Identification of novel DNA methylation markers in cervical cancer. Int J Cancer. 2008;123(1):161–167.
- Song MA, Tiirikainen M, Kwee S, et al. Elucidating the landscape of aberrant DNA methylation in hepatocellular carcinoma. PLoS One. 2013;8(2):e55761.
- Kim JH, Karnovsky A, Mahavisno V, et al. LRpath analysis reveals common pathways dysregulated via DNA methylation across cancer types. BMC Genomics. 2012;13(1):526.
- Morin RD, Mungall K, Pleasance E, et al. Mutational and structural analysis of diffuse large B-cell lymphoma using whole-genome sequencing. Blood. 2013;122(7):1256–1265.
- Shah N, Sukumar S. The Hox genes and their roles in oncogenesis. Nat Rev Cancer. 2010;10(5):361–371.
- Shiraishi M, Sekiguchi A, Oates AJ, et al. HOX gene clusters are hotspots of de novo methylation in CpG islands of human lung adenocarcinomas. Oncogene. 2002;21(22):3659–3662.
- Strathdee G, Holyoake TL, Sim A, et al. Inactivation of HOXA genes by hypermethylation in myeloid and lymphoid malignancy is frequent and associated with poor prognosis. Clin Cancer Res. 2007;13(17):5048–5055.
- Choi JH, Li Y, Guo J, et al. Genome-wide DNA methylation maps in follicular lymphoma cells determined by methylation-enriched bisulfite sequencing. PLoS One. 2010;5(9):e13020.
- Kanduri M, Sander B, Ntoufa S, et al. A key role for EZH2 in epigenetic silencing of HOX genes in mantle cell lymphoma. Epigenetics. 2013;8(12):1280–1288.
- Ishizaki T, Yamazaki J, Jelinek J, et al. Genome-wide DNA methylation analysis identifies promoter hypermethylation in canine malignant melanoma. Res Vet Sci. 2020;132:521–526.
- Remacha L, Curras-Freixes M, Torres-Ruiz R, et al. Gain-of-function mutations in DNMT3A in patients with paraganglioma. Genet Med. 2018;20(12):1644–1651.
- Velichutina I, Shaknovich R, Geng H, et al. EZH2-mediated epigenetic silencing in germinal center B cells contributes to proliferation and lymphomagenesis. Blood. 2010;116(24):5247–5255.
- Ropa J, Saha N, and Hu H, et al. SETDB1 mediated histone H3 lysine 9 methylation suppresses MLL-fusion target expression and leukemic transformation. Haematolo-gica. 2020 105 9 2273–2285 .
- Choi HJ, Lee HB, Park HK, et al. EZH2 expression in naturally occurring canine tumors. Comp Med. 2018;68(2):148–155.
- Heery R, Schaefer MH. DNA methylation variation along the cancer epigenome and the identification of novel epigenetic driver events. Nucleic Acids Res. 2021;49(22):12692–12705.
- Patani H, Rushton MD, Higham J, et al. Transition to naïve human pluripotency mirrors pan-cancer DNA hypermethylation. Nat Commun. 2020;11(1):3671.
- Rout ED, Avery PR. Lymphoid neoplasia: correlations between morphology and flow cytometry. Vet Clin North Am Small Anim Pract. 2017;47(1):53–70.
- Wolf-Ringwall A, Lopez L, Elmslie R, et al. Prospective evaluation of flow cytometric characteristics, histopathologic diagnosis and clinical outcome in dogs with naive B-cell lymphoma treated with a 19-week CHOP protocol. Vet Comp Oncol. 2019;18(3):342–352.
- Ponce F, Marchal T, Magnol JP, et al. A morphological study of 608 cases of canine malignant lymphoma in France with a focus on comparative similarities between canine and human lymphoma morphology. Vet Pathol. 2010;47(3):414–433.
- Vezzali E, Parodi AL, Marcato PS, et al. Histopathologic classification of 171 cases of canine and feline non-Hodgkin lymphoma according to the WHO. Vet Comp Oncol. 2010;8(1):38–49.
- Valli VE, San Myint M, Barthel A, et al. Classification of canine malignant lymphomas according to the World Health Organization criteria. Vet Pathol. 2011;48(1):198–211.
- Lautscham EM, Kessler M, Ernst T, et al. Comparison of a CHOP-LAsp-based protocol with and without maintenance for canine multicentric lymphoma. Vet Rec. 2017;180(12):303.
- Curran K, Thamm DH. Retrospective analysis for treatment of naive canine multicentric lymphoma with a 15-week, maintenance-free CHOP protocol. Vet Comp Oncol. 2016;14(Suppl 1):147–155.
- Burton JH, Garrett-Mayer E, Thamm DH. Evaluation of a 15-week CHOP protocol for the treatment of canine multicentric lymphoma. Vet Comp Oncol. 2013;11(4):306–315.
- Childress MO, Ramos-Vara JA, Ruple A. Retrospective analysis of factors affecting clinical outcome following CHOP-based chemotherapy in dogs with primary nodal diffuse large B-cell lymphoma. Vet Comp Oncol. 2018;16(1):E159–E68.
- Sorenmo K, Overley B, Krick E, et al. Outcome and toxicity associated with a dose-intensified, maintenance-free CHOP-based chemotherapy protocol in canine lymphoma: 130 cases. Vet Comp Oncol. 2010;8(3):196–208.
- Martin M. Cutadapt removes adapter sequences from high-throughput sequencing reads. EMBnetjournal. 2011;17(1):10–12.
- Bolger AM, Lohse M, Usadel B. Trimmomatic: a flexible trimmer for Illumina sequence data. Bioinformatics. 2014;30(15):2114–2120.
- Li H, Durbin R. Fast and accurate short read alignment with Burrows-Wheeler transform. Bioinformatics. 2009;25(14):1754–1760.
- Lienhard M, Grimm C, Morkel M, et al. MEDIPS: genome-wide differential coverage analysis of sequencing data derived from DNA enrichment experiments. Bioinformatics. 2014;30(2):284–286.
- Lizio M, Harshbarger J, Shimoji H, et al. Gateways to the FANTOM5 promoter level mammalian expression atlas. Genome Biol. 2015;16(1):22.
- Lizio M, Mukarram AK, Ohno M, et al. Monitoring transcription initiation activities in rat and dog. Sci Data. 2017;4(1):170173.
- Dreos R, Ambrosini G, Perier RC, et al. The Eukaryotic promoter database: expansion of EPDnew and new promoter analysis tools. Nucleic Acids Res. 2015;43( Database issue):D92–6.
- Breiman L. Random Forests. Mach Learn. 2001;45(1):5–32.