
ABSTRACT
In this study, we investigated the association between altered methylation in the maternal placenta and hyperglycaemia and explored the epigenetic mechanisms underlying gestational diabetes mellitus (GDM). Reduced representation bisulphite sequencing (RRBS) and RNA sequencing (RNA-seq) were performed on placental tissues obtained from women with GDM and healthy controls. Further, pyrosequencing, correlation analyses, and linear regression analyses were performed to valuate relationships between aberrantly methylated-differentially expressed genes and clinical parameters. The EMBOSS and JASPAR databases were used for a computational analysis of CpG islands and transcription factor-binding sites in the TRIM67 promoter region. A CpG island with a length of 264 bp in the placental TRIM67 promoter region in the GDM group exhibited significant hypermethylation at four CpG sites. The hypermethylation of the TRIM67 promoter region in the maternal placenta showed a significant, positive correlation with the 1 h and 2 h oral glucose tolerance test (OGTT) values and a negative correlation with lipoprotein(a). Placental DNA methylation levels in the TRIM67 promoter region were markedly elevated in GDM and were associated with blood glucose and lipid levels during healthy pregnancy.
Introduction
Gestational diabetes mellitus (GDM) is characterized by hyperglycaemia; it can occur at any time during pregnancy and does not indicate diabetes in pregnancy (DIP) [Citation1]. The indications of DIP are as follows: fasting plasma glucose (FPG) concentration ≥7.0 mmol/L (126 mg/dL), and/or 2 h oral glucose tolerance test (OGTT; 75 g) value ≥11.1 mmol/L (200 mg/dL), or random plasma glucose (RPG) concentration ≥11.1 mmol/L (200 mg/dL) [Citation1]. The prevalence of GDM has risen substantially worldwide and ranges from <1% to 28% [Citation2]. The total incidence of GDM in mainland China is 14.8% [Citation3]. Expectant mothers with an advanced maternal age (≥35 years), overweight, hyperglycaemic, or with a family history of type 2 diabetes (T2DM) are likely to experience difficulty in managing issues related to insulin sensitivity [Citation4,Citation5]. Pregnant women with GDM have a high risk of developing gestational hypertension and pre-eclampsia. Furthermore, chronic metabolic and cardiovascular diseases induced by GDM have long-term effects on women, and their offspring are more likely to develop obesity and T2DM during their lifetime [Citation6]. The adverse outcomes of GDM during pregnancy may include premature delivery, spontaneous abortion, and stillbirth [Citation7]. Furthermore, GDM may lead to foetal macrosomia, newborn hyperinsulinemia, neonatal hypoglycaemia, maternal adiposis, and cardiovascular diseases [Citation8,Citation9].
These risks can be determined during embryonic and foetal growth in the uterus, an approach known as the developmental origins of health and disease (DOHaD) [Citation8]. An abnormal intrauterine environment resulting from a suboptimal maternal health status and excessive nutrient intake contributes to an increased maternal and/or foetal susceptibility to metabolic diseases [Citation10]. However, the exact molecular mechanisms, including epigenetic modifications, underlying the developmental and metabolic programming of GDM remain unclear.
The placenta is a pivotal organ for material exchange between the mother and foetus and a target for maternal and/or foetal metabolic disturbances associated with GDM [Citation11]. A hyperglycaemic intrauterine environment caused by maternal glucose intolerance leads to placental epigenetic modifications in the GDM population [Citation12]. Epigenetic variation mediated by a detrimental intrauterine environment is regarded as a potential source of biomarkers for determining the effect of metabolic disturbances on maternal endocrine regulation and foetal development [Citation13]. It has been reported that placental DNA methylation is primarily related to the regulation of maternal insulin sensitivity [Citation14]. A large-scale quantitative study has confirmed that placental DNA hypermethylation is associated with GDM, independent of established risk factors [Citation15]. Alterations in MEG3 hypermethylation have been observed only in the maternal placenta in GDM groups, which is perhaps a consequence of the intrauterine hyperglycaemic environment [Citation16]. There is increasing evidence for a correlation between variation in gene methylation in GDM maternal placental tissues and high glucose concentrations in the uterus [Citation17,Citation18]. Changes in DNA methylation may indicate an adaptive response of the placenta to modulate glucose intolerance in women with GDM [Citation18].
The aim of this study was to investigate the DNA methylation alterations in the maternal placenta under hyperglycaemic conditions and to explore the potential epigenetic mechanisms underlying GDM.
Materials and methods
Sample collection
This original case-control study enrolled 2,803 singleton pregnant women, including 249 women with GDM and 2,554 healthy women from First People’s Hospital of Kunshan, Jiangsu Province, China from July 2016 to December 2016. The standard diagnosis for GDM during the 24th and 28th gestational weeks includes FPG >5.1 mmol/L, 1 h OGTT > 10 mmol/L, or 2 h OGTT > 8.5 mmol/L, according to the criteria of the International Association of Diabetes and Pregnancy Study Groups (IADPSG). Women exceeding either OGTT threshold were assigned to the GDM group, and diet and exercise interventions were implemented. Women who had no history of GDM or diabetes and had normal glucose tolerance during pregnancy were assigned to the healthy group. Women with severe cardiovascular diseases, pre-existing diabetes mellitus related to glucose metabolism disorders, or other complicated diseases were excluded from the study. All participants were checked for daily blood glucose levels and had appropriate diet and exercise interventions to regulate the blood glucose levels within normal ranges of FPG <5.3 mmol/L and 2 h postprandial glycaemia <6.7 mmol/L before delivery under the supervision of their doctors.
Twenty-four healthy women with GDM were randomly selected and age-matched according to their age at delivery. Maternal placenta samples (N = 48) were obtained within 2 h after term delivery. The maternal placenta tissues, including the intervillous tissues and chorionic villi, were sampled for subsequent analyses. All placenta samples in this study were taken from the same region as indicated in Figure S1. Placenta samples were immediately frozen in liquid nitrogen at −80°C until use.
The ethics committee of Shanghai Institute of Planned Parenthood Research approved this study (Number: PJ2016-16), and all study participants provided written informed consent in accordance with the Declaration of Helsinki.
Reduced representation bisulphite sequencing (RRBS)
Total genomic DNA was extracted from the placental samples using the EasyPure® Genomic DNA Kit (EE101; TransGen Biotech, Beijing, China) according to the manufacturer’s instructions. Genome-wide DNA methylation profiles of five GDM samples and five healthy samples were examined via RRBS. The ten samples used for the RRBS analysis were randomly selected from the placental samples (N = 48). Briefly, 500 ng of the extracted DNA was digested using MspI. Then, the DNA fragments were processed by 3′ end-repair, A′ tailing, and methylated adaptor ligation. Bisulphite disposal was followed by polymerase-chain reaction (PCR) amplification. The multiplexed samples were pooled into a DNA library and were paired-end sequenced to obtain 100-bp reads (HiSeq-2000; Illumina, San Diego, CA, USA).
RNA sequencing
Total RNA was isolated using the EasyPure® RNA Kit (ER101; TransGen Biotech, Beijing, China) according to the manufacturer’s protocols. RNA-Seq was performed for the same ten samples used for RRBS using the Illumina Hiseq-2000 platform to generate paired-end reads of 150 bp according to Illumina’s protocol. Values of p < 0.05 and |log2 [fold change (FC)]| >0.8 were used to identify differentially expressed genes (DEGs).
Functional and pathway enrichment analyses
A Gene Ontology (GO) analysis of DEGs was conducted using the Gene Ontology Consortium (www.geneontology.org/), and a pathway enrichment analysis was performed using the Kyoto Encyclopaedia of Genes and Genomes (KEGG) pathway database.
Pyrosequencing for DEG quantification
Significant DEGs (false discovery rate [FDR]-adjusted p < 0.05) were evaluated by a pyrosequencing assay. DNA strands were extracted from the 48 maternal placental samples using the EpiTect Bisulphite Kit (59,104; Qiagen, Hilden, Germany). The primers were designed using PyroMark Assay Design 2.0, and the sequences used for cohort verification are shown in Table S1. PCR amplification (ABI 9700 PCR System; Applied Biosystems, Waltham, MA, USA) was carried out for 40 cycles. Pyrosequencing was performed using PyroMark Q96/48 ID (Qiagen), and the final data were calculated using PyroQ CpG (Biotage, Uppsala, Sweden) according to the manufacturer’s instructions.
Computational analysis of CpG islands in the TRIM67 promoter region
The European Molecular Biology Open Software Suite (EMBOSS, https://www.ebi.ac.uk/Tools/emboss/) was used to analyse the location of CpG islands in the TRIM67 promoter region. Using the Cistromic (ChIP-Seq) regulation report from the SPP (Signalling Pathways Project, http://www.signalingpathways.org/ominer/query.jsf), all transcription factors (TFs) were predicted. Most representative TFs were selected when Chip-Atlas MACS2 Binding Score > 1700. The predictive sequences of the representative TFBS in the TRIM67 promoter region were obtained using the JASPAR database (https://jaspar.genereg.net/) setting a relative profile score threshold of 80%.
Statistical analysis
Statistical analyses and the generation of plots were performed using IBM SPSS Statistics version 21.0 (IBM Corp., Armonk, NY, USA), R package version 4.2.0, and Prism 8 (GraphPad Software Inc., La Jolla, CA, USA). Two-sided tests were performed with p < 0.05 indicating statistical significance. Continuous data are presented as means ± standard deviation (SD), and categorical data are presented as frequencies (percentages). The differences between the GDM and healthy groups were evaluated using the independent samples t-test for continuous variables with normal distribution. Pearson’s chi-square test was used for categorical variables. Spearman’s correlation coefficient was used to evaluate the association between placental DNA methylation and blood glucose and lipid concentrations.
Results
Clinical characteristics
The characteristics of the 48 Chinese participants (aged 20–40 years) and their newborns are shown in . Prior to pregnancy, most women with GDM and healthy controls had a normal body mass index (BMI) (54.17% and 83.33), greater than high school level of education (58.33% and 70.84%), normal systolic blood pressure (95.83% and 100%), and normal diastolic blood pressure (83.33% and 100%), respectively. Women with GDM had significantly higher FPG (p = 0.002), 1 h OGTT, and 2 h OGTT (p < 0.001) values than those of healthy controls.
Table 1. Participants’ characteristics in the study (N = 48).
Identification of placental differentially methylated genes and DEGs in the GDM and healthy groups
The 5′ UTR and 2,000 bp sequence upstream of the 5′ UTR were selected as the target sequences to screen the number of CpG sites in the promoter region of the differentially methylated genes (DMGs). CpG sites of 14,374 genes were identified in the promoter region by RRBS. Moreover, 4,224 hypomethylated CpG sites of 2,593 genes and 3,348 hypermethylated CpG sites of 2,166 genes were screened in the GDM placental samples as compared with levels in the healthy group (p < 0.01). Every differentially methylated CpG site, distributed on 22 autosomal chromosomes, is recorded in a circus plot in . The proportions of all the CpG sites in the promoter region and those of the differentially methylated CpG sites are shown in . All the DEGs, including the up-regulated and down-regulated genes, are presented in a volcano plot in .
Figure 1. Comparison of distribution and methylation levels of all differentially methylated genes across the human genome between five GDM samples and five healthy controls. Up-regulated and down-regulated genes after screening are indicated in green and yellow, respectively. The outer ring with numbers 1 to 22 respectively represents 22 autosomes. The inner ring with red and blue pattern shows the methylation levels of DMGs. Circle graph of DMGs throughout autosomal chromosome showing -log10 (p-value).
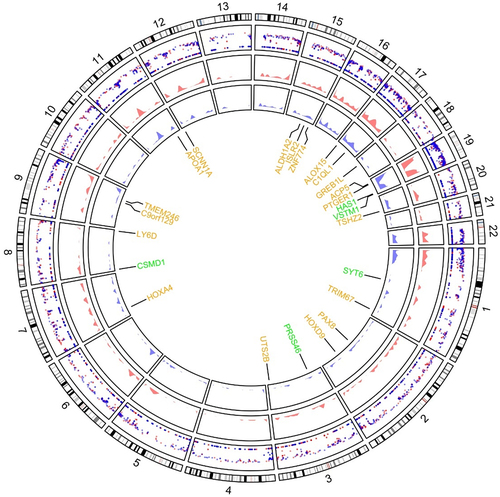
Figure 2. (a) Proportion of differentially methylated CpG sites identified by RRBS analysis from 5 GDM samples and 5 healthy controls in relation to genomic location across the human genome. UTR: untranslated region; CDS: coding domain sequence. (b) The volcano plot of all differentially expressed genes comparing 4 GDM samples with 4 control groups (p-value <0.05) including up-regulated genes (yellow dots) and down-regulated genes (green dots) by RNA-Seq analysis.
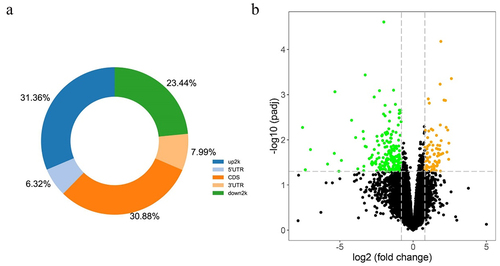
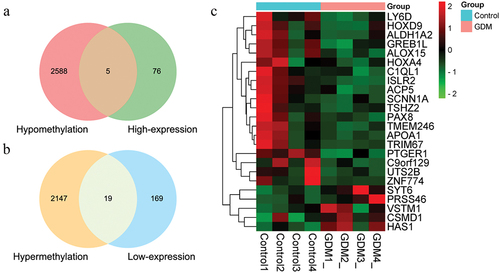
A total of 16,473 transcripts were acquired. Based on threshold values of p < 0.05 and |log2FC| > 0.8, 269 DEGs, including 81 significantly upregulated genes and 188 downregulated genes, were identified in the GDM placental samples compared with the healthy group. An overlap was observed between aberrantly methylated and regulated genes (i.e., 5 hypomethylated genes showing high expression and 19 hypermethylated genes showing low expression), as shown in a Venn diagram (). Owing to the degradation in a pair of RNA samples, we conducted RNA-seq using four GDM samples and four samples from healthy controls. A heatmap of the expression levels of DEGs, including VSTM1, SYT6, PRSS46, HAS1, CSMD1, ZNF774, UTS2B, TSHZ2, TRIM67, TMEM246, SCNN1A, PTGER1, PAX8, LY6D, ISLR2, HOXD9, HOXA4, GREB1L, C9orf129, C1QL1, APOA1, ALOX15, ALDH1A2, and ACP5, in the eight samples is shown in . The chromosomal locations of these 24 DEGs are indicated in yellow and green in .
Figure 3. The Venn graph integrated RRBS and RNA-Seq results showing the whole number of aberrantly methylated-differentially expressed genes overlapped including five up-regulated genes (a) and nineteen down-regulated genes (b). (c) A total of 24 screened genes were shown in heatmap according to the expression levels between four GDM samples and four healthy controls, which were also signed in identifying their location in chromosomes.
The promoter regions of HOXD9, ALDH1A2, CSMD1, TRIM67, and PAX8 () were validated by bisulphite pyrosequencing (FDR-adjusted p < 0.05). A CpG island (chromosome 1: 231,161,306–231,161,569) with a length of 264 bp was found in the promoter region of the TRIM67 gene via EMBOSS (Figure S2). Nine CpG sites (chromosome 1: 231,161,412–231,161,462) were identified on the CpG island in the TRIM67 promoter region (chromosome 1: 231,161,125–231,161,625) using pyrophosphate sequencing (). CpG sites 3, 5, 7, and 9 in the TRIM67 promoter region exhibited significant hypermethylation in the GDM samples as compared with levels in the healthy control samples (). The methylation levels of the CpG sites in HOXD9, ALDH1A2, CSMD1, and PAX8, which did not differ significantly between groups, are shown in Figure S3. Detailed information for the three representative TFs with high scores and the nucleotide sequences obtained by TFBS in the TRIM67 promoter region predicted by the JASPAR database are presented in and in . CpG site 1 (chromosome 1: 231,161,412–231,161,413) was located in NR2F2 binding sites within the TRIM67 promoter region.
Figure 4. Graph of differentially methylated regions in TRIM67 gene assessed by pyrosequencing (a) and diagram plots of nucleotide sequence of three representative transcription factors binding sites (b, c, d). (a) CpG sites 3, 5, 7 and 9 exhibited significant hypermethylation levels (blue solid circular) in TRIM67 promoter between GDM samples and healthy controls. Most representative TF (b)GATA2, (c)TEAD4, and (d)NR2F2 in TRIM67 promoter were selected and identified by JASPAR database. The size of the capital letters at each position is proportional to the frequency of nucleotide bases.
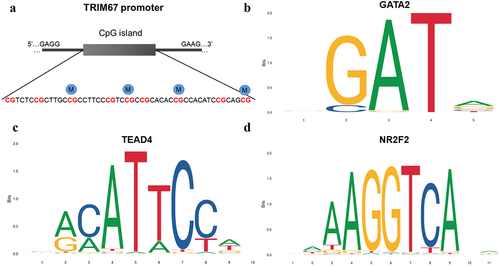
Figure 5. Comparison with the methylation level of TRIM67 CpG sites between 24 GDM samples and 24 healthy controls (NC) by pyrosequencing analysis. Pearson Chi-square test, *: p < 0.05; **: p < 0.01; ***: p < 0.001.
Table 2. Basic information for the top five candidate differentially expressed genes between 24 GDM samples and 24 healthy controls.
Table 3. Detail information for representative predicted transcription factors in the promoter region of TRIM67 predicted using JASPAR database.
Functional and pathway enrichment analyses
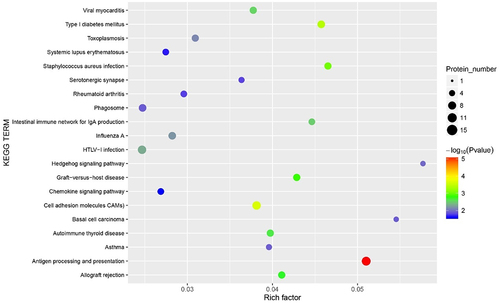
A GO functional analysis showed that most DEGs are involved in biological processes, such as immune response to stimulus, biological regulation, and metabolic processes (). A KEGG enrichment analysis indicated that DEGs are involved in antigen processing and presentation, intestinal immune network for IgA production, and type I diabetes mellitus ().
Figure 6. The Gene Ontology (GO) enrichment bar graph of up-regulated genes (red bars) and down-regulated genes (green bars) among all methylated-differentially expressed genes.
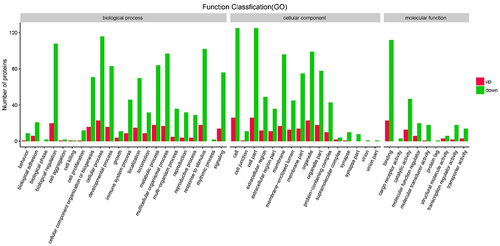
Figure 7. The Kyoto Encyclopaedia of Genes and Genomes (KEGG) pathways bubble chart of all methylated-differentially expressed genes. Data are presented as enriched scores expressed as -log10(p-value).
Association between methylation levels and glucose and lipid levels in GDM
and Table S2 show the associations between glucose and lipid levels and placental DNA methylation changes in TRIM67 CpG sites in GDM, respectively. The methylation levels of CpG Site 3 and 7 in TRIM67 showed a significant, positive correlation with 1 h OGTT (p = 0.001) and 2 h OGTT (p = 0.024, 0.005, respectively). DNA methylation at CpG site 5 in TRIM67 showed a significant, positive correlation with 1 h OGTT (p < 0.001) and 2 h OGTT (p = 0.002) but a negative correlation with lipoprotein(a) [Lp(a)] (p = 0.01). Furthermore, the CpG site 9 in TRIM67 showed a significant, negative correlation with Lp(a) (p = 0.002).
Table 4. Spearman’s correlation analysis showing the association between differentially methylated CpG sites of TRIM67 and fasting glucose, 1 h OGTT, 2 h OGTT, and Lp(a) between 24 GDM samples and 24 healthy controls.
As determined by a linear regression analysis (), there were significant associations between the methylated TRIM67 site 5 and FG and 1 h OGTT, TRIM67 site 7 and 2 h OGTT, and TRIM67 site 9 and Lp(a).
Table 5. Linear regression analysis of differentially methylated TRIM67 CpG sites and glucose/lipid metabolism, adjusting for age and BMI between 24 GDM samples and 24 healthy controls.
Discussion
In this study, we identified 269 DEGs, including 81 significantly upregulated and 188 downregulated genes, in the maternal placenta of women with GDM. Four CpG sites on the CpG island (chromosome 1: 231,161,306–231,161,569) in the promoter region of TRIM67 showed significant hypermethylation in the GDM placental tissues compared with levels in healthy placental tissues (p < 0.05). This is the first evidence for placental methylation alterations in the TRIM67 promoter region among women with GDM, including a significant positive correlation with 1 h and 2 h OGTT values and a significant negative correlation with Lp(a).
The current study establishes the relationship between epigenetic alterations with maternal glucose and lipid levels, thereby focusing on the maternal metabolic health status, including body weight, blood glucose, and blood fat during pregnancy. The influence of hyperglycaemia on epigenetic alterations in the placenta of women with GDM was evaluated.
The pathophysiology of GDM is complex and involves endogenous, environmental, and genetic factors. Maternal insulin sensitivity varies throughout the duration of pregnancy and insulin resistance increases with gestational age to ensure a continuous nutrient supply to the foetus [Citation19]. Hyperglycaemia during pregnancy is a glucose tolerance impairment resulting from insulin resistance in the GDM population [Citation20]. It has also been proposed that chronic hyperglycaemia aggravates insulin resistance and reduces insulin sensitivity, especially during pregnancy [Citation21]. There are increasing reports indicating that DNA methylation alterations in the placenta are associated with maternal glycaemia, maternal insulin sensitivity, and the risk of GDM [Citation13,Citation14,Citation18]. Xie et al. have found that placental methylation of the PPARGC1A promoter is significantly associated with 2 h post-OGTT values, establishing potential relationships among placental gene methylation, maternal gestational glucose levels, and GDM [Citation22]. Previous studies demonstrated the dysregulation of IGF2/H19 promoter methylation in HTR8/SVneo cells exposed to high glucose concentrations, indicating an underlying effect of hyperglycaemia on maternal placental gene methylation [Citation23]. There is an association between maternal placental DNA methylation and maternal glycaemia; however, the causative link between DNA methylation alterations and GDM induced by maternal hyperglycaemia is still unknown.
Moreover, the placenta has a profound influence on the endocrine system, causing the synthesis and secretion of numerous inflammatory cytokines, which can aggravate the chronic inflammatory response and result in a high degree of maternal insulin resistance [Citation24,Citation25]. Inflammatory modulators and immune activation may play a crucial role in the development of T2DM and GDM [Citation25]. Concentrations of C-reactive protein, TNF-α, and IL-6 are elevated in women with GDM [Citation26]. Higher levels of M1 macrophages and lower levels of M2 macrophages were observed in GDM placenta in a recent case–control study, suggesting that low-grade inflammation is associated with GDM [Citation24].
The Tripartite motif (TRIM) family, a major subset of the interesting new (RING)-finger domain E3 ubiquitin ligases family (with ≥80 members in humans), functions by regulating biological processes related to the innate immune system [Citation27,Citation28]. In addition, ubiquitination, catalysed by E3 ubiquitin ligases and other enzymes, is a post-translational modification mechanism with a vital role in the regulation of innate immune signalling pathways in eukaryotes [Citation29,Citation30]. As a subclass I TRIM family member, TRIM67 is expressed during embryonic development [Citation31] and acts as an E3 ubiquitin ligase. It includes an N-terminal RING-finger domain, two zinc-finger domains (B1, B-box domain 1; B2, B-box domain 2), a coiled-coil multimerization region, a C-terminal COS domain, fibronectin type III repeat (FNIII), and SPRY domain [Citation32]. The overexpression of TRIM67 increases the expression of p52 but reduces p100 (NF-κB2 precursor) levels, indicating that TRIM67 expression promotes NF-κB2 processing, which is a non-canonical NF-κB pathway [Citation33]. This NF-κB pathway participates in multiple metabolic diseases, including obesity and T2DM, which are associated with both the dysregulation of immune responses and chronic inflammation [Citation34,Citation35]. The methylation changes in placental gene TRIM67 may be related to the inflammation process; however, further research is needed to clarify this point.
Our study is the first to reveal the significant association between TRIM67 methylation levels and glucose and lipid levels based on OGTT and Lp(a) values. It is well established that gestational FPG and 2 h OGTT values are closely associated with the risk of diabetes [Citation36]. Glucose and insulin concentrations in the fasting phase or after OGTT have been applied to estimate the whole-body insulin sensitivity index [Citation37]. Elevated glucose levels have the potential to activate the inflammatory response in diabetes complications [Citation38]. Increasing evidence has shown that Lp(a) has an inverse association with the risk of diabetes and insulin resistance, with lower levels observed in T2DM cases [Citation39–41], indicating that Lp(a) may be a pivotal metabolic indicator in insulin resistance [Citation41]. A previous study has confirmed that DNA methylation in the maternal placenta can be altered substantially under an unfavourable intrauterine environment [Citation42]. Consistent with these previous observations, our preliminary analyses showed that the DNA methylation of TRIM67 changes among women with GDM and that the underlying biological drivers may be related to the high glucose environment in the uterus. The identification of methylated-differentially expressed genes could provide new insights into the epigenetic mechanisms underlying GDM.
Furthermore, the blood glucose levels of the pregnant women in this study were monitored daily until term delivery and the women were provided dietary and exercise interventions when abnormal glucose levels were detected to avoid the potentially harmful effects of medication on the foetus. Dietary interventions in pregnancy can significantly reduce maternal gestational weight gain and the risk of GDM [Citation43]. Dietary fibre consumption, low glycaemic intake, high protein supplementation, and appropriate physical activity are widely recommended and are beneficial for glycaemic control during pregnancy [Citation44]. A recent study has shown that diet and exercise to control glucose levels in pregnant women with GDM were sufficient to prevent OCLN expression alterations and functional changes in the placenta tissues, suggesting that conventional lifestyle interventions (diet and exercise) do not affect gene expression [Citation45]. To date, few studies have reported the alterations in gene expression in pregnant women with GDM under diet and exercise interventions, emphasizing the need for further studies.
DNA methylation changes gene expression via alterations in the chromatin spatial structure and accessibility of TFs [Citation46]. CpG methylation of promoter sequences impacts gene transcription by hindering the binding of TFs to their recognition motifs in a direct or indirect manner [Citation47]. In this study, a CpG island was found in the promoter region of TRIM67; this region harboured binding sites for three key TFs, TEAD4, GATA2, and NR2F2. CpG site 1 (chromosome 1: 231,161,412–231,161,413) was located in binding sites for NR2F2 within the TRIM67 promoter region. Chicken ovalbumin upstream promoter-transcription factor II (COUP-TFII, also called NR2F2, 45 kDa) is an orphan member of the nuclear receptor family of transcription factors [Citation48]. It affects insulin gene expression and nuclear receptor signalling to regulate glucose homoeostasis [Citation49]. NR2F2 dysfunction is associated with infertility, vascular system abnormalities, metabolic diseases, and cancer [Citation50]. The hypermethylation of the TRIM67 promoter region may functionally affect the binding of NR2F2 and/or other TFs to the recognition motifs, leading to gene silencing. Abnormal TRIM67 gene expression may be associated with many biological processes in women with GDM. The underlying molecular mechanisms involving gene methylation and TF binding in the GDM population should be evaluated further.
The present study had a few limitations. First, a larger number of placental samples are needed, and maternal/cord blood samples may be used for further experimental validation of the relationship between epigenetic alterations and metabolic programming pre-pregnancy and post-pregnancy. Second, we calculated the mean levels of blood glucose and lipids among the participants; however, some variables that were not measured, including medication, dietary habits, individual smoking or second-hand smoking status, indoor air quality, and occupational history, could be confounders. Third, the mixture of various cells in the placenta is a limitation of this study; thus, future single cell analyses of placental tissues are needed. The effect of changes in TRIM67 expression on the pathophysiology of GDM via underlying inflammatory pathways should be verified in future studies.
Conclusions
This preliminary study suggests that placental DNA methylation levels in the TRIM67 promoter are markedly elevated in women with GDM than in healthy controls and are associated with blood glucose and lipid levels during pregnancy. These findings provide a basis for further studies of the pathophysiology of GDM.
Author contributions
Fujia Chen: Methodology, Validation, Formal analysis, Writing – Original Draft.
Xiaoping Fei: Methodology, Resources, Investigation.
Weiqiang Zhu: Methodology, Software, Visualization, Writing – review and editing.
Zhaofeng Zhang: Methodology, Validation, Formal analysis.
Yupei Shen: Methodology, Funding acquisition, Writing – review and editing.
Yanyan Mao: Methodology, Writing – review and editing.
Qianxi Zhu: Methodology, Writing – review and editing.
Jianhua Xu: Methodology, Funding acquisition, Writing – review and editing.
Weijin Zhou: Methodology, Writing – review and editing.
Min Li: Methodology, Funding acquisition, Project administration, Writing – review and editing.
Jing Du: Methodology, Funding acquisition, Project administration, Writing – review and editing.
All authors have approved the final article.
Ethical approval and participation consent
The ethics committee of Shanghai Institute of Planned Parenthood Research approved this study (Number: PJ2016-16), and all study participants provided written informed consent in accordance with the Declaration of Helsinki.
Supplemental Material
Download MS Word (734.9 KB)Acknowledgments
We thank all the study participants.
Disclosure statement
No potential conflict of interest was reported by the author(s).
Data availability statement
The authors confirm that the data supporting the findings of this study are available within the article and its supplementary materials.
Supplementary material
Supplemental data for this article can be accessed online at https://doi.org/10.1080/15592294.2022.2110193
Additional information
Funding
References
- Hod M, Kapur A, Sacks DA, et al. The international federation of gynecology and obstetrics (FIGO) initiative on gestational diabetes mellitus: a pragmatic guide for diagnosis, management, and care. Int J Gynaecol Obstet. 2015;131(Suppl 3):S173–211.
- Wong V, Lin A, Russell H. Adopting the new World Health Organization diagnostic criteria for gestational diabetes: how the prevalence changes in a high-risk region in Australia. Diabetes Res Clin Pract. 2017;129(2):148–153.
- Gao C, Sun X, Lu L, et al. Prevalence of gestational diabetes mellitus in mainland China: a systematic review and meta-analysis. J Diabetes Investig. 2019;10(1):154–162.
- Plows J, Stanley J, Baker P, et al. The pathophysiology of gestational diabetes mellitus. Int J Mol Sci. 2018;19(11):3342–3363.
- Bashir M, Aboulfotouh M, Dabbous Z, et al. Metformin-treated-GDM has lower risk of macrosomia compared to diet-treated GDM- a retrospective cohort study. J Matern Fetal Neonatal Med. 2020;33(14):2366–2371.
- Nguyen-Ngo C, Jayabalan N, Salomon C, et al. Molecular pathways disrupted by gestational diabetes mellitus. J Mol Endocrinol. 2019;63(3):R51–R72.
- Stacey T, Tennant P, McCowan L, et al. Gestational diabetes and the risk of late stillbirth: a case-control study from England, UK. Bjog. 2019;126(8):973–982.
- M RL, H SC, J EA, et al. Palmitate induces apoptotic cell death and inflammasome activation in human placental macrophages. Placenta. 2020;90(12):45–51.
- L BT, A GJ, C SA, et al. Gestational diabetes mellitus is associated with increased CD163 expression and iron storage in the placenta. Am J Reprod Immunol. 2018;80(4):e13020–e13043.
- Y CP, Chu A, W LW, et al. Prenatal growth patterns and birthweight are associated with differential dna methylation and gene expression of cardiometabolic risk genes in human placentas: a discovery-based approach. Reprod Sci. 2018;25(4):523–539.
- Lizárraga D, García-Gasca A. The placenta as a target of epigenetic alterations in women with gestational diabetes mellitus and potential implications for the offspring. Epigenomes. 2021;5(2):13–27.
- Lesseur C, Chen J. Adverse maternal metabolic intrauterine environment and placental epigenetics: implications for fetal metabolic programming. Curr Environ Health Rep. 2018;5(4):531–543.
- Haertle L, El Hajj N, Dittrich M, et al. Epigenetic signatures of gestational diabetes mellitus on cord blood methylation. Clin Epigenetics. 2017;9(1):28–30.
- Hivert MF, Cardenas A, Allard C, et al. Interplay of placental DNA methylation and maternal insulin sensitivity in pregnancy. Diabetes. 2020;69(3):484–492.
- Reichetzeder C, Putra S E D, Pfab T, et al. Increased global placental DNA methylation levels are associated with gestational diabetes. Clin Epigenetics. 2016;8(1):82–93.
- Chen C, Jiang Y, Yan T, et al. Placental maternally expressed gene 3 differentially methylated region methylation profile is associated with maternal glucose concentration and newborn birthweight. J Diabetes Investig. 2021;12(6):1074–1082.
- Finer S, Mathews C, Lowe R, et al. Maternal gestational diabetes is associated with genome-wide DNA methylation variation in placenta and cord blood of exposed offspring. Hum Mol Genet. 2015;24(11):3021–3029.
- Awamleh Z, Butcher DT, Hanley A, et al. Exposure to gestational diabetes mellitus (GDM) alters DNA methylation in placenta and fetal cord blood. Diabetes Res Clin Pract. 2021;174:108690–108701.
- Teng Y, Xuan S, Jiang M, et al. Expression of H(2)S in gestational diabetes mellitus and correlation analysis with inflammatory markers IL-6 and TNF-α. J Diabetes Res. 2020;2020(1):1–11.
- Jayawardane A, Patabendige M, Samaranayake D, et al. Hyperglycemia in pregnancy among South Asian women: a single tertiary care center experience from Colombo, Sri Lanka. Diabetes Res Clin Pract. 2018;145(1):138–145.
- Lee D, M KY, Jung K, et al. Alpha-mangostin improves insulin secretion and protects INS-1 cells from streptozotocin-induced damage. Int J Mol Sci. 2018;19(5):1484–1497.
- Xie X, Gao H, Zeng W, et al. Placental DNA methylation of peroxisome-proliferator-activated receptor-γ co-activator-1α promoter is associated with maternal gestational glucose level. Clin Sci (Lond). 2015;129(4):385–394.
- Zhang Q, Su R, Qin S, et al. High glucose increases IGF-2/H19 expression by changing DNA methylation in HTR8/SVneo trophoblast cells. Placenta. 2022;118:32–37.
- Pan X, Jin X, Wang J, et al. Placenta inflammation is closely associated with gestational diabetes mellitus. Am J Transl Res. 2021;13(5):4068–4079.
- Esser N, Legrand-Poels S, Piette J, et al. Inflammation as a link between obesity, metabolic syndrome and type 2 diabetes. Diabetes Res Clin Pract. 2014;105(2):141–150.
- P DA, Chhun N, C TA, et al. Periodontal pathogens and gestational diabetes mellitus. J Dent Res. 2008;87(4):328–333.
- Esposito D, Koliopoulos M. G and Rittinger K.structural determinants of TRIM protein function. Biochem Soc Trans. 2017;45(1):183–191.
- Yang J, Fu Z, Zhang X, et al. TREM2 ectodomain and its soluble form in alzheimer’s disease. J Neuroinflammation. 2020;17(1):204–210.
- Yang W, Gu Z, Zhang H, et al. To TRIM the immunity: from innate to adaptive immunity. Front Immunol. 2020;11(1):02157–02168.
- Wang HT, Hur S. Substrate recognition by TRIM and TRIM-like proteins in innate immunity. Semin Cell Dev Biol. 2021;111(1):76–85.
- Meroni G. TRIM E3 ubiquitin ligases in rare genetic disorders. Adv Exp Med Biol. 2020;1233(1):311–325.
- Hatakeyama S. TRIM family proteins: roles in autophagy, immunity, and carcinogenesis. Trends Biochem Sci. 2017;42(4):297–311.
- Liu R, Chen Y, Shou T, et al. TRIM67 promotes NF‑κB pathway and cell apoptosis in GA‑13315‑treated lung cancer cells. Mol Med Rep. 2019;20(3):2936–2944.
- Baker RG, Hayden MS, Ghosh S. NF-κB, inflammation, and metabolic disease. Cell Metab. 2011;13(1):11–22.
- Sun SC. The non-canonical NF-κB pathway in immunity and inflammation. Nat Rev Immunol. 2017;17(9):545–558.
- E KA, Temprosa M, C KW, et al. Role of insulin secretion and sensitivity in the evolution of type 2 diabetes in the diabetes prevention program: effects of lifestyle intervention and metformin. Diabetes. 2005;54(8):2404–2414.
- Matsuda M, DeFronzo RA. Insulin sensitivity indices obtained from oral glucose tolerance testing: comparison with the euglycemic insulin clamp. Diabetes Care. 1999;22(9):1462–1470.
- L CK, D WC, K SB, et al. Islet hypersensitivity to glucose is associated with disrupted oscillations and increased impact of proinflammatory cytokines in islets from diabetes-prone male mice. Endocrinology. 2016;157(5):1826–1838.
- Muhanhali D, Zhai T, Cai Z, et al. Lipoprotein(a) concentration is associated with risk of type 2 diabetes and cardiovascular events in a Chinese population with very high cardiovascular risk. Endocrine. 2020;69(1):63–72.
- Qi Q, Workalemahu T, Zhang C, et al. Genetic variants, plasma lipoprotein(a) levels, and risk of cardiovascular morbidity and mortality among two prospective cohorts of type 2 diabetes. Eur Heart J. 2012;33(3):325–334.
- Paige E, L MK, Tsimikas S, et al. Lipoprotein(a) and incident type-2 diabetes: results from the prospective Bruneck study and a meta-analysis of published literature. Cardiovasc Diabetol. 2017;16(1):38–44.
- K BE, M SB, V NZ, et al. Epigenetic regulation of placenta-specific 8 contributes to altered function of endothelial colony-forming cells exposed to intrauterine gestational diabetes mellitus. Diabetes. 2015;64(7):2664–2675.
- Thangaratinam S, Rogozinska E, Jolly K, et al. Effects of interventions in pregnancy on maternal weight and obstetric outcomes: meta-analysis of randomised evidence. BMJ. 2012;344:e2088.
- Rasmussen L, Poulsen CW, Kampmann U, et al. Diet and healthy lifestyle in the management of gestational diabetes mellitus. Nutrients. 2020;12(10):3050–3074.
- Villota SD, Toledo-Rodriguez M, Leach L. Compromised barrier integrity of human feto-placental vessels from gestational diabetic pregnancies is related to downregulation of occludin expression. Diabetologia. 2021;64(1):195–210.
- Kimura R, Lardenoije R, Tomiwa K, et al. Integrated DNA methylation analysis reveals a potential role for ANKRD30B in Williams syndrome. Neuropsychopharmacology. 2020;45(10):1627–1636.
- Yin Y, Morgunova E, Jolma A, et al. Impact of cytosine methylation on DNA binding specificities of human transcription factors. Science. 2017;356(6337):eaaj2239.
- Xu M, Qin J, Tsai SY, et al. The role of the orphan nuclear receptor COUP-TFII in tumorigenesis. Acta Pharmacol Sin. 2015;36(1):32–36.
- Bardoux P, Zhang P, Flamez D, et al. Essential role of chicken ovalbumin upstream promoter-transcription factor II in insulin secretion and insulin sensitivity revealed by conditional gene knockout. Diabetes. 2005May;545:1357–1363. PMID: 15855320
- Polvani S, Pepe S, Milani S, et al. COUP-TFII in health and disease. Cells. 2019;9(1):101.