
ABSTRACT
Gestational diabetes mellitus (GDM) is a maternal metabolic disorder that perturbs placental development and increases the risk of offspring short- and long-term metabolic disorders. The mechanisms by which GDM impairs placental development remain poorly understood. Here, we defined the DNA methylome of GDM placentas and determined whether GDM perturbs methylation at genes important for placental development. We conducted an epigenome-wide association study of 42 placentas from pregnancies in the South African Soweto First 1000 days cohort (S1000). Using genome-wide bisulfite sequencing, we compared non-GDM placentas to GDM placentas with similar proportions from obese and non-obese mothers. Compared to non-GDM, GDM placentas exhibited a distinct methylation profile consisting of 12,210 differentially methylated CpGs (DMCs) that mapped to 3,875 genes. Epigenetically altered genes were enriched in Wnt and cadherin signalling pathways, both critical in placentation and embryogenesis. We also defined regional DNA methylation perturbation in GDM placentas at 11 placental development genes. These findings reveal extensive changes to the placental epigenome of GDM pregnancies and highlight perturbation enriched at important placental development genes. These molecular changes represent potential mechanisms for GDM-induced placental effects that may serve as candidate biomarkers for placental, maternal, and foetal health. Using a study design that used similar proportions of obese and non-obese mothers in our case and control pregnancies, we minimized the detection of changes due to obesity alone. Further work will be necessary to investigate the extent of the influence of obesity on these GDM-related placental epigenetic changes.
Introduction
Gestational diabetes mellitus (GDM) rates are increasing globally, with an estimated 14% of pregnancies affected in 20211. Despite a growing body of research on GDM world-wide, there are only limited data on the prevalence and aetiology of GDM in African countries. The current estimate for the continent of Africa is 14.2%[Citation1], while South Africa’s GDM rates are estimated at 9.1%[Citation2].
GDM is defined as glucose intolerance identified for the first time during pregnancy and is diagnosed at 24 to 28 weeks of gestation [Citation3] in women not previously diagnosed with Type 1 or Type 2 diabetes mellitus. In most cases, GDM is caused by pancreatic β-cell dysfunction [Citation4], which leads to chronic insulin resistance [Citation5] and subsequent hyperglycaemia[Citation6]. Risk factors for GDM include maternal obesity [Citation7], history of delivering a child with macrosomia [Citation8], older maternal age [Citation9], and family history of diabetes [Citation10]. Ethnicity has also been proposed as a risk factor for GDM [Citation11,Citation12], but this has not yet been investigated in a global context.
GDM increases the risk for obstetric complications that pose a risk to foetal health, such as pre-eclampsia [Citation13], operative delivery [Citation14], macrosomia [Citation14], and neonatal hypoglycaemia[Citation15]. Offspring of GDM pregnancies are at increased risk of obesity [Citation16] and impaired glucose tolerance [Citation17] in childhood, and at increased risk of hypertension [Citation18], metabolic syndrome [Citation19], and Type 2 diabetes [Citation20] in adulthood. Molecular mechanisms underlying these effects are unclear. However, a growing body of data suggests a role for placental defects [Citation21]. Although candidate molecular targets for the diagnosis and intervention of the effects of GDM on offspring have been identified in the placenta [Citation22], their roles in placental health remain unclear and predictive biomarkers of foetal health have not been sufficiently defined for clinical use.
The placenta functions as the sole transporter for foetal nutrients, gasses, and waste products. It also acts as a barrier to harmful maternal exposures. Poor maternal metabolic health has been shown to alter placental morphogenesis, function, and pathology, and subsequently impair foetal development [Citation23,Citation24]. Therefore, placental dysfunction has a direct impact on foetal health. GDM has been linked to impaired placenta development manifested as increased placenta size [Citation21,Citation25] and angiogenesis [Citation25,Citation26]. These GDM-induced placental defects are often seen in tandem with adverse foetal outcomes, including foetal macrosomia, large-for-gestational-age, and impaired glucose tolerance [Citation16,Citation20,Citation27]. This suggests GDM-induced impaired placental development plays a vital role in poor foetal and neonatal outcomes. Genes regulating these defects could serve as important biomarkers to predict health outcomes across the lifespan [Citation28].
Placental development and function are tightly regulated by epigenetic mechanisms [Citation29]. DNA methylation is one of the many epigenetic mechanisms [Citation30] that together control gene expression, genomic stability, and normal development [Citation31]. Dysregulation of placental epigenetic mechanisms impairs placental development and subsequent functions required for optimal foetal health. Placental DNA methylation is essential for placentation and diffusional permeability capacity [Citation32–34]. GDM has been proposed to alter placental function by perturbing placental epigenetic mechanisms. For example, placentas from GDM pregnancies exhibit altered methylation at placental energy metabolism genes, such as LEP, ADIPOQ, LPL, and PPARγ [Citation35–38]. However, the effects of GDM on placental development genes remain unclear [Citation39].
The current study describes our assessment of the impact of GDM on genome-wide DNA methylation patterns in placentas from a South African pregnancy cohort. We focus on the perturbation of placental development genes. Studies show that obesity influences pregnancy insulin levels and thus GDM [Citation40]. We designed this study to assess the impact of GDM while minimizing the effects caused by obesity alone. We conducted our experiment using genome-wide bisulfite sequencing (bis-seq) with the Agilent SureSelect Methyl-seq target enrichment system, which covers CpG islands, shores/shelves (±4kb), GENCODE promoters, enhancers, regulatory regions, and DNase I hypersensitive sites. Unlike array-based methods, genome-wide sequencing allows us to assess consecutive CpGs in regulatory regions within gene bodies and between intergenic regions.
Materials and methods
Sample population
Forty-two de-identified placenta samples and data were obtained from the Soweto First 1000 Days Pregnancy Cohort (S1000, SAMRC Developmental Pathways for Health Research Unit at the University of Witwatersrand) [Citation41]. The S1000 cohort was recruited from the Antenatal Clinic and Fetal Medicine Unit at Chris Hani Baragwanath Academic Hospital from June 2013 through July 2016. S1000 participants were Black indigenous South Africans living in Soweto, ≥18 years of age, 14–20 weeks pregnant with singleton pregnancies. Women with known pre-pregnancy diabetes or pregnancies with maternal or foetal complications were excluded. 11.2% of the 741 women tested for GDM [Citation3] were diagnosed with GDM. The current study selected 42 samples using the criteria: HIV-negative, 21 GDM and 21 non-GDM samples, and a similar proportion of obese and non-obese mothers in each disease category. At the time of GDM diagnosis, three non-GDM and two GDM mothers of these selected placenta samples exhibited hypertension with systolic blood pressures ranging from 140 to 142 mmHg and/or diastolic blood pressure ranging from 90 to 93 mmHg. Three non-GDM and five GDM mothers exhibited anaemia with haemoglobin levels ranging from 8 to 10 g/dL. Of the 21 samples from GDM pregnancies, eight received lifestyle intervention, and four received a combination of lifestyle intervention and metformin. None were on insulin.
Placenta sampling
Placental weight, neonatal weight, length, and head circumference were measured at birth. Placenta samples were collected within 1 h of delivery, flash frozen in liquid nitrogen, and stored at −80°C until use. After excess blood was removed, 10 mm tissue punches were taken from the foetal side of the placental disc, at least 3 cm from the placenta edge, and avoiding the umbilical cord and any visible lesions or abnormalities [Citation42].
Epigenome-wide association study (EWAS)
Placental samples were genotyped using PCR amplification of SRY to confirm the sex of the offspring. Genomic DNA was extracted from placenta samples using phenol-chloroform as previously described [Citation43]. The DNA quantity and purity were assessed using the Nanodrop 2000 spectrometer (Thermo Scientific), and the quality of double-stranded DNA (dsDNA) was measured using the Quant-it PicoGreen dsDNA assay (#P7589, Life Technologies). Three μg dsDNA was used for library preparation with the SureSelectXT Human Methyl-Seq Target Enrichment Kit (Agilent) following the manufacturer’s instructions. Libraries were multiplexed and sequenced on the Illumina HiSeq25000 (Illumina) at the David H. Murdock Research Institute (DHMRI). Illumina HiSeq single-end 100 bases long reads were filtered for adaptors and quality trimmed using Trimmomatic [Citation44] (v. 0.35) with a sliding window of four bases and a minimum quality of 15 (Phred score ≥15). Reads were mapped to the UCSC hg19 human genome, and methylation calls were made using Bismark [Citation45] (v. 0.14.5) utilizing Bowtie2 [Citation46] (v. 2.2.5). For quality control, we only used CpGs with ≥10X coverage and ≥20 quality score [Citation47]. Single nucleotide polymorphisms (SNPs) were identified using the UCSC hg19 dbSNP150 dataset and removed to limit false methylation calls. CpGs in ‘blacklist’ regions annotated by ENCODE were also removed from the dataset as they represent repetitive or poorly annotated regions that cannot be accurately aligned [Citation48].
Differentially methylated CpGs (DMCs) were determined using methylKit [Citation49] (v. 1.5) in R [Citation50] (v. 3.4.1). As we previously described [Citation47], we identified CpGs that were differentially methylated between GDM and non-GDM groups using the methylKit [Citation49] logistic regression analyses, which compared the proportion of methylated versus unmethylated cytosines among the reads at a given CpG locus. In the regression model, we adjusted for sex of offspring, maternal BMI, gestational age, maternal age, and mode of delivery. The effect size (weighted by read coverage) was calculated as the mean methylation difference between non-GDM and GDM. The SLIM method was used in methylKit to correct for multiple testing [Citation49] and an FDR (q-value) <0.01 was considered significant.
Annotation of differentially methylated CpGs, pathway analyses, and annotation of regulatory regions
Gene annotation of DMCs was performed using Hypergeometric Optimization of Motif EnRichment [Citation51] (HOMER) (v. 4.10), which annotates in order: 1. TSS (defined from −1kb to +100bp), 2. TTS (defined from −100 bp to +1kb), 3. Exons, 4. 5'UTR Exons, 5. 3'UTR Exons, 6. Introns, and 7. Intergenic. Pathway analysis was completed using Protein Analysis through Evolutionary Relationships [Citation52,Citation53] (PANTHER) (v.16.0, released 2020–12-01) overrepresentation test (Fisher’s exact) and false discovery rate tools. Annotations for regulatory elements were performed using the ORegAnno database through the UCSC Genome Browser (hg19). Using bedtools [Citation54], we identified 4,942 DMCs at ORegAnno regulatory regions, regulatory polymorphisms, transcription factor-binding sites, regulatory haplotypes, and miRNA binding sites.
Quantitative real-time PCR (qRT-PCR)
Statistical analyses
All statistical analyses and plotting were completed using R Software (v.4.0–4.1.1). Graphics were made using the R core package and packages gplots [Citation55], ggplot2 [Citation56], and RColorBrewer [Citation57]. Wherever applicable, normality of the data was confirmed by quantile plot and Shapiro-Wilk goodness-of-fit test, and equal variance was tested by Bartlett’s test. For data not normally distributed, we normalized by log transformation (EBF1, HIST1H3E, and SMOC2 expression levels). Covariates for all models were determined by testing the association of the primary outcomes with maternal (e.g., maternal age, parity, mode of delivery, maternal BMI) and foetal characteristics (e.g., gestational age, sex) using a t-test (categorical covariates) or Spearman’s correlation (continuous covariates). All multivariate linear regressions were adjusted for maternal age, gestational age, maternal BMI, mode of delivery, and sex of offspring (except for the expression analysis, which did not include mode of delivery).
Differences in maternal characteristics between non-GDM and GDM were tested using t-test or chi-square test. Multivariate linear regression was utilized to test the association between (i) GDM status and placental & birth outcomes with and without stratification by sex [female data not shown due to small GDM sample size]; (ii) GDM status or sex of offspring with mean methylation of all queried CpGs (n = 989,582) and mean methylation of all chr X queried CpGs (n = 20,707); (iii) GDM status and mean regional methylation levels; and (iv) GDM status and expression levels. Pearson Chi-square was used to test the null hypotheses that (i) proportions of GOM and LOM DMCs are the same across the chromosomes; (ii) the proportions of genic locations are the same across effect size, and (iii) the proportions of GOM and LOM DMCs are the same across effect size. Genic location was categorized as intragenic, intergenic, promoter-TSS, and TTS. Fisher’s exact test was used to test the null hypotheses that (i) the proportions of intragenic versus intergenic CpGs are the same between the DMCs and the total queried CpGs and (ii) the proportions of genic locations are the same across effect size (similar results achieved with the chi-square test). The expected number of DMCs per chromosome was calculated by multiplying the number of queried CpGs on each chromosome to the ratio of total DMCs (12,210)/total number of queried CpGs (989,582).
The PCA plot was calculated using prcomp in R with a singular value decomposition of the centred data matrix. The unsupervised hierarchical clustering and heatmap were created utilizing Euclidean distance and complete linkage.
Regional methylation of the candidate genes was calculated using the mean methylation level of all CpGs located between the defined flanking DMCs for each genic region (e.g., promoter-TSS, intron 1, etc.). The Benjamini-Hochberg (BH) method was used to correct for multiple testing [Citation58].
Results
Characteristics of 42 mother-infant dyads from the S1000 cohort
Placentas from 42 pregnancies were selected from the Soweto First 1000 Days (S1000) cohort. We used a case–control study design to compare GDM pregnancies to non-GDM pregnancies, selecting for a similar proportion of obese and non-obese mothers in each disease category (see Methods). describes the cohort characteristics from the 42 selected pregnancies. As we previously reported [Citation59], the selected GDM pregnancies had higher maternal age, maternal parity, and proportion of male offspring compared to non-GDM.
Table 1. Characteristics of the 42 mother-infant dyads from the S1000 days cohort.
To determine the relationship between GDM status and offspring birth and placenta outcomes, we assessed differences in placenta weight (grams), placenta efficiency (the ratio of foetal to placental weight), birth weight (grams), birth length (cm), birth head circumference (cm), and ponderal index. After adjusting for maternal age, gestational age, maternal BMI, and mode of delivery, we detected significantly lower birth weight in GDM-exposed males compared to non-GDM-exposed males (Supplemental Table S1). There were not enough female GDM samples to independently test the effects in females. However, when male and female samples were combined, there was no significant association between GDM and birth weight (Supplemental Table S1), suggesting female offspring may respond differently than males. No significant associations were detected for any other outcomes assessed, consistent with a lack of postnatal changes observed in the greater S1000 cohort [Citation41].
S1000 placentas from GDM pregnancies exhibit genome-wide epigenetic dysregulation
To determine the extent to which GDM alters the placental methylome, we measured genome-wide DNA methylation through bisulfite sequencing (bis-seq) using the Agilent SureSelect Methyl-seq target enrichment system. After the removal of data that did not pass quality controls (see Methods), 989,582 CpGs were queried.
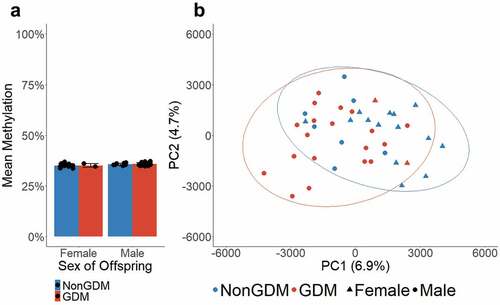
Previous studies have reported an association between mean placental methylation and GDM status [Citation60] as well as mean placental methylation and sex of offspring [Citation61]. Using the average methylation of all queried CpGs (n = 989,582) for each sample, we determined that the mean genome-wide methylation of S1000 placentas did not differ by GDM status (p = 0.500) or sex of offspring (p = 0.082) (). Additionally, we tested whether male vs. female offspring, which carry one versus two X chromosomes, respectively, exhibited differences in mean methylation on the X chromosome (n = 20,707 CpGs). The mean methylation of the X chromosome did not differ by offspring sex (p = 0.409) or GDM status (p = 0.988) (Supplemental Figure S1). Principal component analysis (PCA) was performed as a secondary measure to assess whether methylation levels at all queried CpGs differed between GDM and non-GDM. Although the PCA plots showed some clustering by GDM status (), samples did not cluster by offspring sex (Supplemental Figure S2).
Figure 1. Global mean methylation of S1000 placenta samples. (a) Global mean methylation of placenta samples separated by sex of offspring and bar colours indicate GDM status. Error bars show standard deviation. (b) PCA plot of all queried CpGs (n = 989,582), colours indicate GDM status, shapes indicate sex, ellipses indicate 95% confidence intervals.
We used the R package methylKit [Citation49] to identify CpGs with significant differences in methylation levels between non-GDM and GDM placental samples (using FDR <0.01). We found 12,210 differentially methylated CpGs (DMCs) distributed across the genome (), implicating that GDM effects on placental methylation are genome-wide. To examine if these changes were chromosome-specific (implicating a locus targeted or enriched mechanism of epigenetic perturbation), we calculated the relative enrichment of DMCs at each chromosome as the ratio of the actual and expected number of DMCs using the proportion of queried CpGs on each chromosome (). Several chromosomes exhibited overrepresentation of DMCs, most notably, chromosome (chr) X and chr 13, with 1.8- and 1.5-fold enrichment in observed DMCs, respectively. Additionally, several chromosomes exhibited underrepresentation, most notably, chr 1 and chr 22 (both 0.7-fold). This shows that GDM-associated methylation changes are not evenly distributed across the genome, which could reflect the enrichment of perturbed genes on these chromosomes.
Figure 2. Genome-wide difference in GDM placental methylation status compared to non-GDM. (a) Proportion of total CpGs queried with no changes (unperturbed) vs. significant changes in methylation (DMCs) between GDM and non-GDM placentas; (b) Distribution of DMCs across the genome. Top graph shows number of DMCs (DMC count) localized to each chromosome. Bottom graph shows the ratio of observed/expected DMCs by chromosome; (c) Number of DMCs with effect size <10% vs. ≥10% (d) Proportion of DMCs with different effects sizes (<10% vs. ≥10%) on each chromosome.
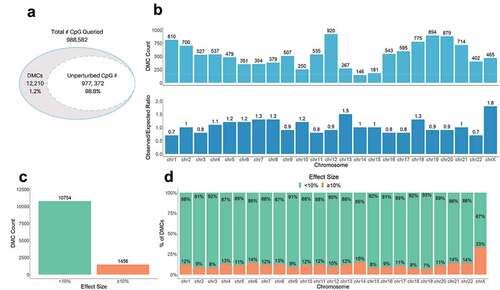
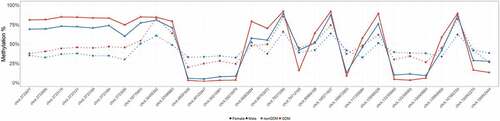
To better characterize methylation changes related to GDM, we categorized GDM-associated DMCs based on the effect size of the change in methylation between GDM and non-GDM samples. We found that ~12% of the DMCs (1,456) exhibited a substantial difference in DNA methylation, ≥10% (). These larger ≥10% changes were distributed across all chromosomes, with chr X exhibiting the greatest number and proportion of the ≥10% changes (compared to autosomes, p-value = 7.2e-35) (). An assessment of the large effect size DMCs (>20%) on chr X confirmed that although the overall methylation status differed between males and females [Citation61,Citation62], the extent and direction of change caused by GDM were similar for both sexes ().
Figure 3. Sex-specific methylation levels of GDM-related large effect size DMCs (>20%) on chr X. Percent methylation at DMCs with effect sizes >20% on chr X. Mean % methylation shown for GDM vs nonGDM samples (red vs blue) stratified by sex (circle vs triangle). DMCs shown are not consecutive or drawn to scaled distance.
To test for consistency in the directionality of GDM-related placental DNA methylation changes (indicative of a common mechanism of perturbation such as global hyper or hypomethylation), we assessed whether DMCs represent a gain (GOM) or loss of methylation (LOM). We detected a similar proportion of total GOM and LOM GDM-associated DMCs across the genome (Supplemental Figure S3a). However, the proportion of GOM and LOM differed by the extent of methylation change (with changes ≥10% more likely to be GOM, p-value = 7.81e-26, Supplemental Figure 3A) and chromosomal location (p-value = 1.46e-29, Supplemental Figure S3b).
GDM-associated DMCs are localized predominantly within gene bodies and gene regulatory regions
To investigate the potential functional (e.g., gene expression) relevance of the DMCs identified, we first categorized DMCs by localization in either: (1) intragenic & proximal regulatory (PR) regions including promoter regions (≤1kb upstream or ≤100 bp downstream of the promoter-transcription start site, TSS) and transcription termination regions (≤100 bp upstream or ≤1kb downstream of the transcription termination site, TTS); or (2) intergenic regions (≥1kb upstream of the TSS or downstream of the TTS). Approximately 73% of DMCs were located in the defined intragenic & PR regions, ~53% of which were intronic (). Compared to the queried CpGs, which were already enriched for intragenic & PR regions (~81%), the GDM-associated DMCs were annotated to a significantly lower proportion of intragenic & PR regions (73%) (p-value = 9.2e-97).
Figure 4. Genic location of DMCs. (a) Proportion of DMCs localized to each genic region shown. (b) Proportion of DMCs localized to each genic region separated by effect size <10% vs. ≥10%.
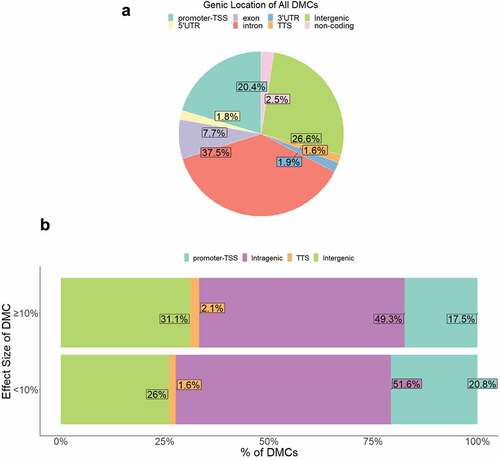
We then examined whether effect sizes of GDM-related DMCs differed by genic location to assess whether specific gene regulatory regions exhibited more or less perturbation. Genic location of DMCs varied by effect size such that medium-to-large effect size DMCs (≥10% change in methylation) occurred less frequently at intragenic & PR regions (~69%) compared to small effect size (<10%) DMCs (~74%) (p = 5.0 x10⁻⁵) (). The directionality of methylation change was similar between genic locations (Supplemental Figure S3c).
Of the 12,210 GDM-related DMCs, 4,942 were annotated to ORegAnno transcription factor-binding sites and regulatory regions. Supplemental Table S2 lists the top 10 transcription factors that DMCs are localized to, with ~50% (2,490) localized to EGR1, SMARCA4, or RBL2 binding sites.
Placental DNA methylation profiles cluster by GDM status
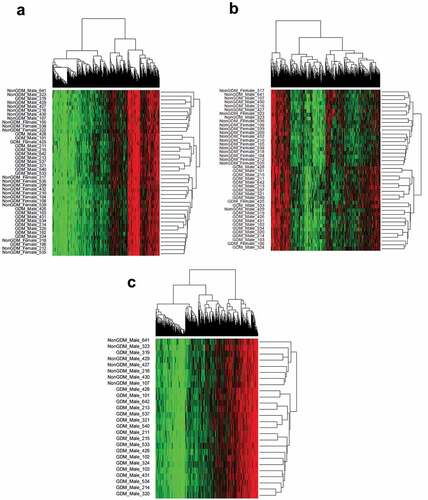
To evaluate whether the combined methylation status (methylome) at GDM-related DMCs forms a consistent methylation profile of GDM disease status, we conducted unsupervised hierarchical clustering analyses of the DMCs. Considering all 42 male and female samples and all DMCs regardless of effect size, there was no distinction between GDM and non-GDM samples (). This finding is not surprising considering that this method does not account for confounding variables that may contribute to small and inconsistent methylation changes among the samples. However, the hierarchical clustering of all samples utilizing only DMCs with ≥10% methylation changes (n = 1,456) did show a distinct grouping by disease status (). Thus, DMCs ≥10% represent a more reproducible measure of GDM effects on the placental methylome. When the male samples alone were analysed for all 12,210 DMCs regardless of effect size, placental methylation profiles clustered by GDM status (). These data demonstrate that male GDM placentas exhibit a distinct methylome at DMC loci that differs from non-GDM samples. In contrast, females did not exhibit similar clustering for all 12,210 DMCs (Supplemental Figure S4), possibly due to the small sample size (n = 2) of the GDM female group.
Figure 5. Sample methylation profiles at GDM-related DMCs using hierarchical clustering. (a) Hierarchical clustering of DMCs (n = 12,210) in all samples (n = 42); (b) Hierarchical clustering of DMCs with ≥10% effect size (n = 1,456) in all samples (n = 42); (c) Hierarchical clustering of DMCs (n = 12,210) in male samples (n = 26).
Placental development genes are epigenetically perturbed in S1000 GDM placentas
To investigate whether GDM-induced methylation changes are enriched in gene pathways important for placental development, we defined the gene ontology categories for genes with proximity to DMCs. Of the 12,210 DMCs, 8,962 annotated to 3,875 unique genes. Using the PANTHER gene ontology consortium, we identified 3,278 DMC-associated genes (DMCs in the gene body or within 1 kb upstream of the TSS). The top 5 pathways were Wnt signalling, cadherin signalling, gonadotropin-releasing hormone receptor, heterotrimeric G-protein signalling, and angiogenesis pathways (Supplemental File S1). Using statistical overrepresentation analysis in PANTHER, we identified significant enrichment for pathways involved in cadherin signalling, Wnt signalling, metabotropic glutamate receptor group III, ionotropic glutamate receptor, and heterotrimeric G-protein signalling pathway-Gi alpha and Gs alpha mediated (). Cadherin signalling and Wnt signalling pathways remained significant when the analysis was performed with DMCs of effect size ≥10% (Supplemental Table S3).
Table 2. Overrepresented PANTER pathways associated with DMCs.
Placental genes that regulate hormone signalling, growth, and energy metabolism exhibit GDM-related regional changes in DNA methylation that may serve as candidate biomarkers of placental injury
To identify epigenetically altered genes most likely to play a role in placenta development and thus serve as candidate epigenetic markers of GDM-related placental injury, we used sequential ranking criteria to define placental development genes with the most evidence for epigenetic dysregulation. First, 62 genes were selected based on the criteria of genes with at least three DMCs (at least 1 with ≥10% effect size) and known role(s) in mouse placental or embryonic development (Supplemental File S2). Next, the top 14 GDM biomarker candidates were selected based on previous evidence of perturbation of placental methylation or expression (). These genes have known or predicted roles in growth, morphogenesis, and vascularization (FGF18 [Citation63], ESX1 [Citation64], WNT2 [Citation65], and SMOC2 [Citation66]); cell proliferation and differentiation (NTN1 [Citation67] and GATA4 [Citation68]); adipogenesis and energy metabolism (EBF1 [Citation69], PPARGC1A [Citation70], and PDXK [Citation71]); genome organization (HIST1H3E [Citation72]); insulin regulation (PTPRN2 [Citation73], ADORA2B [Citation74], and IRS1 [Citation75]); and hormone signalling (MKRN3 [Citation76]).
Table 3. Summary of 14 candidate genes.
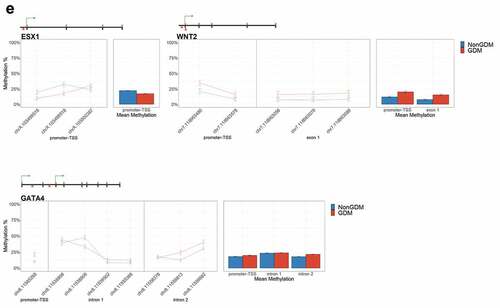
For each candidate gene, we assessed the regional change in methylation across consecutive CpGs to identify significantly differentially methylated regions (DMRs) between GDM and non-GDM samples. We identified 28 GDM-related DMRs at 11 candidate genes (, Supplemental File S3). PDXK, HIST1H3E, and SMOC2 exhibited increased promoter methylation for GDM placentas (). In contrast, PPARGC1A and MRKN3 exhibited decreased promoter methylation for GDM placentas (). Several other genes exhibited altered methylation within the gene body in GDM placentas. ADORA2B, IRS1, and NTN1 all exhibited increased methylation in GDM samples for at least one exonic DMR (). EBF1 and FGF18 exhibited increased methylation and PTPRN2 exhibited decreased methylation in GDM samples at intronic DMRs (). Despite the identification of several consecutive DMCs associated with GATA4, ESX1, and WNT2, the mean combined CpG methylation for these genes was not significantly different (, Supplemental File S3). For ESX1 and GATA4, this was likely caused by differences in the directionality of DMCs across the region. This finding does not reduce the importance of these DMCs nor the potential impact on related genes, but instead indicates that the molecular targets at these genes, for the purpose of biomarkers, will need to be CpG specific as opposed to regional.
Figure 6. DMRs at eleven candidate genes of GDM-related placental injury. Line graphs show mean sample DNA methylation levels (± standard error of the mean, SEM) across consecutive DMCs for GDM (red) vs non-GDM (blue) samples (N = 42 total). Bar graphs show mean CpG methylation (± SEM) across the individual genic regions shown in the line graph for GDM vs. non-GDM samples. (a) Genes with higher regional promoter methylation levels in GDM samples: PDXK, SMOC2, and HIST1H3E; (b) Genes with lower regional promoter methylation levels in GDM samples: PPARGC1A and MKRN3; (c) Genes with higher regional exonic methylation in GDM samples: ADORA2B, IRS1, NTN1; (d) Genes with altered regional intronic methylation in GDM samples: EBF1, FGF18, PTPRN2; (e) Genes with altered consecutive DMCs but no significant mean regional change: ESX1, WNT2, GATA4. Asterisks indicate FDR<0.05 after correction by BH method.
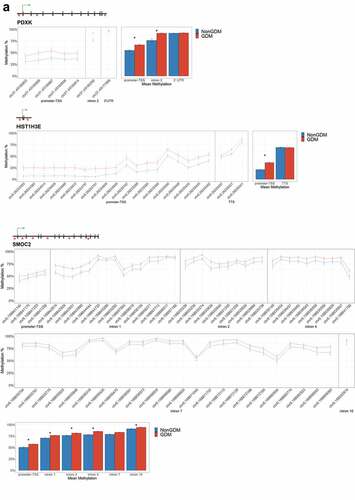
Figure 6. (Continued).
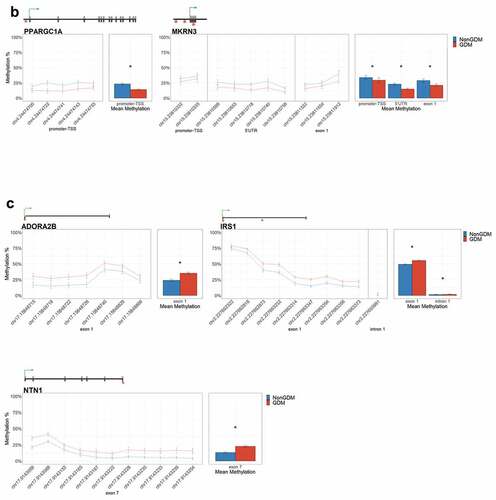
Figure 6. (Continued).
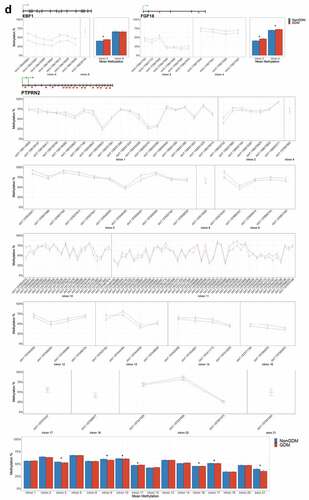
Figure 6. (Continued).
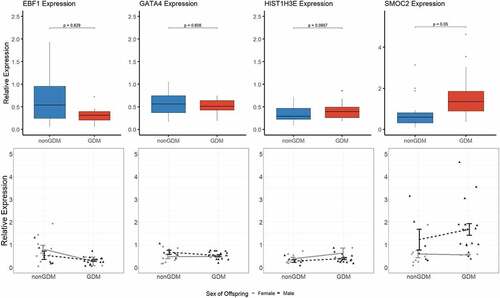
Due to limited sample availability, we were unable to detect expression changes in the S1000 term placenta samples at all the candidate epigenetic biomarkers of GDM-related placental injury. Transcript levels were measured at four candidate genes (EBF1, GATA4, HIST1H3E, and SMOC2) selected based on reproducible detectable transcript levels in the S1000 full-term placentas. After adjustment for maternal age, maternal BMI, sex of offspring, and gestational age, SMOC2 exhibited the most promising difference in expression between GDM and non-GDM samples (p = 0.050) (). However, none of the changes were statistically significant ().
Figure 7. Candidate gene expression levels. Top panels show boxplots of the relative expression levels of four selected candidate genes, EBF1, GATA4, HIST1H3E, and SMOC2. P-values calculated by linear regression analyses with adjustment for maternal age, maternal BMI, sex of offspring, and gestational age. Bottom panels show individual methylation levels for each male (triangle) or female (circle) placenta sample (N = 36 total) and the line shows the difference in mean methylation (± SEM) of male (black line) GDM vs nonGDM samples (± SEM) or female (grey line) GDM vs non-GDM samples.
Discussion
Our study shows that GDM is associated with genome-wide perturbation of the term placental methylation. DNA methylation profiles formed by 12,210 DMCs were sufficient to cluster samples by disease status. Almost two-thirds of these epimutations were located within a gene body or proximal regulatory region (e.g., promoter) with enrichment at placental development genes, including those involved in Wnt and cadherin pathways. We identified and characterized GDM-related epigenetic changes at 11 genes that could serve as candidate biomarkers of placental injury. These findings further our understanding of the role of GDM in placental development while also providing a novel assessment of the effects in a South African population, a historically underrepresented and understudied African population.
This is the first study to examine the effects of GDM on placental epigenetic mechanisms in pregnancies from an African population. In addition, a major strength of this study was our use of bisulfite sequencing to assess the effects of GDM on the human placental methylome. Prior studies have assessed similar effects in populations from Canada [Citation77–80], United States of America [Citation81,Citation82], United Kingdom [Citation83], and China [Citation84,Citation85]. However, these previous studies utilized genome-wide methods that are either limited in genome coverage cannot assess regional changes, or are limited to restriction enzyme sites. Findings from this current study provide a unique opportunity to characterize the impact of GDM more thoroughly across the placental methylome while elucidating its effect on a genetically and geographically different population. In addition, another strength of this study is that we included a similar proportion of non-obese and obese in the non-GDM and GDM groups to minimize the effect of obesity alone while also adjusting for maternal BMI in our regression analysis.
GDM placentas exhibited a change in DNA methylation enriched at genic regions. Of 12,210 DMCs identified, ~73% were located either in intragenic regions or within 1kb of the TSS (promoter) or TTS. Although DNA methylation is present across the genome in both inter- and intra-genic regions, methylation changes within regulatory regions such as the promoter or gene body are often associated with altered transcription and subsequent protein levels [Citation86–88]. As is common for term placentas [Citation89], a limitation of our study is that we were unable to assess genome-wide placental transcription due to poor RNA integrity in a majority of samples. Targeted transcriptional assessment of four candidate genes with DMRs (EBF1, GATA4, HIST1H3E, and SMOC2) did not reveal significant changes in transcript levels. The GDM-related DNA methylation changes identified in S1000 term placentas may represent residual signatures of transcriptional activity during earlier stages of development and not the current transcriptional state [Citation90]. Alternatively, these epigenetic perturbations alone may not be sufficient to dysregulate gene expression. Future work to assess GDM-related transcriptional changes at all of the candidate genes, with a larger set of samples and if possible at earlier developmental stages will help address this question.
The lack of detection of transcriptional dysregulation of epigenetically altered genes in GDM placentas does not negate the importance of DNA methylation changes as biomarkers of GDM. Instead, it supports the putative value of DNA methylation as a more stable and consistent marker of molecular injury across the developmental span. We found that DNA methylation profiles of the 42 placentas were sufficient to drive distinct clustering by maternal GDM disease status. When the methylation profile was built using DMCs with the ≥10% DNA methylation changes, male and female samples clustered by disease status. However, when smaller effect size changes (<10%) were also included in the methylation profile, only male samples clustered by disease status. This suggests that larger changes in DNA methylation (≥10%) are more consistent changes in GDM pregnancy, regardless of foetal gender, and these may more effectively predict disease status across samples and potentially across populations. The stronger clustering of male samples likely reflects the overrepresentation of male GDM samples in the dataset. A meta-analysis reported an increased risk of developing GDM in women carrying a male foetus[Citation91]. However, the evidence is limited, with no mechanisms of action suggested to explain this potential relationship. The literature does report more consistently that male offspring from GDM pregnancies are at increased risk of negative perinatal outcomes [Citation92,Citation93]. However, this study was limited in its ability to address the sex effects of GDM due to the small sample size and underrepresentation of female GDM samples. If there are sex-specific effects, our bias in a greater number of male samples in case and control groups means our outcomes are likely enriched for effects on the male foetus.
This is the first study to report GDM-related changes in placental methylation at developmental genes involved in Wnt and cadherin signalling pathways. These pathways play key roles in embryogenesis, and Wnt signalling is necessary for placentation [Citation94]. WNT2 knockout models showed this gene is key to activating the Wnt signalling pathway in trophoblast cells to promote cell proliferation and migration and proper vascularization of the placenta [Citation65,Citation95]. The role of Wnt signalling in placental development and growth may have implications for neonatal outcomes as larger placentas are associated with foetal overgrowth [Citation96]. The overrepresentation of these two pathways in analyses of genes adjacent to small (>10%) and larger (≥10%) effect size methylation changes has important implications for both placental and foetal development. Assessment of these changes with gene function and developmental phenotypes in a larger cohort will likely yield valuable insight into the mechanism by which GDM impairs placental and foetal development.
It is important to note that this study only reflects changes at a single time point in gestation (birth) and did not measure variation in the placental DNA methylation profile across gestation, as has been previously described [Citation97]. Therefore, transient changes in DNA methylation would not be detected using our study design. In order to address this limitation, we adjusted for variation in gestational age at birth to reduce confounding by this variable. As reported by Novakovic et al. (2011), the inter-individual methylation variation in full-term placentas is driven by environmental factors like GDM status. Thus, the placental DNA methylation patterns at birth likely reflect, in part, an accumulation of adaptations in response to the GDM environment across gestation.
In addition to developmental pathway analyses, we characterized GDM effects at 14 candidate genes and defined consistent regional DNA methylation changes in the promoter/gene body of 11 of these genes. We propose that these DMRs may serve as both mechanistic targets and as valuable epigenetic biomarkers of GDM-associated placental molecular injury that could be developed into early detection markers of adverse outcomes of GDM pregnancies. For example, GDM-DMRs at insulin regulatory genes (IRS1, ADORA2B, and PTPRN2) are indicative of impaired insulin signalling in GDM placentas. Impaired insulin signalling is proposed to be a common signature of GDM. Multiple GWAS studies show that maternal polymorphisms in IRS1 (a key protein involved in insulin signalling) are associated with predisposition to GDM [Citation98–101]. Work in human fetoplacental endothelial cells showed that insulin is required to activate the IRS1/Pi3K/Akt pathway, a necessary step for increased angiogenesis during placentation [Citation102]. ADORA2B has also been implicated in impaired placenta development and pre-eclampsia [Citation103,Citation104], and studies show increased ADORA2B expression in maternal leukocytes from GDM pregnancies [Citation105].
This study identified relevant epigenetic perturbation at important placental development genes in placentas from lean and obese GDM pregnancies. Identification of these changes is an essential step towards understanding how the GDM environment during pregnancy affects foetal development and long-term offspring outcomes. It is also a critical step towards developing effective biomarkers for diagnoses and intervention testing. However, we only focused on DNA methylation and were likely underpowered with N = 42 to detect all potential epigenetic changes related to GDM. Further studies to integrate the role of variables such as sex, ethnicity, and genetic ancestry are necessary to elucidate interindividual differences in these outcomes. Therefore, this is only a partial survey of the impact of GDM on epigenetic regulation of the placenta. Future work is necessary to complete our understanding.
Author contributions
We declare that this study was conceptualized by FI, LA, and SN, with input on study design from LM, RG, CB, & CJ. Cohort recruitment and management, sample collection, and selection supervised by SN. Sample preparation was performed by FI, JX, & LM. Data analyses were performed by LM & RG under the supervision of FI, CB, & CJ with input from JX. The manuscript was drafted and revised by LM & FI with input from all authors. All authors have seen and approved the final version of the manuscript.
Ethics approval and consent to participate
The work reported here was conducted following The Code of Ethics of the World Medical Association, approved by the Human Research Ethics Committee (Medical) at the University of the Witwatersrand, and reviewed and cleared by the Office of Human Research Ethics at the University of North Carolina at Chapel Hill. Informed consent was obtained from all individual participants included in the study.
Supplemental Material
Download Zip (432.5 KB)Acknowledgments
We thank the Soweto First 1000 Days Study participants; Yusuf Guman and the MRC/Wits Developmental Pathways for Health Research Unit research staff for acquiring the placental samples and data; the Genomics Laboratory at the David H. Murdock Research Institute (DHMRI) for sequencing data; Edward Pietryk, Talia Kieu and Gabriella Gentile for technical assistance.
Disclosure statement
No potential conflict of interest was reported by the author(s).
Data availability statement
The datasets used during the study are currently available from the corresponding authors on reasonable requests. Data will be available within 6 months of the paper acceptance date at GEO through NCBI.
Supplementary material
Supplemental data for this article can be accessed online at https://doi.org/10.1080/15592294.2022.2111751
Additional information
Funding
Related Research Data
References
- Wang H, Li N, Chivese T, et al. IDF diabetes atlas: estimation of global and regional gestational diabetes mellitus prevalence for 2021 by international association of diabetes in pregnancy study group’s criteria. Diabetes Res Clin Pract. 2022;183:109050.
- Macaulay S, Ngobeni M, Dunger DB, et al. The prevalence of gestational diabetes mellitus amongst black South African women is a public health concern. Diabetes Res Clin Pract. 2018;139:278–287.
- World Health Organization. Diagnostic criteria and classification of hyperglycaemia first detected in pregnancy. [Internet]. Geneva: WHO; 2013 [cited 2018 Oct 24]. Available from: http://apps.who.int/iris/bitstream/handle/10665/85975/WHO_NMH_MND_13.2_eng.pdf;jsessionid=482C64E8D85B20FBDBEDC0014C353B6F?sequence=1
- Buchanan TA, Xiang A, Kjos SL, et al. What is gestational diabetes? Diabetes Care. 2007;30(2):S105–11.
- Plows JF, Stanley JL, Baker PN, et al. The pathophysiology of gestational diabetes mellitus. Int J Mol Sci. 2018;19(11):3342.
- Homko C, Sivan E, Chen X, et al. Insulin secretion during and after pregnancy in patients with gestational diabetes mellitus. J Clin Endocrinol Metab. 2001;86(2):568–573.
- Lavery JA, Friedman AM, Keyes KM, et al. Gestational diabetes in the United States: temporal changes in prevalence rates between 1979 and 2010. Bjog. 2017;124(5):804–813.
- Al-Rubeaan K, Al-Manaa HA, Khoja TA, et al. A community-based survey for different abnormal glucose metabolism among pregnant women in a random household study (Saudi-DM). BMJ Open. 2014;4(8):e005906.
- Laine MK, Kautiainen H, Gissler M, et al. Gestational diabetes in primiparous women-impact of age and adiposity: a register-based cohort study. Acta Obstet Gynecol Scand. 2018;97(2):187–194.
- Moosazadeh M, Asemi Z, Lankarani KB, et al. Family history of diabetes and the risk of gestational diabetes mellitus in Iran: a systematic review and meta-analysis. Diabetes Metab Syndr. 2017;11 Suppl 1:S99–104.
- Ferrara A. Increasing prevalence of gestational diabetes mellitus: a public health perspective. Diabetes Care. 2007;30(2):S141–6.
- Girgis CM, Gunton JE, Cheung NW. The influence of ethnicity on the development of type 2 diabetes mellitus in women with gestational diabetes: a prospective study and review of the literature. ISRN Endocrinol. 2012;2012:341638.
- Billionnet C, Mitanchez D, Weill A, et al. Gestational diabetes and adverse perinatal outcomes from 716,152 births in France in 2012. Diabetologia. 2017;60(4):636–644.
- Cheng G, Sha T, Gao X, et al. The associations between the duration of folic acid supplementation, gestational diabetes mellitus, and adverse birth outcomes based on a birth cohort. Int J Environ Res Public Health. 2019;16(22):4511.
- Jensen DM, Damm P, Sørensen B, et al. Proposed diagnostic thresholds for gestational diabetes mellitus according to a 75-g oral glucose tolerance test. Maternal and perinatal outcomes in 3260 Danish women. Diabet Med. 2003;20(1):51–57.
- Lee H, Jang HC, Park HK, et al. Early manifestation of cardiovascular disease risk factors in offspring of mothers with previous history of gestational diabetes mellitus. Diabetes Res Clin Pract. 2007;78(2):238–245.
- Lowe WL, Scholtens DM, Kuang A, et al. Hyperglycemia and adverse pregnancy outcome follow-up study (HAPO FUS): maternal gestational diabetes mellitus and childhood glucose metabolism. Diabetes Care. 2019;42. 372–380.
- Curhan GC, Willett WC, Rimm EB, et al. Birth weight and adult hypertension, diabetes mellitus, and obesity in US men. Circulation. 1996;94(12):3246–3250.
- Moore TR. Fetal exposure to gestational diabetes contributes to subsequent adult metabolic syndrome. Am J Obstet Gynecol. 2010;202(6):643–649.
- Clausen TD, Mathiesen ER, Hansen T, et al. High prevalence of type 2 diabetes and pre-diabetes in adult offspring of women with gestational diabetes mellitus or type 1 diabetes: the role of intrauterine hyperglycemia. Diabetes Care. 2008;31(2):340–346.
- Edu A, Teodorescu C, Dobjanschi CG, et al. Placenta changes in pregnancy with gestational diabetes. Rom J Morphol Embryol. 2016;57(2):507–512.
- Dalfrà MG, Burlina S, Del Vescovo GG, et al. Genetics and epigenetics: new insight on gestational diabetes mellitus. Front Endocrinol (Lausanne). 2020;11:602477.
- Donnelly L, Campling G. Functions of the placenta. Anaesth Intensive Care Med. 2016;17(7):349–353.
- Burton GJ, Yung HW, Murray AJ. Mitochondrial - endoplasmic reticulum interactions in the trophoblast: stress and senescence. Placenta. 2017;52:146–155.
- Daskalakis G, Marinopoulos S, Krielesi V, et al. Placental pathology in women with gestational diabetes. Acta Obstet Gynecol Scand. 2008;87(4):403–407.
- Gauster M, Desoye G, Tötsch M, et al. The placenta and gestational diabetes mellitus. Curr Diab Rep. 2012;12(1):16–23.
- Leybovitz-Haleluya N, Wainstock T, Landau D, et al. Maternal gestational diabetes mellitus and the risk of subsequent pediatric cardiovascular diseases of the offspring: a population-based cohort study with up to 18 years of follow up. Acta Diabetol. 2018;55(10):1037–1042.
- Jönsson J, Renault KM, García-Calzón S, et al. Lifestyle intervention in pregnant women with obesity impacts cord blood DNA methylation, which associates with body composition in the offspring. Diabetes. 2021;70(4):854–866.
- Vaiman D. Genes, epigenetics and miRNA regulation in the placenta. Placenta. 2017;52:127–133.
- Jin B, Li Y, Robertson KD. DNA methylation: superior or subordinate in the epigenetic hierarchy? Genes Cancer. 2011;2(6):607–617.
- Lim DHK, Maher ER. DNA methylation: a form of epigenetic control of gene expression. Obstet Gynaecol. 2010;12(1):37–42
- Hamada H, Okae H, Toh H, et al. allele-specific methylome and transcriptome analysis reveals widespread imprinting in the human placenta. Am J Hum Genet. 2016;99(5):1045–1058.
- Serman L, Vlahović M, Sijan M, et al. The impact of 5-azacytidine on placental weight, glycoprotein pattern and proliferating cell nuclear antigen expression in rat placenta. Placenta. 2007;28(8–9):803–811.
- Rahnama F, Shafiei F, Gluckman PD, et al. Epigenetic regulation of human trophoblastic cell migration and invasion. Endocrinology. 2006;147(11):5275–5283
- Bouchard L, Thibault S, Guay S-P, et al. Leptin gene epigenetic adaptation to impaired glucose metabolism during pregnancy. Diabetes Care. 2010;33(11):2436–2441.
- Bouchard L, Hivert M-F, Guay S-P, et al. Placental adiponectin gene DNA methylation levels are associated with mothers’ blood glucose concentration. Diabetes. 2012;61(5):1272–1280.
- Holdsworth-Carson SJ, Lim R, Mitton A, et al. Peroxisome proliferator-activated receptors are altered in pathologies of the human placenta: gestational diabetes mellitus, intrauterine growth restriction and preeclampsia. Placenta. 2010;31(3):222–229.
- Houde AA, St-Pierre J, Hivert MF, et al. Placental lipoprotein lipase DNA methylation levels are associated with gestational diabetes mellitus and maternal and cord blood lipid profiles. J Dev Orig Health Dis. 2014;5(2):132–141.
- Roberts JM, Escudero C. The placenta in preeclampsia. Pregnancy Hypertens. 2012;2(2):72–83.
- Catalano PM. Trying to understand gestational diabetes. Diabet Med. 2014;31(3):273–281.
- Macaulay S, Munthali RJ, Dunger DB, et al. The effects of gestational diabetes mellitus on fetal growth and neonatal birth measures in an African cohort. Diabet Med. 2018;35(10):1425–1433.
- Kennedy SH, Victora CG, Craik R, et al. Deep clinical and biological phenotyping of the preterm birth and small for gestational age syndromes: the INTERBIO-21 st newborn case-control study protocol. [version 2; peer review: 2 approved]. Gates Open Res. 2018; 2: 49.
- Bartolomei MS, Webber AL, Brunkow ME, et al. Epigenetic mechanisms underlying the imprinting of the mouse H19 gene. Genes Dev. 1993;7(9):1663–1673.
- Bolger AM, Lohse M, Usadel B. Trimmomatic: a flexible trimmer for Illumina sequence data. Bioinformatics. 2014;30(15):2114–2120.
- Krueger F, Andrews SR. Bismark: a flexible aligner and methylation caller for bisulfite-seq applications. Bioinformatics. 2011;27(11):1571–1572.
- Langmead B, Salzberg SL. Fast gapped-read alignment with Bowtie 2. Nat Methods. 2012;9(4):357–359.
- Xue J, Gharaibeh RZ, Pietryk EW, et al. Impact of vitamin D depletion during development on mouse sperm DNA methylation. Epigenetics. 2018;13(9):959–974.
- ENCODE Project Consortium. An integrated encyclopedia of DNA elements in the human genome. Nature. 2012;489(7414):57–74.
- Akalin A, Kormaksson M, Li S, et al. methylKit: a comprehensive R package for the analysis of genome-wide DNA methylation profiles. Genome Biol. 2012;13(10):R87
- R Core Team. R: a language and environment for statistical computing. Vienna Austria: R Foundation for Statistical Computing; 2021.
- Heinz S, Benner C, Spann N, et al. Simple combinations of lineage-determining transcription factors prime cis-regulatory elements required for macrophage and B cell identities. Mol Cell. 2010;38(4):576–589
- Mi H, Thomas P. PANTHER pathway: an ontology-based pathway database coupled with data analysis tools. Methods Mol Biol. 2009;563:123–140.
- Mi H, Ebert D, Muruganujan A, et al. PANTHER version 16: a revised family classification, tree-based classification tool, enhancer regions and extensive API. Nucleic Acids Res. 2021;49(D1):D394–403.
- Quinlan AR, Hall IM. BEDTools: a flexible suite of utilities for comparing genomic features. Bioinformatics. 2010;26(6):841–842.
- Warnes GR, Bolker B, Bonebakker L, et al., Package ‘gplots’: various r programming tools for plotting data. R Pkg. 2016;
- Wickham H. ggplot2: elegant graphics for data analysis (use R!). 2nd ed. Cham: Springer; 2016.
- Neuwirth E. RColorBrewer: colorBrewer palettes. R package; 2014.
- Benjamini Y, Hochberg Y. Controlling the false discovery rate: a practical and powerful approach to multiple testing. J R Stat Soc: Series B (Methodol). 1995;57:289–300.
- Meyrueix L, Adair L, Norris SA, et al. Assessment of placental metal levels in a South African cohort. Environ Monit Assess. 2019;191(8):500.
- Reichetzeder C, Dwi Putra SE, Pfab T, et al. Increased global placental DNA methylation levels are associated with gestational diabetes. Clin Epigenetics. 2016;8(1):82.
- Gong S, Johnson MD, Dopierala J, et al. Genome-wide oxidative bisulfite sequencing identifies sex-specific methylation differences in the human placenta. Epigenetics. 2018;13(3):228–239.
- Cotton AM, Avila L, Penaherrera MS, et al. Inactive X chromosome-specific reduction in placental DNA methylation. Hum Mol Genet. 2009;18(19):3544–3552.
- Liu Z, Lavine KJ, Hung IH, et al. FGF18 is required for early chondrocyte proliferation, hypertrophy and vascular invasion of the growth plate. Dev Biol. 2007;302(1):80–91.
- Singh U, Fohn LE, Wakayama T, et al. Different molecular mechanisms underlie placental overgrowth phenotypes caused by interspecies hybridization, cloning, and Esx1 mutation. Dev Dyn. 2004;230(1):149–164.
- Li N, Li S, Wang Y, et al. Decreased expression of WNT2 in villi of unexplained recurrent spontaneous abortion patients may cause trophoblast cell dysfunction via downregulated Wnt/β-catenin signaling pathway. Cell Biol Int. 2017;41(8):898–907.
- Liu P, Lu J, Cardoso WV, et al. The SPARC-related factor SMOC-2 promotes growth factor-induced cyclin D1 expression and DNA synthesis via integrin-linked kinase. Mol Biol Cell. 2008;19(1):248–261.
- Yin K, Shang M, Dang S, et al. Netrin‑1 induces the proliferation of gastric cancer cells via the ERK/MAPK signaling pathway and FAK activation. Oncol Rep. 2018;40(4):2325–2333.
- Carrasco M, Delgado I, Soria B, et al. GATA4 and GATA6 control mouse pancreas organogenesis. J Clin Invest. 2012;122(10):3504–3515.
- Hesslein DGT, Fretz JA, Xi Y, et al. Ebf1-dependent control of the osteoblast and adipocyte lineages. Bone. 2009;44(4):537–546.
- St-Pierre J, Drori S, Uldry M, et al. Suppression of reactive oxygen species and neurodegeneration by the PGC-1 transcriptional coactivators. Cell. 2006;127(2):397–408.
- Moreno-Navarrete JM, Jove M, Ortega F, et al. Metabolomics uncovers the role of adipose tissue PDXK in adipogenesis and systemic insulin sensitivity. Diabetologia. 2016;59(4):822–832.
- Tagami H, Ray-Gallet D, Almouzni G, et al. Histone H3.1 and H3.3 complexes mediate nucleosome assembly pathways dependent or independent of DNA synthesis. Cell. 2004;116(1):51–61.
- Cai T, Hirai H, Zhang G, et al. Deletion of Ia-2 and/or Ia-2β in mice decreases insulin secretion by reducing the number of dense core vesicles. Diabetologia. 2011;54(9):2347–2357.
- Figler RA, Wang G, Srinivasan S, et al. Links between insulin resistance, adenosine A2B receptors, and inflammatory markers in mice and humans. Diabetes. 2011;60(2):669–679.
- Gual P, Le Marchand-Brustel Y, Tanti J-F. Positive and negative regulation of insulin signaling through IRS-1 phosphorylation. Biochimie. 2005;87(1):99–109.
- Li C, Han T, Li Q, et al. MKRN3-mediated ubiquitination of Poly(A)-binding proteins modulates the stability and translation of GNRH1 mRNA in mammalian puberty. Nucleic Acids Res. 2021;49(7):3796–3813.
- Hivert M-F, Cardenas A, Allard C, et al. Interplay of placental DNA methylation and maternal insulin sensitivity in pregnancy. Diabetes. 2020;69(3):484–492.
- Ruchat S-M, Houde -A-A, Voisin G, et al. Gestational diabetes mellitus epigenetically affects genes predominantly involved in metabolic diseases. Epigenetics. 2013;8(9):935–943.
- Cardenas A, Gagné-Ouellet V, Allard C, et al. Placental DNA methylation adaptation to maternal glycemic response in pregnancy. Diabetes. 2018;67(8):1673–1683.
- Awamleh Z, Butcher DT, Hanley A, et al. Exposure to gestational diabetes mellitus (GDM) alters DNA methylation in placenta and fetal cord blood. Diabetes Res Clin Pract. 2021;174:108690.
- Alexander J, Teague AM, Chen J, et al. Offspring sex impacts DNA methylation and gene expression in placentae from women with diabetes during pregnancy. PLoS One. 2018;13(2):e0190698.
- Binder AM, LaRocca J, Lesseur C, et al. Epigenome-wide and transcriptome-wide analyses reveal gestational diabetes is associated with alterations in the human leukocyte antigen complex. Clin Epigenetics. 2015;7(1):79.
- Finer S, Mathews C, Lowe R, et al. Maternal gestational diabetes is associated with genome-wide DNA methylation variation in placenta and cord blood of exposed offspring. Hum Mol Genet. 2015;24(11):3021–3029.
- Liu L, Zhang X, Rong C, et al. Distinct DNA methylomes of human placentas between pre-eclampsia and gestational diabetes mellitus. Cell Physiol Biochem. 2014;34(6):1877–1889.
- Rong C, Cui X, Chen J, et al. DNA methylation profiles in placenta and its association with gestational diabetes mellitus. Exp Clin Endocrinol Diabetes. 2015;123(5):282–288.
- Aran D, Toperoff G, Rosenberg M, et al. Replication timing-related and gene body-specific methylation of active human genes. Hum Mol Genet. 2011;20:670–680.
- Ball MP, Li JB, Gao Y, et al. Targeted and genome-scale strategies reveal gene-body methylation signatures in human cells. Nat Biotechnol. 2009;27(4):361–368.
- Anastasiadi D, Esteve-Codina A, Piferrer F. Consistent inverse correlation between DNA methylation of the first intron and gene expression across tissues and species. Epigenetics Chromatin. 2018;11(1):37.
- Reiman M, Laan M, Rull K, et al. Effects of RNA integrity on transcript quantification by total RNA sequencing of clinically collected human placental samples. FASEB J. 2017;31(8):3298–3308.
- Sitras V, Fenton C, Paulssen R, et al. Differences in gene expression between first and third trimester human placenta: a microarray study. PLoS One. 2012;7(3):e33294.
- Jaskolka D, Retnakaran R, Zinman B, et al. Sex of the baby and risk of gestational diabetes mellitus in the mother: a systematic review and meta-analysis. Diabetologia. 2015;58(11):2469–2475.
- Persson M, Fadl H. Perinatal outcome in relation to fetal sex in offspring to mothers with pre-gestational and gestational diabetes–a population-based study. Diabet Med. 2014;31(9):1047–1054.
- Hu J, Ge Z, Xu Q, et al. Influence of fetal sex on perinatal outcomes in women with gestational diabetes mellitus. Diabetes Metab Res Rev. 2020;36(3):e3245.
- Ujita M, Kondoh E, Chigusa Y, et al. Impaired Wnt5a signaling in extravillous trophoblasts: relevance to poor placentation in early gestation and subsequent preeclampsia. Pregnancy Hypertens. 2018;13:225–234.
- Monkley SJ, Delaney SJ, Pennisi DJ, et al. Targeted disruption of the Wnt2 gene results in placentation defects. Development. 1996;122(11):3343–3353.
- Schwartz N, Quant HS, Sammel MD, et al. Macrosomia has its roots in early placental development. Placenta. 2014;35(9):684–690.
- Novakovic B, Yuen RK, Gordon L, et al. Evidence for widespread changes in promoter methylation profile in human placenta in response to increasing gestational age and environmental/stochastic factors. BMC Genomics. 2011;12(1):529.
- Pappa KI, Gazouli M, Economou K, et al. Gestational diabetes mellitus shares polymorphisms of genes associated with insulin resistance and type 2 diabetes in the Greek population. Gynecol Endocrinol. 2011;27(4):267–272.
- Zhang C, Bao W, Rong Y, et al. Genetic variants and the risk of gestational diabetes mellitus: a systematic review. Hum Reprod Update. 2013;19(4):376–390.
- Lowe WL, Scholtens DM, Sandler V, et al. Genetics of gestational diabetes mellitus and maternal metabolism. Curr Diab Rep. 2016;16(2):15.
- Zawiejska A, Wender-Ozegowska E, Bogacz A, et al. An observational study of the risk of neonatal macrosomia, and early gestational diabetes associated with selected candidate genes for type 2 diabetes mellitus polymorphisms in women with gestational diabetes mellitus. Ginekol Pol. 2018;89(12):705–710.
- Lassance L, Miedl H, Absenger M, et al. Hyperinsulinemia stimulates angiogenesis of human fetoplacental endothelial cells: a possible role of insulin in placental hypervascularization in diabetes mellitus. J Clin Endocrinol Metab. 2013;98(9):E1438–47.
- Iriyama T, Wang W, Parchim NF, et al. Reciprocal upregulation of hypoxia-inducible factor-1α and persistently enhanced placental adenosine signaling contribute to the pathogenesis of preeclampsia. FASEB J. 2020;34(3):4041–4054.
- Iriyama T, Sun K, Parchim NF, et al. Elevated placental adenosine signaling contributes to the pathogenesis of preeclampsia. Circulation. 2015;131(8):730–741.
- Wojcik M, Zieleniak A, Mac-Marcjanek K, et al. The elevated gene expression level of the A2B adenosine receptor is associated with hyperglycemia in women with gestational diabetes mellitus. Diabetes Metab Res Rev. 2014;30(1):42–53.