
ABSTRACT
Non-syndromic cleft lip with or without cleft palate (NSCLP), the most common human craniofacial malformation, is a complex disorder given its genetic heterogeneity and multifactorial component revealed by genetic, epidemiological, and epigenetic findings. Epigenetic variations associated with NSCLP have been identified; however, functional investigation has been limited. Here, we combined a reanalysis of NSCLP methylome data with genetic analysis and used both in vitro and in vivo approaches to dissect the functional effects of epigenetic changes. We found a region in mir152 that is frequently hypomethylated in NSCLP cohorts (21–26%), leading to mir152 overexpression. mir152 overexpression in human neural crest cells led to downregulation of spliceosomal, ribosomal, and adherens junction genes. In vivo analysis using zebrafish embryos revealed that mir152 upregulation leads to craniofacial cartilage impairment. Also, we suggest that zebrafish embryonic hypoxia leads to mir152 upregulation combined with mir152 hypomethylation and also analogous palatal alterations. We therefore propose that mir152 hypomethylation, potentially induced by hypoxia in early development, is a novel and frequent predisposing factor to NSCLP.
Introduction
Non-syndromic cleft lip with or without cleft palate (NSCLP) is the most common craniofacial congenital malformation in humans, affecting 1–7 per 1000 live-births worldwide, and follows a multifactorial model of inheritance [Citation1]. Genetic contribution to NSCLP has long been supported by several independent studies, which has shown heritability estimates as high as 78–91% in Asian, European, and Brazilian populations [Citation2–4]. Genomic analyses have successfully revealed several at-risk common genetic variants, in distinct populations. Nevertheless, they confer a small risk and explain 10–30% of the disease’s heritability [Citation5,Citation6]. In addition, an increasing number of rare pathogenic variants have been identified in families segregating NSCLP, although the extent of their contribution in overall NSCLP cases is uncertain. Importantly, no shared prevalent genetic basis has been observed for these variants [Citation7–12], except for mutations in the cadherin/catenin genes, which have been suggested to be responsible for 2–14% of familial NSCLP cases [Citation13]. Given the lack of a common mechanism underlying a large proportion of cases, projections for strategies of prevention and development of predictive diagnostic tests in at-risk couples have been hindered.
In parallel with genetic studies, epidemiological studies have suggested the influence of several environmental factors predisposing to NSCLP [Citation14–20]. In this sense, recent progress on uncovering the epigenetic contribution to NSCLP has been made [Citation21–23]. Epigenetic variations (or epivariations) are dynamic, functional, and heritable covalent changes in DNA and/or chromatin-associated proteins which do not alter DNA sequence, yet they can affect gene expression and contribute to phenotypic variability and disease [Citation24–26]. Also, commonly considered an epigenetic mechanism of gene regulation, microRNAs have been associated with NSCLP by a range of studies mostly involving gene-network analysis in human samples and animal models [Citation27–29]. Association of genomic epivariations to phenotypes, so-called Epigenome-Wide Association Studies (EWAS), has been expanding the knowledge on phenotypic variability and molecular disease mechanisms for the past years [Citation30–33]. More recently, individual-specific methylome analysis has shed light on epigenetic variation relevant to disease, demonstrating how this approach can uncover molecular alteration for complex traits [Citation34]. Here, we identified both group- and individual-specific methylation changes using previously published methylome data on NSCLP. We identified individual methylation changes in known NSCLP candidate regions and also hypomethylation of miRNA mir152 in 26% of our discovery cohort. This result was replicated in an independent cohort and validated through functional in vitro and in vivo assays. Finally, we suggest how hypoxia, a known environmental risk factor for NSCLP, can modulate such changes.
Results
mir152 is a frequent differentially methylated region in a previously published Brazilian NSCLP cohort
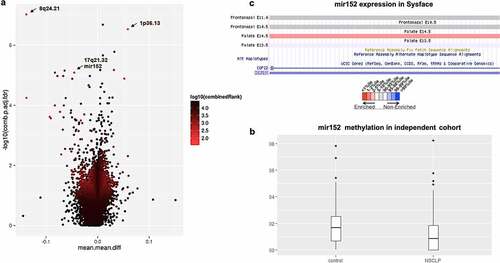
We conducted differential methylation analysis at the gene level based on RnBeads RefSeq annotated regions using the whole Brazilian NSCLP 450 K dataset (66 NSCLP vs 59 controls [Citation21]), and looked for the top five DMRs (differentially methylated regions) ranked by RnBeads, which combines adjusted p-value to mean methylation difference and methylation difference quotient. Additionally, we calculated methylation odds ratio (methOR) for the selected DMRs. The top DMRs were, in order of ranking: 1, an intronic region of CROCC at 1p36.13 (adjusted p-value = 2.96E-07, mean methylation difference = 0.05, methOR = 1.54); 2, an intronic region of FAM49B at 8q24.21 (adjusted p-value = 9.50E-08, mean methylation difference = −0.13, methOR = 1.75); 3, an intronic region of NLK at 17q11.2 (adjusted p-value = 5.66E-05, mean methylation difference = −0.13, methOR = 1.75); 4, a non-coding region comprising mir152 at 17q21.32 (adjusted p-value = 8.20E-06, mean methylation difference = −0.04, methOR = 1.32); and 5, an exonic region of PRAC2 and comprising mir3185 also at 17q21.32 (adjusted p-value = 1.30E-05, mean methylation difference = 0.05, methOR = 1.29) (); Table S1). Among those DMR comprising genes, mir152 was the only one with changes in expression during palatal embryogenesis in humans and mice, according to the Sysface (Systems tool for craniofacial expression-based gene discovery) online tool ()- https://bioinformatics.udel.edu/research/sysface/). Moreover, mir152 has already been identified as a DMR during normal murine palatal development [Citation35] and suggested as a central regulator of downstream mRNAs encoding proteins known to play pivotal roles in orofacial development [Citation36]. However, there is no direct evidence associating mir152 with NSCLP. Concurrently, we also conducted a differential methylation analysis at the gene level by comparing each one of the 66 NSCLP samples individually versus all 59 controls, looking for NSCLP sample-specific epivariations. We found a total of 6620 gene DMRs (average = 100.3 DMRs per sample) in all NSCLP samples with >5% methylation difference and adjusted p-value <0.05 (Table S2). mir152 was the most frequent DMR (n = 17 NSCLP samples; ~26%) with ~6% of average hypomethylation difference (beta-value reduction) in comparison to controls. Furthermore, mir152 was not present in previously published data on common epivariation [Citation34].
Figure 1. mir152 is differentially methylated in NSCLP cohorts. (a) Volcano plot of differentially methylated regions (DMRs) in the 450 K cohort. Light blue spots are the best ranked DMRs by a p-value, methylation difference and quotient of difference by RnBeads. Arrows indicate DMRs at 8q24.21, 1p36.13, and mir152. (b) mir152 is significantly hypomethylated in the BSAS cohort. Boxplots with central lines as medians. p-Value = 0.005 (Mann–Whitney’s test). (c) mir152 expression changes are detected in developing craniofacial structures as revealed at the database Sysface. Higher signals for mir152 expression are detected in developing murine palate (E14.5) in red and also frontonasal prominences E10.5 and E11 (grey).
Validation of mir152 methylation in additional cohorts
To validate the previous findings, we investigated mir152, 8q24.21, and 1p36.13 DMRs in an independent Brazilian cohort of 57 NSCLP samples and 130 control samples (Table S3), using a different method for DNA methylation quantification (bisulfite amplicon sequencing – BSAS). 8q24.21 and 1p36.13 DMRs were included in the validation step as both regions have been associated with NSCLP through GWAS and candidate SNP association studies, including Brazilian population [Citation6,Citation37–39]. We observed no correlation of potential confounding factors (bisulfite conversion batch, PCR batch, age, sex, or origin) with BSAS methylation data; besides, principal component analysis (PCA) did not reveal any evidence of sample stratification which could bias methylation variation in our cohort (Figure S1).
We found no significant methylation differences at either 8q24.21 (mean methylation controls = 0.9792; NSCLP = 0.9725; p = 0.41, Mann–Whitney’s test, methOR = 1) and 1p36.13 (mean methylation controls = 0.1279; NSCLP = 0.1225, p = 0.08, Mann–Whitney’s test, methOR = 1) DMRs in the replication cohort. However, we found that the mean methylation levels at the mir152 DMR (comprising CpGs 3, 4, 5 and 6) were significantly reduced in NSCLP in comparison to controls (mean methylation controls = 0.013, NSCLP = 0.017, p = 0.005, Mann–Whitney’s test, methOR = 1.31; )), corroborating our initial findings on mir152 hypomethylation. We next compared the number of samples harbouring complete hypomethylation (beta-value = 0) to investigate the extent of mir152 hypomethylation in individual samples in this independent cohort. For that, we computed those samples with complete hypomethylation (average beta-values at CpG sites 3, 4, 5, and 6 = 0) (Table S3). Considering the mir152 DMR, the frequency of complete hypomethylation is significantly higher in NSCLP samples (n = 16, 28%) in comparison to controls (n = 17, 13%), which represents an enrichment of 15% of more hypomethylated samples in NSCLP (p = 0.02, Fisher’s exact test) with OR = 2.60. Correlation analysis of methylation levels from all nine mir152 CpGs revealed a hypomethylation trend shared by CpGs 4, 5, 6, and 7 and mild correlation values (Figure S2), which could be indicative of a more cohesive methylation block at those sites. Taken together, our results corroborate mir152 hypomethylation in both NSCLP cohorts.
To evaluate the contribution of mir152 methylation to NSCLP in an additional, independent population, we looked for other available NSCLP methWAS data. Using summary statistics data from an available NSCLP case–control methWAS performed on 182 hispanic and non-hispanic samples (94 NSCLP and 88 controls [Citation22]), we did not find significant differences at the mir152 DMR. However, we found a CpG site at the mir152 promoter hypermethylated in NSCLP in this cohort (cg06598332, p = 0.04), which is located ~200 bp upstream to the mir152 DMR.
Epivariation is not mediated by genetic variation at proximal mir152 region in the independent cohort
Because genetic variation can influence nearby epivariation [Citation40,Citation41], we looked for single nucleotide variants (SNV) within the mir152 DMR. The only polymorphism revealed by Sanger sequencing, rs12940701 (C > T), was present in 30.39% of NSCLP and 41.46% of control samples, with no significant difference between groups (Fisher’s exact test = 0.08). rs12940701 coincides with CpG site 8 at mir152 DMR, which displays low methylation levels in both NSCLP and control samples (NSCLP average beta-value = 0.0178, controls average beta-value = 0.0121). Even though rs12940701 has been suggested as a potential variant diminishing methylation levels at mir152 region [Citation42], we observed no significant genotype vs. methylation correlation in our replication cohort (p = 0.1843, Fig. S2). Also, we found no linkage disequilibrium (LD) between this SNV and rs1838105, an SNV previously associated with NSCLP and located 1.3Mb from rs12940701 at 17q21.32 [Citation6] (Fig. S2). Rare variants (minor allele frequency <0.5%) in the mir152 gene were not analysed in this cohort .
Hypomethylation of the mir152 DMR leads to mir152 overexpression
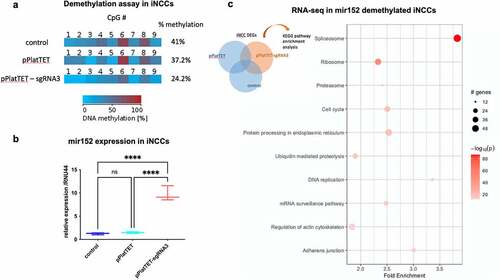
We next verified whether methylation variation within the mir152 DMR interferes with mir152 expression. We carried out a CRISPR-Cas9-based approach for targeted demethylation, in which dCas9 was fused to TET1 (pPlatTET-GFP) in order to demethylate specific genomic targets [Citation43]. Among the three tested sgRNAs targeting the mir152 DMR in both HEK293T and iPSC-derived neural crest cells (iNCCs), sgRNA-3 efficiently reduced methylation levels at mir152 DMR () and S3(a)). In non-transfected conditions, or when transfected with the empty vector (pPlatTET-NC) or sgRNAs-1 and 2, iNCCs do not express mir152 at detectable levels. Consistent with those methylation changes, we observed a marked upregulation of mir152 levels when sgRNA-3 transfections were carried out () and S3(b). Notably, methylation changes at the mir152 region induced by dCas9-TET + sgRNA3 were higher at site 6, which belongs to the mir152 DMR here associated with NSCLP.
Figure 2. DNA methylation changes at mir152 DMRs results in mir152 expression changes and affects Spliceosomal, Ribosomal, and Adherens Junctions pathways. (a) A Cas9-based approach for target demethylation using the vector pPlatTET and mir152 specific single-guide RNA sequences (sgRNA3) for mir152 DMR in iNCC. sgRNA-3 efficiently reduces mir152 methylation in comparison to the empty vector transfection (pPlatTET) and non-transfected cells (control). Total percentage of methylation is represented with values at the right. (b) Targeted mir152 DNA hypomethylation by pPlatTET-sgRNA-3 (modified Cas9 coupled with the catalytic domain of TET1) induces significant mir152 overexpression in induced neural crest cells (iNCCs) revealed by RT-qPCR. Relative expression to endogenous control RNU44. Mann–Whitney’s test. (c) Enriched KEGG pathways found in RNA-seq analysis in mir152 demethylated iNCCs (pPlatTET-sgRNA3), overexpressing mir152. Higher fold enrichments are observed in Spliceosome and Adherens Junctions DEGs.
Importantly, the induced hypomethylation of mir152 does not seem to disturb the expression of its host gene COPZ2 or other neighbouring genes, nor of unrelated miRNAs (Figure S3(c,d). Taken together, the results indicate that epivariation at sites within the mir152 DMR are functional, resulting in mir152 expression changes.
mir152 hypomethylation leads to downregulation of spliceosome, ribosome, and adherens junction genes
We next performed RNAseq on iNCCs to verify the downstream effects of mir152 hypomethylation and overexpression. We found 3265 differentially expressed genes (DEGs) at the level of significance p < 1E-7 which were exclusive to mir152-hypomethylated iNCCs (), Table S4). Pathway analysis revealed a significant enrichment in KEGG terms as Splicesome, Ribosome, and Adherens Junctions among others (), Table S5). Downregulated spliceosome genes comprised 61 genes, including U1-6 subunits, pre-mRNA processing factors (PRPF40A, PRPF3, PRPF4, PRPF6, PRPF8, PRPF19), RNA helicases DHX16, DHX38, and DHX15, and core Exon-Junction Complex (EJC) genes such as EIF4A3 and MAGOH. Also, 41 ribosomal DEGs were found, comprising both ribosomal RNAs and ribosomal proteins (Table S5). Adherens junction genes included a total of 23 DEGs, including alpha and beta catenins (CTNNA1 and CTNNB1, respectively), SMAD3, RHOA and actins ACTB, ACTN4, and ACTG1 (Table S5). Protein–protein interaction analysis revealed a highly connected network among DEGs belonging to Spliceosome, Cell Cycle, Adherens Junctions, Regulation of Actin Cytoskeleton, Protein processing in endoplasmic reticulum, Ubiquitin mediated proteolysis, DNA replication, and mRNA surveillance pathway (Figure S4). Next, we searched in our data for those genes predicted to be mir152 targets according to miRBase and found 172 DEGs (Table S6). To identify putative mir152 targets among our DEGs which could lead to downregulation of genes in the enriched KEGG terms, we performed a subnet analysis using the FANTOM4 database and identified UHRF1 and SMAD3 as potential mir152 targets regulating expression of Spliceosome and Adherens junctions genes (Figure S5).
mir152 mimics results in craniofacial malformations in zebrafish
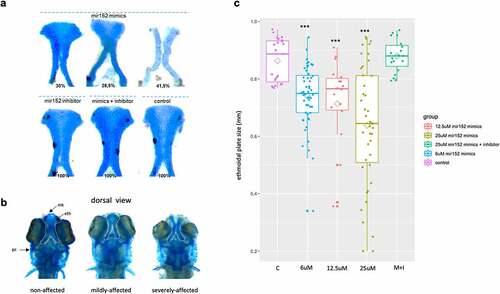
Next, we investigated whether mir152 could influence craniofacial development. We first characterized mir152 gene expression in zebrafish embryos at different developmental stages. In situ hybridization (ISH) analysis confirmed expression of mir152 during neural crest migration and later stages (15 hpf – 72 hpf; Figure S6). We then injected a mir152 inhibitor and/or mimic in one-cell stage zebrafish embryos and observed their development at 5 d post-fertilization (dpf). Injection of mir152 inhibitor did not lead to any visible developmental impairment ()). Conversely, when injected with the mir152 mimic (25 μM), zebrafish embryos showed several craniofacial defects at 5 dpf, including malformation of Meckel’s cartilage, palatoquadrate, ceratobranchial, and the ethmoidal plate, which is often reported as being analogous to the mammalian palate. In total, 70% of the embryos were affected. Those were subclassified as mildly affected (28.5%), comprising those with size and shape defects in the ethmoidal plate, and severely affected (41.5%), characterized by a typical cleft in the ethmoidal plate () and S7). In contrast, co-injection of both the mir152 mimic and inhibitor led to non-affected embryos (n = 65). To further investigate subtle phenotypes and to test the dosage effect of mir152 mimic, we measured ethmoidal plates’ sizes in additional 150 zebrafish larvae which were injected with increasing doses of mir152 mimic (6 μM, n = 50; 12.5 μM, n = 17; and 25 μM, n = 41). We observed a dose-dependent effect of mir152 mimic on ethmoidal plates’ sizes when compared to controls (n = 23), in which higher concentrations of mir152 mimics (25 μM) resulted in more larvae with smaller ethmoidal plates ()). 25 μM mir152 mimics + inhibitor (n = 19) injections were also able to rescue ethmoidal plate size, which showed no differences compared to controls ()). Mild and severe phenotypes were also observed in the dosage effect test of mir152 mimic, with higher fractions of mildly and severely affected ethmoidal plates at 25 μM mir152 mimic, replicating the previous observations (Figure S7). Non-ethmoidal plate defects were also observed, especially involving the Meckel’s and ceratobranchial cartilages (Table S7). Finally, RT-qPCR assays on five hpf embryos injected with the mir152 mimic, inhibitor, or mimic+inhibitor revealed variable tp53 expression across conditions, with little differences (up to 1.6-fold) in comparison to controls [Citation44], indicating that tp53-related microinjection-induced apoptosis may not overtly contribute to the observed mir152 phenotypes (Figure S8). We did not analyse however other apoptotic markers in this assay.
Figure 3. Mir152 mimics injected in zebrafish embryos causes ethmoidal plate defects analogue to clefts. (a) ethmoidal plates dissected from 5 dpf zebrafish larvae injected with mir152 mimics (superior) and mir152 inhibitor, mir152 mimics + inhibitor and non injected controls (inferior). mir152 mimics injections resulted in 30% of larvae with non-affected ethmoid plate (left), 28.5% of larvae with mildly affected ethmoid plate (central) and 41,5% of larvae with severe affected structures, including a cleft ethmoid plate (right). mir152 mimics injected embryos, n = 49. Both mir152 inhibitor injections and mimics + inhibitor combined injections resulted in no altered craniofacial structures with 100% of larvae with normal ethmoid plates. mir152 inhibitor injected embryos, n = 40; mimics + inhibitor injected embryos, n = 65. Control embryos, n = 107. b) Dorsal view of anterior portions of zebrafish larvae exemplifying non-affected, mildly affected, and severely affected phenotypes. White-dashed lines are positioned around the ethmoidal plates. eth: ethmoidal plate; mk: Meckel’s cartilage; pc: parachordal cartilage. c) Ethmoidal plate’s sizes in control (c) and injected conditions 6 μM, 12.5 μM, 25 μM mir152 mimics and 25 μM mir152 mimics + 25 μM mir152 inhibitor). Trapezoids indicate means. Significant differences were found in comparison to controls in 6, 12.5, and 25 μM mir152 mimics injections (p < 0.0001; ANOVA, Bonferroni).
Hypoxia is associated with mir152 hypomethylation and expression changes during development and affects craniofacial development
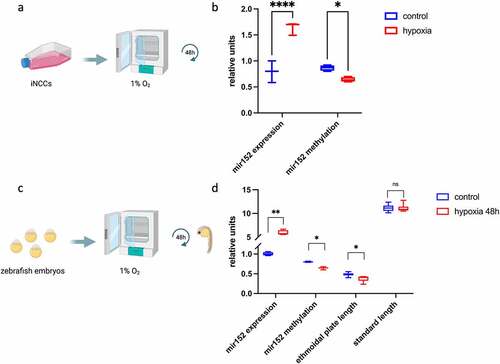
Upregulation of mir152 has been reported in cells subjected to hypoxia [Citation45], which reportedly induces orofacial clefts in mice and ethmoid plate defects in zebrafish [Citation46,Citation47]. We then hypothesized hypoxia as an environmental factor leading to mir152 hypomethylation and mir152 upregulation, resulting in the observed craniofacial defects in zebrafish. We first exposed iNCCs to hypoxia (1% O2) for 48 h and observed an increase of mir152 expression as well as mir152 hypomethylation in this in vitro model ()). Next, we exposed one-cell stage zebrafish embryos (n = 34) to hypoxia (1% O2) for 48 h and obtained 5 dpf embryos with reduced ethmoid plate size ()). To verify if hypoxia was driving generalized developmental arrest, we measured 5 dpf larvae’s standard length (anterior-to-posterior axis length) and observed no differences between embryos from normoxia and hypoxia conditions ()). Notably, 48 h of hypoxia in zebrafish resulted in a significant upregulation of mir152 in comparison to normoxia (~20-fold, )), corroborating the findings in iNCCs; these observations were associated with reduction of mir152 methylation levels from ~80% in normoxia conditions to ~66% in hypoxia in the zebrafish embryo ()). This suggests that hypoxia during early development could induce mir152 hypomethylation, leading to mir152 overexpression and reduction of ethmoidal plate size in zebrafish.
Figure 4. Hypoxia induces mir152 overexpression in human cells and zebrafish embryos and craniofacial defects in zebrafish larvae. (a) Scheme of hypoxia in induced neural crest cells (iNCCs). (b) RT-qPCR of mir152 expression in iNCCs in both control and hypoxia conditions for 48 h, showing increased expression of mir152 and reduced mir152 DNA methylation in hypoxia (p < 0.05). Units in mir152 expression values refer to relative expression normalized by RNU44; units in mir152 methylation refer to methylation indexes varying from 0 to 1. (c) Scheme of exposure to hypoxia in zebrafish embryos. (d) mir152 expression significantly increases under hypoxia for 48 h, accompanied by mir152 DNA methylation reduction and ethmoidal plate reduction. (*p < 0.05; **p < 0.005, ****p < 0.00005 Mann–Whitney’s test). Relative units at y-axis for mir152 expression refers to relative expression normalized by RNU6; units in mir152 methylation refer to methylation indexes varying from 0 to 1; units in ethmoidal plate length are in millimetres, as well as for standard length.
Discussion
Studies, especially via methylome analysis, addressing the contribution of epivariation to diseases have been growing in number in the past 6 y [Citation21–23,Citation30,Citation34]. In the case of NSCLP, methWASs have demonstrated the association of methylation changes in genes belonging to epithelial-to-mesenchymal transition (EMT) pathway and also methylation changes associated with cleft subtypes [Citation21,Citation48]. Whether such epigenetic changes are associated with genetic variation and/or environment is still an open question which we addressed in this work. Since the environment significantly impacts epigenetic variation [Citation49], those findings suggest that, in spite of the high genetic contribution to those phenotypes, the environment plays an important role in their aetiology.
By reanalysing previously published data, we identified microRNA mir152 as a new NSCLP candidate gene. The importance of microRNAs in craniofacial development has been enlightened by both neural crest and ectoderm Dicer conditional knockouts in mice, leading to defects such as cleft palate [Citation50]. Also, the association of specific microRNAs with NSCLP has been previously suggested by network-based studies using NSCLP GWAS genes, revealing mir-27b, mir-374a, and mir-497 as putative candidates [Citation51]. Association studies have also pointed out SNVs at mir-140 linked to NSCLP [Citation52] and mir-140 overexpression in zebrafish has been demonstrated to result in cleft palate [Citation53], again corroborating the importance of microRNAs in NSCLP aetiology. In this study, we found a DMR in mir152 in up to 26% of NSCLP samples displaying mir152 hypomethylation. We also confirmed mir152 hypomethylation in an independent Brazilian cohort. These results corroborate our initial findings and suggest a common epivariation at mir152 in association with NSCLP in the Brazilian population. We also found significant mir152 promoter methylation differences using methWAS data from a different population [Citation22], which suggest that not only epivariation at the mir152 gene body could be associated with NSCLP but also epivariation at the promoter region. We could not replicate, however, 8q24.21 or 1p36.13 DMRs in this independent cohort. Methylation differences at 8q24.23 (at HEATR7A) in NSCLP have been previously reported [Citation22], although in a different region to the 8q24.21 DMR observed in our cohort (~14 Mb apart). Therefore, we do not know whether such methylation changes at 8q24 are dependent on each of the studied populations or their effects are smaller for detection in our independent cohort due to the sample size. Methylation differences evaluated in the association part of this study were of small magnitude (0.005 for mir152, for example). While we understand that such small differences are unlikely biologically functional, we believe that, once validated and explored in different cohorts as in this study. It is possible that these differences represent proxies in adult tissues (blood or saliva) for past developmental events and would not reflect the actual differences during development. If this is true, environmental insults during development would also leave an epigenetic trace that could be assessed postnatally and validated by using different cohorts and functional assays, as proposed in this study.
mir152 is a member of the mir148/mir152 family and is located within an intron of COPZ2 at chromosome 17q21.32, a genomic region previously associated with NSCLP by GWAS, however with WNT9B as the principal candidate gene [Citation6]. To assess if mir152 variation could add to the NSCLP GWAS signals at 17q21.32, and because GWAS regions could be prone to epigenetic changes [Citation22], we also looked at linkage disequilibrium (LD) data from 1000 Genomes and found that both COPZ2 and WNT9B are not in LD. Therefore, mir152 epigenetic changes might be rather independent from 17q21.32 association with NSCLP. Because genetic variation can modulate DNA methylation within a region [Citation40,Citation54,Citation55], we investigated whether common genetic variation could modulate methylation changes at mir152. Despite our results showing no significant correlation for a common variant (rs12940701) at mir152 region with mir152 epivariation, a trend of hypomethylation is observed towards TT genotype and the absence of significance could still be a statistical power issue due to the sample size. Therefore, we cannot discard rs12940701 as a methylation QTL (meQTL) in a larger cohort. In fact, mir152 processed sequence is highly conserved and identical from fish to mammals [Citation56], indicating that either its function has been conserved during evolutionary diversification and/or genetic variation at that region is not tolerated. We cannot rule out that genetic variation in the promoter region of mir152 or out of the analysed region, which is not covered in our Sanger sequencing and exome analysis, could lead to expression variability. Furthermore, we cannot exclude that tissues other than those studied here could display a meQTL status for rs12940701.
To determine the functional effects of mir152 hypomethylation in gene expression, we induced a Cas9-mediated demethylation of mir152 in iNCC and HEK293T cells, and showed that mir152 hypomethylation leads to mir152 upregulation in human cells. Because we did not perform a genomic approach to look for methylation off-target effects in our demethylation assay, we cannot rule out the potential effects of methylation differences at other loci. However, the effects reported here demonstrating mir152 demethylation leading to mir152 upregulation in two cell types (iNCCs and HEK293T) are robust, and therefore the findings on mir152 hypomethylation in both 450 K and independent cohorts are likely functional. Functional studies have demonstrated mir152 as an important modulator of EMT in epithelial cells, in which mir152 overexpression is known to inhibit TGFbeta [Citation57]. TGFbeta and EMT pathways have been extensively associated with both syndromic and nonsyndromic forms of oral clefting. Indeed, gene pathways associated with NSCLP seem to converge around the process of EMT, either via loss-of-function variants in EMT genes or misregulation of such genes by regulatory polymorphisms, which has been further investigated with animal models [Citation58–62]. It has also been shown that upregulation of mir152 targets DNMT1, which in turn controls CDH1 expression via DNA methylation affecting E-cadherin levels and EMT in breast cancer cells [Citation63,Citation64]. Interestingly, loss-of-function mutations in cadherin/catenin complex have been found in both syndromic and nonsyndromic clefting forms and CDH1 promoter hypermethylation has been previously associated with cleft penetrance in NSCLP families [Citation9,Citation21,Citation65]. Our RNA-seq analysis on hypomethylated mir152 iNCCs revealed that the upregulation of mir152 led to downregulation of adherens junction genes, comprising cadherin/atenin complex genes as CTNNA1 (alpha-catenin), CTNNB1 (beta-catenin), and CDH2 (N-cadherin). Dysregulation of such genes has been reported to disrupt neural crest development and migration [Citation66–69]. Indeed, both CTNNA1 and CTNNB1 play pivotal roles during EMT and their regulation are associated with EMT induction as well as cell proliferation and cell migration [Citation70–73]. In the same manner, CDH2 downregulation in the neural crest reduces cell migration as previously demonstrated in Xenopus [Citation67]. Other important genes for neural crest migration found in the downregulated Adherens Junction pathway are actins ACTB, ACTN4, ACTG1, and RHOA, responsible for cell motility and contractility [Citation74–76]. We also found that mir152 upregulation led to downregulation of ribosomal and spliceosomal genes. Ribosomopathies, which are characterized by loss-of-function mutations in ribosomal genes, are known to mainly affect craniofacial structures by impairing neural crest progression [Citation77,Citation78]. The same is true for spliceosomal genes, in which mutation has also been linked to craniofacial disorders, including EIF4A3, which encodes for a core protein in the spliceosome machinery, and hypomorphic mutations lead to a craniofacial syndrome [Citation79–81]. We also found among the mir152 upregulation-related DEGs predicted mir152 targets as DNMT1, SMAD3, and UHRF1, which were connected to the mentioned down-regulated pathways; however, further investigation is needed to demonstrate how DNMT1, SMAD3, or UHRF1 may orchestrate the regulation of such pathways. We believe therefore that mir152 dysregulation in the neural crest lineage affects neural crest development by compromising essential pathways as adherens junctions, ribosomal and spliceosomal machineries, which could ultimately lead to craniofacial phenotypes such as orofacial clefts.
Once we found mir152 hypomethylation to promote mir152 upregulation, we mimetized mir152 upregulation in zebrafish development by mir152-mimic injections. mir152 upregulation led to several defects mainly affecting craniofacial cartilages. It is important to note that such observed phenotypes were specific to the mir152-mimic injections, compatible with a mir152 upregulation scenario, once both inhibitor and the mimic + inhibitor injections resulted in no affected embryos. Besides, we demonstrated a dose-dependent effect of mir152 upregulation on zebrafish ethmoidal plate’ sizes and malformation. Such results suggest a specific effect of mir152 in controlling zebrafish cranial structures development, particularly of the ethmoidal plate. Because injections were performed at the one-cell stage, mimic/inhibitor oligonucleotides may persist until later development and we cannot rule out that the mir152 mimic is affecting general craniofacial chondrogenesis rather than earlier stages comprising neural crest development. Ethmoidal plate defects in zebrafish are often described as an analogous model for human palatal clefting, and indeed expression regulation during development of the ethmoidal plate is comparable to that of the mammalian palate [Citation82–84]. However, it is still possible that other cellular types and molecular mechanisms could be involved in the zebrafish clefting model here reported. We also observed non-ethmoidal plate craniofacial defects in the zebrafish, mainly affecting the Meckel’s cartilage and ceratobranchial. Although the size of these structures was not measured, we suggest that mir152 plays a role in craniofacial cartilage development in general. We did not address, however, which are the mir152 targets leading to such developmental alterations and, based on our iNCC RNAseq data, further experimentation is needed to assess whether specific adherens junction, EMT, spliceosome or ribosome genes are downregulated under mir152 upregulation. Therefore, the precise mechanism of action of mir152 during craniofacial development remains to be addressed.
While the vast majority of studies on NSCLP aetiology states the multifactorial scenario for NSCLP, knowledge on how the NSCLP-associated environmental factors influence the genome and epigenome behaviour is scarce. Here, we hypothesized that such hypomethylation and consequently upregulation of mir152 could be caused by embryonic hypoxia. Hypoxia is a normal condition during several steps of mammalian development required for proper cell differentiation and progression [Citation85], however abnormal oxygen levels below the foetal hypoxia limits can lead to malformations and disease [Citation86–88]. Regarding oral clefts and craniofacial development, hypoxia has been demonstrated for a long time to be a strong risk environmental factor in mice, rat, and chicken models [Citation47,Citation89–91] and also hypoxia-related environmental factors are epidemiologically associated with NSCLP [Citation16,Citation17,Citation92,Citation93]. More recently, a hypoxia induced clefting model in zebrafish has been demonstrated [Citation46] reinforcing the effect of hypoxia on craniofacial development and supporting our model. In agreement with this study, our hypoxia exposure in zebrafish embryos also resulted in aberrant ethmoid plate sizes and in increased mir152 expression accompanied by mir152 hypomethylation at 48 h of hypoxia. In light of the main results found here, our work links an epigenetic alteration in NSCLP to a potential environmental factor, contributing to the multifactorial model proposed to this malformation.
In summary, we demonstrated how individual methylome analysis in NSCLP can bring forward individual-specific methylation changes potentially relevant to phenotype. We found mir152 hypomethylated in 26% of our cohort and replicated this finding in 28% of the cases on an independent NSCLP cohort. Methylation changes at mir152 result in expression changes and mir152 upregulation during development leads to impairment of craniofacial development and maternal/foetal hypoxia might be the environmental link leading to mir152 epivariation. We suggest therefore mir152 as a novel candidate locus for NSCLP, expanding the current knowledge on NSCLP aetiology and molecular mechanisms.
Methods
Ethics statement
This study was approved by both the Ethics Committee of the Instituto de Biociências Universidade de São Paulo, Brazil (Protocol 353/2019). In the case of human samples, biological samples were collected after signed informed consent by the parents or legal guardians. All experiments were performed in accordance with relevant guidelines and regulations.
Affected individuals and control samples
For methylome analysis, we used previously published and public data [Citation21], which briefly consisted of Illumina Infinium HumanMethylation 450 K data of blood-derived DNA from 66 cases from non-familial NSCLP individuals and 59 age- and sex-matched controls from healthy individuals (hereafter named as ‘450 K cohort’). Our replication cohort consisted of 57 non-familial NSCLP and 130 control samples which were ascertained either at the Hospital das Clínicas of Universidade de São Paulo (São Paulo, Brazil), Centro de Pesquisas Sobre o Genoma Humano e Células-Tronco of Universidade de São Paulo (São Paulo, Brazil) or during missions of Operation Smile Brazil (Supplementary File 3). Samples from the replication cohort were saliva-derived DNA collected with Oragene (DNA Genotek) and genomic DNA extracted as recommended by the fabricant. Cleft palate only was not included in this study.
450 K methylome analysis
To identify differentially methylated regions (DMRs) at the gene level in NSCLP samples, we first compared all 66 NSCLP samples versus all 59 controls (450 K cohort) using the RnBeads pipeline, which comprises filtering, normalization and differential methylation steps [Citation94]. We filtered out probes affected by SNPs, on sex chromosomes, probes with a p-value detection >0.05 (Greedycut) and probes with non-CpG methylation pattern. Data were normalized using the SWAN method. Principal component analysis (PCA) was also performed using R packages in order to identify obvious confounding effects in the 450 K cohort. Differential methylation analysis was performed using the RefFreeEWAS method, which corrects p-values for blood cellular contributions, accounting for gene regions. We also used sex, age, and probe markers of batch effects as covariates for differential methylation analysis p-value correction as previously described [Citation21]. We analysed DMRs at the gene level as defined by RnBeads, which computes methylation differences within annotated RefSeq Genes. We used as selection criteria the five top ranked DMRs listed by RnBeads, which rank DMRs combining adjusted p-values, methylation difference, and quotient of difference. As a second step to identify individual contributions to the selected DMRs, we individually compared each NSCLP sample versus all 59 controls using the same parameters described above. At this point, we selected as DMRs those regions with p-value <0.05 after FDR and covariate adjustment and with at least 5% beta-value difference. We also compared those DMRs with previously published data of frequent and common DMRs [Citation34]. DMRs were listed by NSCLP sample and we checked for DMRs co-occurring in different NSCLP samples.
Bisulfite amplicon sequencing of mir152 in the replication cohort
To quantify methylation levels at mir152, 8q24.21, and 1p26.13 DMRs in the replication cohort, we used the Bisulfite amplicon sequencing (BSAS) method as previously described [Citation21]. In summary, BSAS relies on bisulfite PCR, library preparation, and DNA sequencing with a NGS sequencer [Citation95,Citation96]. We designed bisulfite-specificPCR primers for those DMRs using the online tool MethPrimer (http://www.urogene.org/methprimer/) with reported recommendations to avoid bisulfite PCR amplification bias [Citation97]. The predicted amplicons in GRCh37/hg19 build for those DMRs are: mir152 at chr17:46114502–46114660,8q24.21 at chr8:130876990–130877116 and 1p36.13 at chr1:17231171 − 17,231,307. Primer sequences are available in Supplementary File 8. Samples from the replication cohort DNAs were submitted for bisulfite conversion using 1 μg of DNA in the e EZ-96 Methylation Kit (Zymo Research). Converted DNA was used as a template for bisulfite-specific PCR with the HotStartTaq Plus (QIAGen) standard protocol and amplicons were checked by agarose gel electrophoresis and by Bioanalyzer HiSensitivity DNA prior to library preparation. During the library preparation indexes were added in one PCR step for sample (Access Array Barcode Library, Fluidigm). Libraries were purified by Ampure XP Beads in a magnetic column and checked again in the Bioanalyzer HiSensitivity DNA for peak shift visualization. Finally, libraries were submitted for sequencing with the MiSeq Reagent V3 Kit 150 bp single-ended run on a MiSeq Sequencer (Illumina). We performed de-multiplexing of sequences using the FASTX Barcode Splitter program in the FastX Toolkit R package (http://hannonlab.cshl.edu/fastx_toolkit/). Following this, we filtered out reads of low quality, selecting only reads with at least 50% of bases with Q > 30 using the FASTQ Quality Filter program, also part of the FastX Toolkit R package. Next, FASTQ files were converted to FASTA files using the FASTQ-to-FASTA program in the same package. For the quantification of methylation levels at the mir152 region we used the BiQAnalyzer HT software [Citation98], in which we applied quality filters as follows: minimal reference sequence identity to 90%, minimal bisulfite conversion rate of 90%, maximum of 10% gaps allowed in CpG sites and minimal of 10 reads of coverage. Following these parameters, we obtained average mir152 region methylation level per sample and also site methylation level within mir152 region. To investigate hypomethylation, we calculated the controls’ 10th percentile and computed NSCLP samples below this threshold. Frequencies were tested by Chi-square test. Graphs were generated using the R package ggplot2.
Independent population NSCLP methylome data
We used summary statistics data publicly available from an independent NSCLP case–control methylome study performed on 182 hispanic and non-hispanic individuals [Citation22]. We looked for significant (p > 0.05) probes overlapping mir152 region (cg02742085, cg05096161, cg05850656, cg06598332, cg09111258, cg10382221, cg10472567, cg21384971, cg24389730).
Sequencing genetic variation analysis at mir152 region
For sanger sequencing, we PCR amplified mir152 region in replication cohort samples using Platinum Taq Polymerase Supermix and specific primers (Supplementary File 8). Amplicons were treated with ExoProStar (GE Healthcare Life Sciences) and then submitted to Sanger sequencing using the BigDye Terminator v3.1 Sequencing standard kit (Applied Biosystems). Next, sequencing products were purified using Sephadex G-50 (GE Healthcare Life Sciences) with MultiScreen Column Plates (Merck-Millipore) and finally submitted to capillary electrophoresis at the ABI 3730 DNA Analyser (Applied Biosystems). All reactions were performed following the manufacturer’s recommendations.
Cell lines
For the functional investigation of mir152 hypomethylation we used both HEK293T and induced neural crest (iNCCs) cells derived from human-induced pluripotent stem cells. Cells were tested for mycoplasma using PCR and gel electrophoresis. iNCCs from healthy individuals were generated and characterized elsewhere [Citation81].
Site-specific demethylation
To functionally investigate the role of methylation variation at the mir152 DMR, we used a CRISPR-Cas9-based approach in which a plasmid expressing a modified and catalytically inactive Cas9 (dCas9) were fused to the catalytic domain of TET1 with a co-expression system for sgRNA, allowing target specific demethylation [Citation43]. We obtained plasmid pPlatTET-gRNA2 (#82559) from Addgene. mir152-specific sgRNAs were designed with CRISPRdirect (https://crispr.dbcls.jp/), named as sgRNA-1, sgRNA-2, and sgRNA-3 (Supplementary File 8). sgRNAs were cloned to plasmids as previously published [Citation43]. All the three plasmid-sgRNA combinations plus empty plasmids were transfected to HEK293T cells. iNCCs were transfected with either pPlatTET (empty plasmid) or pPlatTET-sgRNA3. All transfections were performed using SuperFect (QIAgen) following the fabricant’s protocol. After 48 h post transfection, cells were checked by fluorescent microscopy to visualize GFP expression and GFP-positive cells were sorted with the BD FACS Aria II and BD FACS Diva software and then pelleted to simultaneously extract DNA and RNA using TriPrep kit (Macherey-Nagel).
cDNA synthesis and real-time quantitative PCRs
RNA samples were submitted to cDNA synthesis for miRNA using the NCode miRNA First-Strand cDNA Synthesis kit (Thermo Fisher) and recommended protocols. RT-qPCR were performed using Fast SYBRGreen MasterMix (Thermo Fisher) and mir152 specific primers with NCode miRNA First-Strand cDNA Synthesis qPCR Universal Primer in a fast mode SYBRGreen reaction at the QuantStudio 5 (Thermo Fisher). We used RNU6B and RNU44 as endogenous controls. Relative expression values were calculated as previously reported [Citation99]. For mRNA cDNA synthesis, we used the same total RNA (1 μg) as inputs for the SuperScript IV First-Strand Synthesis System (ThermoFisher) and specific primers for COPZ2, NFE2L1, CBX1, CDK5RAP3, and TBP and HPRT1 as endogenous controls, in a SYBRGreen reaction at the QuantStudio 5 (Thermo Fisher) or conventional PCR. For zebrafish tp53, we used eif1a as the endogenous control. For zebrafish mir152 quantification, we used TaqMan microRNA assay and probes for dre-mir152 and rnu6, following the manufacturer’s recommendations (Thermo Fisher). Oligonucleotide sequences are depicted in Table S8.
RNA sequencing on iNCCs
Three replicates of pPlatTET-sgRNA3 and pPlatTET transfected iNCCs as well as non-transfected iNCCs (controls) had total RNA isolation as previously mentioned. RNA quality was checked by electrophoresis on agarose gel and BioAnalyzer. Libraries for RNA-seq were then generated using TruSeq RNA Library Prep Kit v2, and were checked and quantified via Bioanalyzer (Agilent) and RT-qPCR using the NEBNext Library Quant kit (NEB). Sequencing of libraries was performed in a HiSeq 2500 (Illumina). For differential gene expression amAnd And analysis fastq files were used on RNASeqR pipeline [Citation100], which accounts for trimming of low quality reads and performs alignment and quantification of reads. DeSeq was used on RNASeqR as a method for differentially expressed gene (DEG) selection. We performed group comparisons of pPlatTET-sgRNA3 vs pPlatTET, pPlatTET-sgRNA3 vs controls and pPlatTET vs controls. DEGs presented in the pPlatTET vs controls were then excluded and we used a p-value cut-off of E-07 as a genomic level of significance. DEGs were manually analysed and also submitted to the PathfindR tool for KEGG pathways enrichment analysis.
Bisulfite sequencing on HEK293T-transfected cells
For mir152 methylation analysis after pPlatTET1-GFP plasmid transfections in iNCCs and HEK293T cells, we applied traditional bisulfite sequencing method, consisted of bisulfite conversion of 1ug of genomic DNA and PCR amplification of mir152 region using the method described above. PCR products cloning into a pGEM-T-easy vector system (Promega). We Sanger sequenced 10 colonies per sample using M13 primers using the above described method and results were analysed with BISMA online tool (Bisulfite Sequencing DNA Methylation Analysis – http://services.ibc.uni-stuttgart.de/BDPC/BISMA/) [Citation101] with default parameters.
Injection of mir152 mimic and inhibitor in zebrafish embryos and hypoxia tests
We performed crossings using AB zebrafish lineages and embryos were collected in E3 medium. Specific microRNA mimic and inhibitor for zebrafish mir152 were purchased from Thermo Fisher Scientific. Briefly, mirVana mimics are double-stranded chemically modified RNAs with the same sequence as the target miRNA, while mirVana inhibitors are single-stranded chemically modified DNA complementary to the target miRNA (ThermoFisher Scientific). Embryos at the one-cell stage were injected with 2 nL of either 25, 12.5, or 6 μM dre-mir152 mimic, 25 μM dre-mir152 inhibitor or a co-injection of dre-mimic + inhibitor (both at final concentration of 25 μM in a single solution). TE 1X was injected as a control. Injected embryos were then raised for up to 5 d in E3 medium at 29°C and 12 h/12 h light/dark cycle. Larvae at 5 dpf were collected and fixed in 4% PFA followed by alcian blue staining for craniofacial cartilages phenotyping using previously published protocols [Citation79]. To study the effects of hypoxia on zebrafish embryos, we exposed 34 one-cell stage zebrafish embryos for 48 h in a 1% O2 incubator (Hera Cell – Thermo Fisher) and compared to 55 control embryos.
In situ hybridization
mir152 in situ hybridization (ISH) was performed using locked-nucleic acid (LNA) probe (mirCURY-LNA, QIAGEN) specific for the zebrafish mir152 sequence (probe sequence: 5’-UCAGUGCAUGACAGAACUUUGG-3’) or mirCURY-LNA control probe. ISH was conducted following a previously published protocol [Citation102]. In summary, embryos at the mentioned stages were fixed on 4% PFA overnight at 4°C and then post-fixed on 0.16 M EDC for 2 h at room temperature and overnight at 4°C. After fixation, embryos were washed three times on PBS-T and dehydrated in increasing concentrations of methanol (25–100%). Then, embryos were re-hydrated in decreasing concentrations of methanol (100–0%) diluted in PBS-T. After rehydration, proteinase K digestion was used for permeabilization (10 µgl/ml, 3 min at 37°C) and then re-fixed in 4% PFA for 10 min. Next, embryos were primed with hybridization buffer (50% deionized formamide, 5× saline sodium citrate (SSC), 0.1% Tween-20, 9.2 mM citric acid, supplemented with 50 µg/ml Heparin and 0.5 mg/ml tRNA) at 60°C for 10 min at room temperature and 3 hours at 54°C. The solution was replaced by hybridization buffer containing the probe (50 nM) and incubated overnight at 54°C. After hybridization, samples were washed with hybridization buffer- 2X-SSC-T with decreasing concentration of hybridization buffer (75–25%) for 10 min each wash at 54°C. Embryos were then washed three times in PBS-T and blocked for 1 h at room temperature with Roche Blocking Reagent 4% in PBS-T. Next, samples were incubated with anti-digoxigenin (Roche, 1:5000) in blocking solution overnight at 4°C. Three washes in PBS-T were used prior to staining, followed by incubation in AP buffer (0.1 M Tris-HCl pH 9.5, 50 mM Mg2Cl, 0.1 M NaCl, 0.01% Tween-20) for 15 min at room temperature. Finally, samples were stained in AP Buffer added with NBT (Roche, 1:200) and BCIP (Roche, 1:270) at RT for 30 min and fixed with 4% PFA after developing.
Statistical analysis
Methylome and RNAseq statistical analyses were performed as implemented in the previously mentioned packages, with FDR as a multiple testing correction in both cases. Bisulfite amplicon sequencing data used for validation was submitted to ANOVA with Bonferroni correction. qPCRs were submitted to either Wilcoxon–Mann–Whitney or t-test depending on data distribution. ANOVA was used for ethmoidal plate measurements in multiple groups. Data were considered statistically significant when p < 0.05 after multiple testing corrections.
Data availability
The DOI or other location of our data 10.4121/19181903
Supplemental Material
Download Zip (17.2 MB)Acknowledgments
We are thankful to the Passos-Bueno lab members for helpful discussions and lab organization. We thank Patrícia Semedo Kuriki for helping with cell sorting. We also express our gratitude to Vanessa Naomi and Daiane Gil Franco for the sequencing services and for performing the RNA-seq run during the COVID-19 pandemics. We also thank Dale Bryant for the support with this manuscript. This work was supported by FAPESP/CEPID 2013/08028-1, FAPESP 2017/11430-7 (LA), 2016/23648-4 (LAB), and CNPq 305405/2011-5 (MRPB) research fellowships.
Disclosure statement
No potential conflict of interest was reported by the author(s).
Supplementary material
Supplemental data for this article can be accessed online at https://doi.org/10.1080/15592294.2022.2115606
Additional information
Funding
Related Research Data
References
- Mossey PA, Little J, Munger RG, et al. Cleft lip and palate. Lancet. 2009;374(9703):1773–1785.
- Brito LA, Cruz LA, Rocha KM, et al. Genetic contribution for non-syndromic cleft lip with or without cleft palate (NS CL/P) in different regions of Brazil and implications for association studies. Am J Med Genet A. 2011;155A(7):1581–1587.
- Grosen D, Bille C, Petersen I, et al. Risk of oral clefts in twins. Epidemiology. 2011;22(3):313–319.
- Hu DN, Li JH, Chen HY, et al. Genetics of cleft lip and cleft palate in China. Am J Hum Genet. 1982;34(6):999–1002.
- Ludwig KU, Böhmer AC, Bowes J, et al. Imputation of orofacial clefting data identifies novel risk loci and sheds light on the genetic background of cleft lip ± cleft palate and cleft palate only. Hum Mol Genet. 2017;26(4):829–842.
- Yu Y, Zuo X, He M, et al. Genome-wide analyses of non-syndromic cleft lip with palate identify 14 novel loci and genetic heterogeneity. Nat Commun. 2017;8(1):14364.
- Aylward A, Cai Y, Lee A, et al., University of Washington Center for Mendelian Genomics. Using whole exome sequencing to identify candidate genes with rare variants in nonsyndromic cleft lip and palate. Genet Epidemiol. 2016;40(5):432–441.
- Basha M, Demeer B, Revencu N, et al. Whole exome sequencing identifies mutations in 10% of patients with familial non-syndromic cleft lip and/or palate in genes mutated in well-known syndromes. J Med Genet. 2018;55(7):449–458.
- Brito LA, Yamamoto GL, Melo S, et al. Rare variants in the epithelial cadherin gene underlying the genetic etiology of nonsyndromic cleft lip with or without cleft palate. Hum Mutat. 2015;36(11):1029–1033.
- Holzinger ER, Li Q, Parker MM, et al. Analysis of sequence data to identify potential risk variants for oral clefts in multiplex families. Mol Genet Genomic Med. 2017;5(5):570–579.
- Pengelly RJ, Arias L, Martínez J, et al. Deleterious coding variants in multi-case families with non-syndromic cleft lip and/or palate phenotypes. Sci Rep. 2016;6(1):30457.
- Savastano CP, Brito LA, Faria ÁC, et al. Impact of rare variants in ARHGAP29 to the etiology of oral clefts: role of loss-of-function vs missense variants. Clin Genet. 2017;91(5):683–689.
- Cox LL, Cox TC, Moreno Uribe LM, et al. Mutations in the epithelial cadherin-p120-catenin complex cause Mendelian non-syndromic cleft lip with or without cleft palate. Am J Hum Genet. 2018;102(6):1143–1157.
- Acuña-González G, Medina-Solís CE, Maupomé G, et al. Family history and socioeconomic risk factors for non-syndromic cleft lip and palate: a matched case-control study in a less developed country. Biomedica. 2011;31(3):381–391.
- Bánhidy F, Acs N, Puhó EH, et al. A possible association of periodontal infectious diseases in pregnant women with isolated orofacial clefts in their children: a population-based case-control study. Birth Defects Res. Part A Clin Mol Teratol. 2010;88(6):466–473.
- Jia ZL, Shi B, Chen CH, et al. Maternal malnutrition, environmental exposure during pregnancy and the risk of non-syndromic orofacial clefts. Oral Dis. 2011;17(6):584–589.
- Lebby KD, Tan F, Brown CP. Maternal factors and disparities associated with oral clefts. Ethn Dis. 2010;20:S1–146.
- Puhó EH, Szunyogh M, Métneki J, et al. Drug treatment during pregnancy and isolated orofacial clefts in Hungary. Cleft Palate Craniofac J. 2007;44(2):194–202.
- Shahrukh Hashmi S, Gallaway MS, Waller DK, et al., National Birth Defects Prevention Study. Maternal fever during early pregnancy and the risk of oral clefts. Birth Defects Res. Part A Clin Mol Teratol. 2010;88:186–194.
- Waller DK, Hashmi SS, Hoyt AT, et al. Maternal report of fever from cold or flu during early pregnancy and the risk for noncardiac birth defects, national birth defects prevention study, 1997-2011. Birth Defects Res. 2018;110(4):342–351.
- Alvizi L, Ke X, Brito LA, et al. Differential methylation is associated with non-syndromic cleft lip and palate and contributes to penetrance effects. Sci Rep. 2017;7(1):2441.
- Gonseth S, Shaw GM, Roy R, et al. Epigenomic profiling of newborns with isolated orofacial clefts reveals widespread DNA methylation changes and implicates metastable epiallele regions in disease risk. Epigenetics. 2019;14(2):198–213.
- Howe LJ, Richardson TG, Arathimos R, et al. Evidence for DNA methylation mediating genetic liability to non-syndromic cleft lip/palate. Epigenomics. 2019;11(2):133–145.
- Bird A. Perceptions of epigenetics. Nature. 2007;447(7143):396–398.
- Feil R, Fraga MF. Epigenetics and the environment: emerging patterns and implications. Nat Rev Genet. 2012;13(2):97–109.
- Zoghbi HY, Beaudet AL. Epigenetics and human disease. Cold Spring Harb Perspect Biol. 2016;8(2):a019497.
- Fu C, Lou S, Zhu G, et al. Identification of new miRNA-mRNA networks in the development of non-syndromic cleft lip with or without cleft palate. Front Cell Dev Biol. 2021;9:631057.
- Suzuki A, Yoshioka H, Summakia D, et al. MicroRNA-124-3p suppresses mouse lip mesenchymal cell proliferation through the regulation of genes associated with cleft lip in the mouse. BMC Genomics. 2019;20(1):852.
- Yoshioka H, Li A, Suzuki A, et al. Identification of microRNAs and gene regulatory networks in cleft lip common in humans and mice. Hum Mol Genet. 2021;30(19):1881–1893.
- Florath I, Butterbach K, Heiss J, et al. Type 2 diabetes and leucocyte DNA methylation: an epigenome-wide association study in over 1,500 older adults. Diabetologia. 2016;59(1):130–138.
- Fyfe I. Alzheimer disease: epigenetics links ageing with Alzheimer disease. Nat Rev Neurol. 2018;14(5):254.
- Gilsbach R, Schwaderer M, Preissl S, et al. Distinct epigenetic programs regulate cardiac myocyte development and disease in the human heart in vivo. Nat Commun. 2018;9(1):391.
- Ligthart S, Marzi C, Aslibekyan S, et al. DNA methylation signatures of chronic low-grade inflammation are associated with complex diseases. Genome Biol. 2016;17(1):255.
- Barbosa M, Joshi RS, Garg P, et al. Identification of rare de novo epigenetic variations in congenital disorders. Nat Commun. 2018;9(1):2064.
- Seelan RS, Appana SN, Mukhopadhyay P, et al. Developmental profiles of the murine palatal methylome. Birth Defects Res Part A Clin Mol Teratol. 2013;97(4):171–186.
- Greene RM, Pisano MM. Palate morphogenesis: current understanding and future directions. Birth Defects Res C Embryo Today. 2010;90(2):133–154.
- de Aquino SN, Messetti AC, Hoshi R, et al. Analysis of susceptibility polymorphisms for nonsyndromic cleft lip with or without cleft palate in the Brazilian population. Birth Defects Res Part A Clin Mol Teratol. 2014;100(1):36–42.
- Birnbaum S, Ludwig KU, Reutter H, et al. Key susceptibility locus for nonsyndromic cleft lip with or without cleft palate on chromosome 8q24. Nat Genet. 2009;41(4):473–477.
- Brito LA, Paranaiba LMR, Bassi CFS, et al. Region 8q24 is a susceptibility locus for nonsyndromic oral clefting in Brazil. Birth Defects Res Part A Clin Mol Teratol. 2012;94(6):464–468.
- Chen L, Ge B, Casale FP, et al. Genetic drivers of epigenetic and transcriptional variation in human immune cells. Cell. 2016;167(5):1398–1414.e24.
- Herman JJ, Sultan SE. DNA methylation mediates genetic variation for adaptive transgenerational plasticity. Proc Biol Sci. 2016;283. DOI:10.1098/rspb.2016.0988
- Theodore SC, Davis M, Zhao F, et al. MicroRNA profiling of novel African American and Caucasian Prostate cancer cell lines reveals a reciprocal regulatory relationship of miR-152 and DNA methyltranferase 1. Oncotarget. 2014;5(11):3512–3525.
- Morita S, Noguchi H, Horii T, et al. Targeted DNA demethylation in vivo using dCas9-peptide repeat and scFv-TET1 catalytic domain fusions. Nat Biotechnol. 2016;34(10):1060–1065.
- Weiner AMJ, Scampoli NL, Calcaterra NB. Fishing the molecular bases of treacher Collins syndrome. PLoS ONE. 2012;7(1):e29574.
- Tang X-L, Lin L, Song L-N, et al. Hypoxia-inducible miR-152 suppresses the expression of WNT1 and ERBB3, and inhibits the proliferation of cervical cancer cells. Exp Biol Med (Maywood). 2016;241(13):1429–1437.
- Küchler EC, Silva LAD, Nelson-Filho P, et al. Assessing the association between hypoxia during craniofacial development and oral clefts. J Appl Oral Sci. 2018;26:e20170234.
- Millicovsky G, Johnston MC. Hyperoxia and hypoxia in pregnancy: simple experimental manipulation alters the incidence of cleft lip and palate in CL/Fr mice. Proc Natl Acad Sci USA. 1981;78(9):5722–5723.
- Sharp GC, Ho K, Davies A, et al. Distinct DNA methylation profiles in subtypes of orofacial cleft. Clin Epigenetics. 2017;9(1):63.
- Leenen FAD, Muller CP, Turner JD. DNA methylation: conducting the orchestra from exposure to phenotype? Clin Epigenetics. 2016;8(1):92.
- Schoen C, Aschrafi A, Thonissen M, et al. microRNAs in palatogenesis and cleft palate. Front Physiol. 2017;8:165.
- Li A, Qin G, Suzuki A, et al. Network-based identification of critical regulators as putative drivers of human cleft lip. BMC Med Genomics. 2019;12(S1):16.
- Li L, Meng T, Jia Z, et al. Single nucleotide polymorphism associated with nonsyndromic cleft palate influences the processing of miR-140. Am J Med Genet A. 2010;152A(4):856–862.
- Eberhart JK, He X, Swartz ME, et al. MicroRNA Mirn140 modulates PDGF signaling during palatogenesis. Nat Genet. 2008;40(3):290–298.
- McRae AF, Marioni RE, Shah S, et al. Identification of 55,000 replicated DNA methylation QTL. Sci Rep. 2018;8(1):17605.
- Schulz H, Ruppert A-K, Herms S, et al. Genome-wide mapping of genetic determinants influencing DNA methylation and gene expression in human hippocampus. Nat Commun. 2017;8(1):1511.
- Liu X, Li J, Qin F, et al. miR-152 as a tumor suppressor microRNA: target recognition and regulation in cancer. Oncol Lett. 2016;11(6):3911–3916.
- Ning Y-X, Wang X-Y, Wang J-Q, et al. miR‑152 regulates TGF‑β1‑induced epithelial‑mesenchymal transition by targeting HPIP in tubular epithelial cells. Mol Med Report. 2018;17:7973–7979.
- Liu J, Chanumolu SK, White KM, et al. Transcriptional analysis of cleft palate in TGFβ3 mutant mice. Sci Rep. 2020;10(1):14940.
- Losa M, Risolino M, Li B, et al. Face morphogenesis is promoted by Pbx-dependent EMT via regulation of Snail1 during frontonasal prominence fusion. Development. 2018;145. DOI:10.1242/dev.157628.
- Martinelli M, Palmieri A, Carinci F, et al. Non-syndromic cleft palate: an overview on human genetic and environmental risk factors. Front Cell Dev Biol. 2020;8:592271.
- Milmoe NJ, Tucker AS. Craniofacial transitions: the role of EMT and MET during head development. Development. 2021;148. DOI:10.1242/dev.196030
- Nakajima A, Shuler F, Gulka C, et al. TGF-β signaling and the epithelial-mesenchymal transition during palatal fusion. Int J Mol Sci. 2018;19(11):3638.
- Lu Z-W, Du M-Y, Qian L-X, et al. MiR-152 functioning as a tumor suppressor that interacts with DNMT1 in nasopharyngeal carcinoma. Onco Targets Ther. 2018;11:1733–1741.
- Sengupta D, Deb M, Rath SK, et al. DNA methylation and not H3K4 trimethylation dictates the expression status of miR-152 gene which inhibits migration of breast cancer cells via DNMT1/CDH1 loop. Exp Cell Res. 2016;346(2):176–187.
- Frebourg T, Oliveira C, Hochain P, et al. Cleft lip/palate and CDH1/E-cadherin mutations in families with hereditary diffuse gastric cancer. J Med Genet. 2006;43(2):138–142.
- Rogers CD, Sorrells LK, Bronner ME. A catenin-dependent balance between N-cadherin and E-cadherin controls neuroectodermal cell fate choices. Mech Dev. 2018;152:44–56.
- Scarpa E, Szabó A, Bibonne A, et al. Cadherin switch during EMT in neural crest cells leads to contact inhibition of locomotion via repolarization of forces. Dev Cell. 2015;34(4):421–434.
- Szabó A, Mayor R. Mechanisms of neural crest migration. Annu Rev Genet. 2018;52(1):43–63.
- Taneyhill LA, Schiffmacher AT. Should I stay or should I go? Cadherin function and regulation in the neural crest. Genesis. 2017;55. DOI:10.1002/dvg.23028
- Benjamin JM, Nelson WJ. Bench to bedside and back again: molecular mechanisms of alpha-catenin function and roles in tumorigenesis. Semin Cancer Biol. 2008;18(1):53–64.
- Maj E, Künneke L, Loresch E, et al. Controlled levels of canonical Wnt signaling are required for neural crest migration. Dev Biol. 2016;417(1):77–90.
- Tanabe S, Kawabata T, Aoyagi K, et al. Gene expression and pathway analysis of CTNNB1 in cancer and stem cells. World J Stem Cells. 2016;8(11):384–395.
- Zhan T, Rindtorff N, Boutros M. Wnt signaling in cancer. Oncogene. 2017;36(11):1461–1473.
- Gao Y, Li G, Sun L, et al. ACTN4 and the pathways associated with cell motility and adhesion contribute to the process of lung cancer metastasis to the brain. BMC Cancer. 2015;15(1):277.
- Patrinostro X, Roy P, Lindsay A, et al. Essential nucleotide- and protein-dependent functions of Actb /β-actin. Proc Natl Acad Sci USA. 2018;115(31):7973–7978.
- Shao H, Wang JH-C, Pollak MR, et al. α-actinin-4 is essential for maintaining the spreading, motility and contractility of fibroblasts. PLoS ONE. 2010;5(11):e13921.
- Danilova N, Gazda HT. Ribosomopathies: how a common root can cause a tree of pathologies. Dis Model Mech. 2015;8(9):1013–1026.
- Ross AP, Zarbalis KS. The emerging roles of ribosome biogenesis in craniofacial development. Front Physiol. 2014;5:26.
- Favaro FP, Alvizi L, Zechi-Ceide RM, et al. A noncoding expansion in EIF4A3 causes Richieri-Costa-Pereira syndrome, a craniofacial disorder associated with limb defects. Am J Hum Genet. 2014;94(1):120–128.
- Lehalle D, Wieczorek D, Zechi-Ceide RM, et al. A review of craniofacial disorders caused by spliceosomal defects. Clin Genet. 2015;88(5):405–415.
- Miller EE, Kobayashi GS, Musso CM, et al. EIF4A3 deficient human iPSCs and mouse models demonstrate neural crest defects that underlie Richieri-Costa-Pereira syndrome. Hum Mol Genet. 2017;26(12):2177–2191.
- Dougherty M, Kamel G, Grimaldi M, et al. Distinct requirements for wnt9a and irf6 in extension and integration mechanisms during zebrafish palate morphogenesis. Development. 2013;140(1):76–81.
- Duncan KM, Mukherjee K, Cornell RA, et al. Zebrafish models of orofacial clefts. Dev Dyn. 2017;246(11):897–914.
- Raterman ST, Metz JR, Wagener FADTG, et al. Zebrafish models of craniofacial malformations: interactions of environmental factors. Front Cell Dev Biol. 2020;8:600926.
- Dunwoodie SL. The role of hypoxia in development of the mammalian embryo. Dev Cell. 2009;17(6):755–773.
- Huang L, Chen X, Dasgupta C, et al. Foetal hypoxia impacts methylome and transcriptome in developmental programming of heart disease. Cardiovasc Res. 2019;115(8):1306–1319.
- Hutter D, Kingdom J, Jaeggi E. Causes and mechanisms of intrauterine hypoxia and its impact on the fetal cardiovascular system: a review. Int J Pediatr. 2010;2010:401323.
- Webster WS, Abela D. The effect of hypoxia in development. Birth Defects Res C Embryo Today. 2007;81(3):215–228.
- Bronsky PT, Johnston MC, Sulik KK. Morphogenesis of hypoxia-induced cleft lip in CL/Fr mice. J Craniofac Genet Dev Biol Suppl. 1986;2:113–128.
- Smith F, Hu D, Young NM, et al. The effect of hypoxia on facial shape variation and disease phenotypes in chicken embryos. Dis Model Mech. 2013;6(4):915–924.
- Webster WS, Howe AM, Abela D, et al. The relationship between cleft lip, maxillary hypoplasia, hypoxia and phenytoin. Curr Pharm Des. 2006;12(12):1431–1448.
- Castilla EE, Lopez-Camelo JS, Campaña H. Altitude as a risk factor for congenital anomalies. Am J Med Genet. 1999;86(1):9–14.
- Little J, Cardy A, Munger RG. Tobacco smoking and oral clefts: a meta-analysis. Bull World Health Organ. 2004;82(3):213–218.
- Assenov Y, Müller F, Lutsik P, et al. Comprehensive analysis of DNA methylation data with RnBeads. Nat Methods. 2014;11(11):1138–1140.
- Masser DR, Berg AS, Freeman WM. Focused, high accuracy 5-methylcytosine quantitation with base resolution by benchtop next-generation sequencing. Epigenetics Chromatin. 2013;6(1):33.
- Masser DR, Stanford DR, Freeman WM. Targeted DNA methylation analysis by next-generation sequencing. J Vis Exp. 2015;(96). DOI:10.3791/52488.
- Wojdacz TK, Hansen LL, Dobrovic A. A new approach to primer design for the control of PCR bias in methylation studies. BMC Res Notes. 2008;1(1):54.
- Lutsik P, Feuerbach L, Arand J, et al. BiQ Analyzer HT: locus-specific analysis of DNA methylation by high-throughput bisulfite sequencing. Nucleic Acids Res. 2011;39(suppl_2):W551–6.
- Pfaffl MW. A new mathematical model for relative quantification in real-time RT-PCR. Nucleic Acids Res. 2001;29(9):e45.
- Chao K-H, Hsiao Y-W, Lee Y-F, et al. RNASeqR: an R package for automated two-group RNA-Seq analysis workflow. BioRxiv. 2019. DOI:10.1101/641324
- Rohde C, Zhang Y, Reinhardt R, et al. BISMA–fast and accurate bisulfite sequencing data analysis of individual clones from unique and repetitive sequences. BMC Bioinformatics. 2010;11(1):230.
- Lagendijk AK, Moulton JD, Bakkers J. Revealing details: whole mount microRNA in situ hybridization protocol for zebrafish embryos and adult tissues. Biol Open. 2012;1(6):566–569.