
ABSTRACT
Advanced renal cell carcinoma (RCC) poses a threat to patient survival. Epigenetic remodelling is the pathogenesis of renal cancer. Histone demethylase 4B (KDM4B) is overexpressed in many cancers through various pathways. However, the role of KDM4B in clear cell renal carcinoma has not yet been elucidated. The differential expression of KDM4B was first verified by analysing public databases. The expression of KDM4B in fresh tissues and pathology slides was further analysed by western blotting and immunohistochemical staining. KDM4B overexpression and knockdown cell lines were also established. Cell Counting Kit-8 (CCK-8) assay was used to detect cell growth. Transwell assays were performed to assess cell migration. Xenografts were used to evaluate tumour growth and metastasis in vivo. Finally, KDM4B expression levels associated with copy number variation (CNV) and cell cycle stage were evaluated based on single-cell RNA sequencing data. KDM4B was expressed at higher levels in tumour tissues than in the adjacent normal tissues. High levels of KDM4B are associated with worse pathological features and poorer prognosis. KDM4B also promotes cell proliferation and migration in vitro, as well as tumour growth and metastasis in vivo. Tumour cells with high KDM4B expression exhibited higher CNV levels and a greater proportion of cells in the G1/S transition phase. Our results confirm that KDM4B promotes the progression of clear cell renal carcinoma, is correlated with poor prognosis, and may be related to high levels of CNV and cell cycle progression.
Introduction
Renal cell carcinoma (RCC) is a common malignancy of the urinary system that originates from the epithelial cells of the renal tubules. In contrast, clear cell RCC (ccRCC) is the most common pathological form of RCC, accounting for more than 80% of RCC incidence [Citation1]. At the time of diagnosis, ~20% of ccRCC patients are in the late stage in China [Citation2]. However, complete remission and long-term disease-free survival (DFS) is difficult to achieve. Therefore, it is necessary to understand advanced ccRCC and identify new biomarkers for targeting this disease.
Epigenetic alterations play a crucial role in the development and progression of various tumours, including ccRCC [Citation3,Citation4]. One of the mechanisms involved in epigenetic regulation is methylation and demethylation of histones [Citation5]. Jumonji C domain-containing (JMJD) proteins are a family of proteins with histone demethylase activity. Lysine demethylase 4B (KDM4B, also known as JMJD2B) is an essential member of the JMJD family [Citation6]. KDM4B was shown to have pro-oncogenic effects in many tumours through various mechanisms, such as malignant cells proliferation by promoting autophagy in prostate cancer [Citation7], cancer promotion by altering glucose metabolism in colorectal cancer [Citation8], and enhancement of gastric cancer by epithelial – mesenchymal transition (EMT) [Citation9]. KDM4B was also found to be regulated by many upstream and downstream molecules. For example, KDM4B acts as an ERα target gene in hormonally responsive breast carcinogenesis but also forms a feed-forward regulatory loop in the regulation of hormone response [Citation10]. KDM4B can also be induced by HIF-1α in colorectal cancer cells under hypoxia and is positively correlated with the expression of the hypoxic marker carbonic anhydrase 9 (CA9) [Citation11]. KDM4B is also a positive regulator of cyclin-dependent kinase 6 (CDK6) in bladder and lung cancer cells [Citation12]. However, the role of KDM4B in ccRCC requires further investigation.
In this study, we investigated the role of KDM4B in ccRCC. We found that KDM4B was highly expressed in cancer regions other than adjacent normal tissues. High levels of KDM4B in patients with ccRCC often correlate with worse clinicopathological characteristics and poorer prognosis. Furthermore, KDM4B was demonstrated to promote cell proliferation, migration, and tumour progression in vitro and in vivo. Additionally, single-cell RNA sequencing analysis of ccRCC patients showed that KDM4B may alter the copy number of genes and promote cell cycle progression.
Methods and materials
Sample collection and cell lines
ccRCC and adjacent normal fresh tissues were collected from patients at Shanghai General Hospital between 2019–2021 with approval of Ethics Committee of Shanghai General Hospital (Registration number: SHGH/2019SQ404). Formalin-fixed paraffin-embedded (FFPE) ccRCC slides from ccRCC in 2016–2018 were also collected for further analysis. The clinical and pathological characteristics of the FFPE samples are shown in .
Table 1. Clinicopathological characteristics of SHGH cohort.
786-O and Caki-1 cell lines were obtained from American Type Culture Collection (ATCC) and cultured separately in RPMI 1640 medium supplemented with 10% fetal bovine serum (FBS) and 1% penicillin/streptomycin solution. All cells were incubated in a 37°C incubator with 5% CO2 and humidified air.
Cell transfection
KDM4B was overexpressed by transfection of the KDM4B-cDNA plasmid (pcDNA3.1) [Citation8] using Lipofectamine 2000 (Invitrogen) following the manufacturer’s instructions. The recombinant lentivirus containing the empty vector or shKDM4B was constructed and transfected as described previously [Citation13]. Overexpression and knockdown cells were screened by western blotting. The shRNA sequences were listed as follows: shKDM4B1#:5′-CCTGCCTCTAGGTTCATAA-3′, shKDM4B2#:5′-GCTACGAAGTGAACTTCGA-3′.
Western blot analysis
Proteins from cell lysates were loaded into SDS-PAGE gel to get separated and transferred to nitrocellulose membranes (GE Healthcare). The membranes were first blocked by 5% non-fat milk in Tris-buffered saline (TBS, pH 7.4) for 1 h, incubated with primary antibodies overnight at 4°C, and then incubated with secondary antibodies for 1 h at room temperature (25°C). Antibodies against KDM4B (LS-C165363-400) and β-actin (LS-B1040) were purchased from LifeSpan BioSciences. The secondary antibody was ab205718 from Abcam. The proteins were visualized using an ECL chemiluminescence system (Santa Cruz Biotechnology).
RNA extraction and quantitative real-time PCR
Total RNA from fresh tissues was extracted by TRIzol (15596026, Invitrogen) at 4°C. cDNA was constructed using a Superscript RT kit (TOYOBO). Gene expression was quantified using the SYBR Green PCR Master Mix Kit (TOYOBO). GAPDH was used as an internal control. The expression of KDM4B was normalized to that of GAPDH. Primers for KDM4B and GAPDH were previously described by Wu et al [Citation14].
Immunohistochemistry
Immunohistochemistry (IHC) was performed on formalin-fixed paraffin-embedded (FFPE) ccRCC tissue to compare in situ expression of KDM4B using the streptavidin-peroxidase method (Zymed Laboratories Inc.) described by the manufacturer. The antibodies were used as described above. IHC score was defined as the staining intensity score multiplied by the staining percentage score. Staining intensity scores were scaled to 0–3, representing no staining, weak staining, moderate staining, and strong staining, respectively. The staining percentage was scored using the following scale: 0, < 1% positive cells, 1 as less than 25% positive cells, 2 as 25–50% positive cells, 3 as 50–75% positive cells, 4 as more than 75% positive cells. A positive cell was defined as a cell with a weak, moderate, or strongly stained nucleus. Three pathologists independently evaluated the images. The IHC scores of KDM4B were used to classify the patients. Patients with KDM4B scores lower than the median were defined as ‘low expression’ and vice versa.
Cell proliferation assay
Cell counting Kit-8 (CCK-8) assay was performed to determine the cell proliferation rate. When performing the assay, overexpression/knockdown cells and control cells were plated onto 96-well plates (1000 cells/well) individually and cultured for seven days. On days one, three, five, and seven, the CCK-8 solution was added to the plates (10 µl/well) and incubated for 1 h. Absorbance was measured at 450 nm to determine the cell number. Each assay was replicated thrice.
Cell migration assay
Cell migration rates were assessed using the Transwell migration assay. Briefly, 2 × 10Citation4 cells were seeded into the upper chamber with serum-free medium and the lower chamber was filled with 10% FBS medium. The upper and lower chambers were separated using a permeable polycarbonate membrane coated with Matrigel basement membrane matrix (1 μg/μl) (BD Bioscience). Following 24 h of incubation, migrated cells were fixed with 4% paraformaldehyde and stained with crystal violet. The migration assay was replicated three times. The number of migrated cells was counted in three randomly selected fields on each membrane. The average value was used as the result.
Mice xenograft
NU/NU nude mice were injected subcutaneously with 1 × 10Citation6 786-O cells (empty vectors or KDM4B overexpressed) individually. Five mice were used in each group and 10 in total. The tumour size was measured using a caliper. Each tumour was measured at least 3 different diameters, separately. The longest diameter was defined as the length and the second longest diameter was defined as the width. Tumour volume was calculated as Volume (mm3=Length×Width2/2. After 28 days of feeding, mice were sacrificed by cervical dislocation. Tumours and livers of mice were collected for further analysis. The animal study was approved by the Ethics Committee of Shanghai General Hospital (Registration number: SHGH/2021SQ209).
Data processing of bulk sequencing
The TCGA database was downloaded in January 2022 by the R package ‘UCSCXenaTools’, Subsequently, we chose the TCGA.KIRC.sampleMap/HiSeqV2 dataset with a total of 606 samples, including 531 tumour samples. The mRNA expression matrices of GSE46699, GSE53757, and GSE66272 were obtained using the R package ‘GEOquery’. Data were visualized using the R package ‘ggpubr’ and ‘VennDiagram’.
Data processing of single-cell transcriptomic sequencing
Single-cell RNA sequencing data were reported previously by Shi Y et al [Citation15]. The expression matrix of ccRCC and normal epithelial cells was extracted from the original filtered data. The R package Giotto was used for data processing and visualization [Citation16]. The count matrix of ccRCC was normalized using the function ‘normalizeGiotto’. Highly variable genes were identified using the function ‘calculateHVF’. We performed principal component analysis (PCA) with highly variable genes using the function ‘runPCA’. PCA was evaluated using the function ‘jackstrawPlot’. We clustered the cells using the function ‘createNearestNetwork’ and ‘doLeidenCluster’ with dimensions 1–20. We visualized the data using Uniform Manifold Approximation and Projection (UMAP) by functions ‘runUMAP’ and ‘dimPlot2D’.
CNV inferring
We inferred the CNV in malignant cells using the R package InferCNV (https://github.com/broadinstitute/inferCNV). Normal epithelial cells were used as a reference and ccRCC cells were used for observation. The HMM-i6 state result was obtained. We scored the different states according to Table S1 to determine the CNV level in the different KDM4B groups.
Cell cycle analysis
The cell cycle was analysed using the R package TriCycle [Citation17]. The normalized expression matrix was first projected to ‘cell cycle space’ using the function ‘project_cycle_space’. The cell cycle stages were estimated using the function ‘estimate_cycle_position’. We defined 0–0.6pi as the ‘G1/S’ stage, 0.6–1pi as the ‘S’ stage, 1–1.25pi as the ‘G2/M’ stage, 1.25–1.75pi as the ‘M’ stage, and 1.75–2pi as the ‘G0/G1’ stage. The stage proportions of different clusters were calculated and visualized using the R package ggpubr.
Statistical analysis
All experiments were performed at least thrice. Data are expressed as the mean ± SD. Student’s t-test was applied to two-group data (paired or non-paired). Fisher’s exact test was used to analyse the contingency tables. GraphPad Prism v9.3 software was adopted for statistical analysis and visualization. Statistical significance was set at p < 0.05.
Results
KDM4B expressed higher in ccRCC
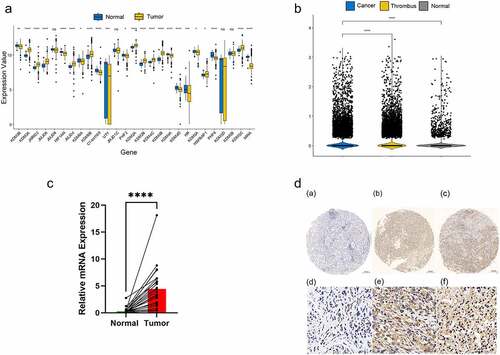
Twenty-seven JMJD family genes were identified through literature review [Citation18]. We compared the expression levels between the tumour and adjacent normal tissues using data from The Cancer Genome Atlas (TCGA) and Gene Expression Omnibus (GEO) (, S1A). Ten genes that were significantly differentially expressed were filtered out (Figure S1B and Table S2, p0.05). KDM4B was selected for further analysis owing to its greatest fold-change among the other genes in all datasets. As per our expectations, KDM4B showed higher expression levels in the cell RNA-sequencing dataset. Moreover, the expression level in the cancer thrombus was considerably higher than that in the primary tumour (). Quantitative RT-PCR analysis of 23 pairs of fresh tumours and adjacent normal tissues from Shanghai General Hospital revealed significantly higher KDM4B mRNA levels in ccRCC tissues than in normal tissues (). IHC images showed elevated protein levels in tumour tissues compared with normal tissues at the histopathological level (). In conclusion, we observed KDM4B with higher expression levels from different perspectives.
Figure 1. Overexpression of KDM4B in ccRCC tissues. (a) Differential expression of 27 JMJD family genes in TCGA between tumour and adjacent normal tissues. (b) Differential expression of KDM4B in normal tissues, primary tumours and tumour thrombus in single-cell datasets. (c) qPCR analysis of KDM4B in paired samples. GAPDH was used as an internal control to normalize KDM4B mRNA expression. (d) Representative immunohistochemical staining of tissues with different expression levels of KDM4B. Left: normal tissue; Middle: low expression of KDM4B; Right: high expression of KDM4B.
KDM4B expression predicted a poor prognosis
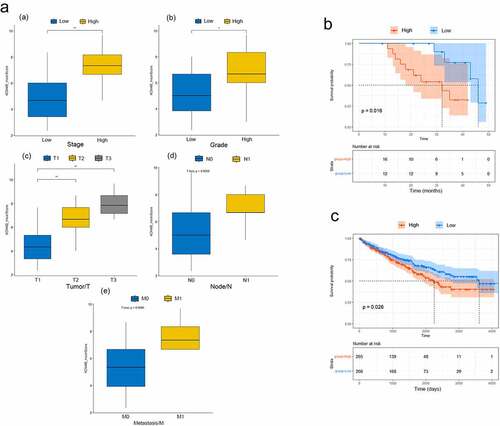
We scored these pathology slides of tumour tissues (n = 29) and classified them as low or high expression according to the scores (see Methods). We observed that the higher the tumour stage, the higher the KDM4B score (). Higher-grade tumours had higher KDM4B scores (). The TNM staging results were similar. Larger tumours (T) had significantly higher KDM4B scores (). Tumours with lymph node metastasis (N) or distant metastasis (M) had higher KDM4B scores at primary sites (). TCGA data partially validated our findings, as the TCGA data revealed no significant differences in pathological tumour (T) and histologic grading between the high and low-expression groups (Figure S2). We speculate that this may be related to the small sample size of our cohort and differences in the clinical characteristics of the samples. Patients from our cohort and TCGA datasets with higher expression levels of KDM4B had significantly shorter overall survival than those with lower expression (p = 0.016 and p = 0.026, respectively; ). Therefore, these results indicate that higher KDM4B levels may be associated with worse clinical characteristics and prognosis.
Figure 2. Relationship between KDM4B and clinicopathological features. (a) the relationship between KDM4B score and (a) stage, (b) tumour grade, (c) primary tumour, (d) lymph node metastasis, and (e) distant metastasis in the SHGH cohort. High stage: stage III, low stage: stage I and II. High grade: G3 and G4, low grade: G1 and G2. (b) Kaplan-–meier’s survival curve of SHGH cohort. High and low groups are determined by the mean KDM4B scores. (c) Kaplan – Meier’s survival curve of TCGA cohort. High and low groups are determined by the median KDM4B expression. *: p < 0.05, **: p < 0.01, SHGH: Shanghai General Hospital.
KDM4B promoted cell proliferation and migration
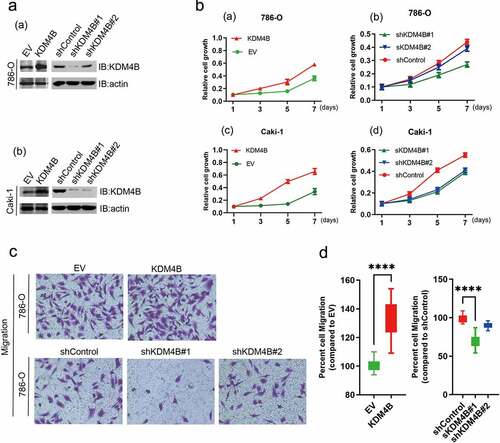
Based on the above results, we speculated that KDM4B may be an oncogene that mediates the progression and metastasis of ccRCC. Therefore, to further identify the function of KDM4B in cells, we established KDM4B overexpressing and knockdown cell lines 786-O and Caki-1. Western blot analysis confirmed this successful establishment (). Notably, the cells overexpressing KDM4B had significantly promoted proliferation as determined by the CCK-8 assay (), while the knockdown of KDM4B significantly downregulated cell proliferation (). Cell migration was assessed using the Transwell assay. The KDM4B overexpressed 786-O cells showed a higher percentage of migrated cells. In contrast, when KDM4B was knocked down, cell migration was inhibited (). These results confirm our hypothesis that KDM4B causes advanced disease by promoting cell proliferation and migration.
Figure 3. KDM4B promotes cell proliferation and migration. (a) Verification of overexpression and knockdown (a) 786-O and (b) Caki-1 cell lines by western blot analysis. (b) CCK-8 assays to assess cell growth. (a) KDM4B overexpressed 786-O; (b) KDM4B knockdown 786-O; (c) KDM4B overexpressed Caki-1; (d) KDM4B knockdown Caki-1. (c), (d) Transwell migration assay of 786-O cell lines. EV: empty vector.
KDM4B enhanced tumour growth and metastasis in vivo
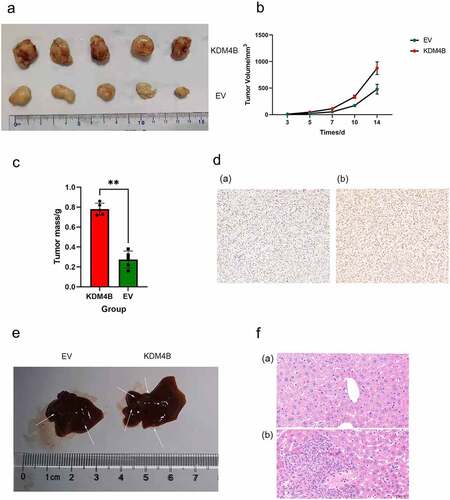
We examined whether KDM4B promotes tumour growth and metastasis in vivo. KDM4B overexpressed and control 786-O cells were injected subcutaneously into nude mice for the xenograft assays. Four weeks after transplantation, the mouse tumours were collected and analysed. IHC of xenograft tumours confirmed elevated levels of KDM4B (). We observed that tumours overexpressing KDM4B were significantly heavier than tumours in the control groups (, c, p < 0.01). We also measured the growth curves of tumours on days three, five, seven, 10, and 14 and observed that tumours overexpressing KDM4B presented with more progressive growth than control tumours (). In some of these mice, we found that those transplanted with KDM4B overexpressed cells had more liver metastatic nodules than those transplanted with control cells (). These nodules were further confirmed by H&E staining (). Therefore, these results provide further evidence that KDM4B enhances tumour growth and metastasis in vivo.
Figure 4. KDM4B promotes tumour growth and metastasis in vivo. (a) Tumors grown in xenograft mice from KDM4B overexpressed and control 786-O cell lines at 28 days. (b) Tumor growth curves of EV and KDM4B overexpressed groups. (c) Weight of KDM4B overexpressing tumours and control tumours of xenograft mice. (d) Representative IHC of xenograft tumours of (a) Control group and (b) KDM4B overexpressing group. (e) Livers from xenograft mice. Visible metastases on the liver are marked with arrows. (f) H&E staining of the livers. (a) Normal liver and (b) liver with metastasis. (EV: empty vector).
KDM4B altered copy number of genes and activated cell cycle progression
To further explore the mechanism by which KDM4B promotes ccRCC progression, we performed a single-sample GSEA (ssGSEA) analysis of 531 bulk-sequencing tumour samples from the TCGA database using the 50 most representative hallmarks from the MsigDB database. The results showed that KDM4B was highly correlated with the estrogen response, mitotic spindle, myogenesis, angiogenesis, and spermatogenesis (). Additionally, some signalling pathways are highly correlated with KDM4B, such as IL-2/STAT5, p53, TGF-β, and TNF-α pathway (). To further investigate the effect of elevated levels of KDM4B on tumour cells, single-cell transcriptome sequencing data of 29,831 ccRCC cells from eight patients were enrolled in our analysis. After a standard preprocessing workflow, the cells were grouped into 11 clusters. For the significant relationship between KDM4B, mitotic spindle and assembly, and its correlation with DNA damage repair (p < 0.001, , S3D, E), copy number variation (CNV) was inferred in these cells (Figure S3A). We observed high CNV levels in the high KDM4B-expressing group (Figure S3B, C). It was also demonstrated that the high level of CNV was due to the gain rather than the loss of copy numbers (Figure S3C).
Figure 5. KDM4B and the progression of the cell cycle. (a) the correlation of KDM4B with ssGSEA results of 50 Hallmark gene sets of TCGA-KIRC datasets. (b) the UMAP plot shows 29,831 ccRCC cells were grouped into 11 clusters. (c) Mean KDM4B expression levels of different clusters. (d) the proportion of cells at different cell cycle stages in different clusters. (e) the correlation between the expression of KDM4B and cell cycle genes.
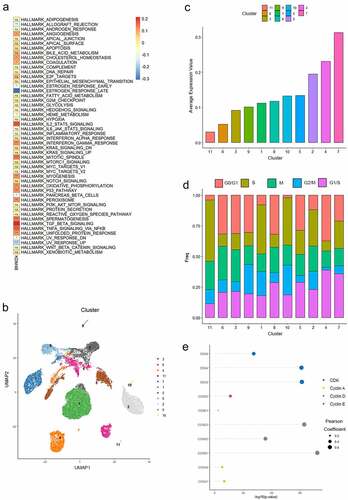
In contrast, myogenesis is closely linked to the activation of the cell cycle, both in physiological and pathological processes [Citation19–21]. Spermatogenesis is also regulated by the correct regulation of the cell cycle [Citation22]. Therefore, we hypothesized that KDM4B may be related to an aberrant cell cycle stage. The ssGSEA analysis of the TCGA database suggested that KDM4B was correlated with the cell cycle (Figure S3D), although analysis of single-cell sequencing data did not confirm this significance (Figure S3E). We then utilized Tricycle [Citation17], a cell cycle stage estimator with high accuracy and robustness, to perform cell cycle analysis on the 29,831 tumour cells. Clusters with higher KDM4B expression levels had a relatively higher proportion of cells in the G1/S transition phase. Meanwhile, the proportion of the M-phase was relatively stable among the different clusters, whereas cells in other phases showed inconsistent trends (, d). We also observed an association between KDM4B and the cell cycle proteins. KDM4B exhibited a significant and strong correlation with cyclin D and CDKs expression (). These results indicated that the effect of KDM4B on the cell cycle is focused on the G1/S transition phase.
Discussion
Epigenetics-related genes have an essential role in oncogenesis and cancer progression [Citation23,Citation24]. Notably, epigenetic abnormalities are frequently identified in renal cancer [Citation3]. For example, tumour-specific hypermethylation of the secreted frizzled-related protein 1 (SFRP1) gene and the basonuclin 1 (BNC1) gene has been associated with poorer survival in ccRCC patients [Citation25]. Other methylated genes, including GREM1, NEURL, LAD1, and NEFH, were also highly frequent in ccRCC [Citation26]. As a crucial component of epigenetics, histone demethylation modifications have been shown to have pro-cancer effects in renal cell carcinoma [Citation27]. For example, JMJD1A, which belongs to the JMJD family, was shown to be induced by HIF-1a overexpression and decreased promoter histone methylation of adrenomedullin (ADM) and growth and differentiation factor 15 (GDF15), enhancing the tumour growth of renal cancer [Citation28]. Similarly, the histone demethylase JMJD1A can be upregulated by hypoxia via HIF-1 and may be involved in tumour angiogenesis in renal cell carcinoma [Citation29]. Currently, KDM4B has been studied in other cancers. It has shown a significant cancer promotion ability in prostate [Citation7,Citation14], colorectal [Citation8,Citation30], and breast cancer [Citation10,Citation31]. However, thus far, no studies have been conducted on ccRCCs.
Our results demonstrated that KDM4B was highly expressed in tumour tissues compared with normal adjacent tissues. KDM4B was also correlated with clinicopathological characteristics, including significantly advanced stages, higher tumour grade, greater invasion of local lymph nodes, and distant metastasis. We also observed that higher KDM4B levels represented a worse prognosis for patients, as patients with higher KDM4B scores on pathology slides had significantly shorter OS. Similar analyses were performed on TCGA datasets, suggesting that KDM4B may have the potential to predict patient prognosis. This potential is similar in other types of tumours, such as osteosarcoma [Citation32] and lung adenocarcinoma [Citation33]. However, owing to the small number of samples included in this study (n = 29) studies with larger sample sizes are required to determine whether KDM4B can be used in clinical practice.
Furthermore, we explored the possible mechanisms by which KDM4B promotes tumours. We observed that KDM4B is highly related to the processes of cell division, such as mitotic spindle assembly and DNA damage repair. Previous studies have also revealed that KDM4B, as a histone demethylase, mediates increased levels of long-interspersed nuclear Element-1 expression by participating in the demethylation of H3K9, causing genomic instability and DNA damage [Citation34]. A study conducted in breast epithelial cells suggested that the demethylation of pericentromeric H3K9me3 by KDM4B causes missegregation of chromosomes and increased genomic instability [Citation35]. Our study detected increased cellular CNV levels in cells with high levels of KDM4B expression based on single-cell RNA sequencing data. This suggested a close link between high KDM4B expression and genomic instability. In addition, we did not observe a link between CNV and KDM4B expression levels of specific genes or chromosomal regions, which also indicated that KDM4B-mediated CNV may not be specific, suggesting that KDM4B-mediated genome instability is an overall effect.
We also explored whether KDM4B alters the cell cycle stages of ccRCC. Previous studies have demonstrated that the depletion of KDM4B in breast cancer leads to a blocked ER-mediated G1/S transition [Citation10]. KDM4B also regulated the expression levels of cell cycle proteins, such as CCND1 and CCNA1 in breast cancer [Citation36], and CDK6 in lung and bladder cancer [Citation12]. In addition, some drugs, such as triptolide, can cause cell cycle arrest by inhibiting expression of KDM4B [Citation37]. Consistently, our study showed that the proportion of cells at the G1/S transition increased with higher expression levels of KDM4B and that the expression levels of KDM4B were significantly and positively correlated with those of CCND1 and CCND2, demonstrating the strong association of KDM4B with the cell cycle.
However, our study had some limitations. We included a small number of patients for the clinical evaluation (n = 29), which may have biased our conclusions. This shortcoming was partially compensated by our analysis of credible public databases. Nevertheless, our study is novel in revealing the role of KDM4B in ccRCC and contributes to the development of precision medicine strategies for ccRCC.
Supplemental Material
Download Zip (2.5 MB)Disclosure statement
No potential conflict of interest was reported by the author(s).
Data availability statement
The data that support the findings of this study are available in TCGA at https://portal.gdc.cancer.gov/ and GEO at https://www.ncbi.nlm.nih.gov/geo/. Single-cell RNA sequencing data are available at https://ngdc.cncb.ac.cn/gsa-human with ID HRA000963.
Supplemental data
Supplemental data for this article can be accessed online at https://doi.org/10.1080/15592294.2023.2192319
Additional information
Funding
References
- Haake SM, Rathmell WK. Renal cancer subtypes: should we be lumping or splitting for therapeutic decision making? Cancer. 2017;123(2):200–12.
- Chen W, Zheng R, Baade PD, et al. Cancer statistics in China, 2015. Ca A Cancer J Clinicians. 2016;66(2):115–132.
- Joosten SC, Smits KM, Aarts MJ, et al. Epigenetics in renal cell cancer: mechanisms and clinical applications. Nat Rev Urol. 2018;15(7):430–451.
- Nishida J, Momoi Y, Miyakuni K, et al. Epigenetic remodelling shapes inflammatory renal cancer and neutrophil-dependent metastasis. Nat Cell Biol. 2020;22(4):465–475.
- Zhang Q, Thakur C, Shi J, et al. New discoveries of mdig in the epigenetic regulation of cancers. Semin Cancer Biol. 2019;57:27–35.
- Berry WL, Janknecht R. KDM4/JMJD2 histone demethylases: epigenetic regulators in cancer cells. Cancer Res. 2013;73(10):2936–2942.
- Sha J, Han Q, Chi C, et al. Upregulated KDM4B promotes prostate cancer cell proliferation by activating autophagy. J Cell Physiol. 2020;235(3):2129–2138.
- Li H, Lan J, Wang G, et al. KDM4B facilitates colorectal cancer growth and glucose metabolism by stimulating TRAF6-mediated AKT activation. J Exp Clin Cancer Res. 2020;39(1):12.
- Zhao L, Li W, Zang W, et al. JMJD2B promotes epithelial–mesenchymal transition by cooperating with β-catenin and enhances gastric cancer metastasis. Clin Cancer Res. 2013;19(23):6419–6429.
- Shi L, Sun L, Li Q, et al. Histone demethylase JMJD2B coordinates H3K4/H3K9 methylation and promotes hormonally responsive breast carcinogenesis. Proc Natl Acad Sci U S A. 2011;108(18):7541–7546. DOI:10.1073/pnas.1017374108
- Fu L, Chen L, Yang J, et al. HIF-1α-induced histone demethylase JMJD2B contributes to the malignant phenotype of colorectal cancer cells via an epigenetic mechanism. Carcinogenesis. 2012;33(9):1664–1673.
- Toyokawa G, Cho H-S, Iwai Y, et al. The histone demethylase JMJD2B plays an essential role in human carcinogenesis through positive regulation of cyclin-dependent kinase 6. Cancer Prev Res (Phila). 2011;4:2051–2061.
- Lee H-L, Yu B, Deng P, et al. Transforming growth factor-β-induced kdm4b promotes chondrogenic differentiation of human mesenchymal stem cells. Stem Cells. 2016;34(3):711–719.
- M-J W, Chen C-J, Lin T-Y, et al. Targeting KDM4B that coactivates c-Myc-regulated metabolism to suppress tumor growth in castration-resistant prostate cancer. Theranostics. 2021;11(16):7779–7796. DOI:10.7150/thno.58729
- Shi Y, Zhang Q, Bi H, et al. Decoding the multicellular ecosystem of vena caval tumor thrombus in clear cell renal cell carcinoma by single-cell RNA sequencing. Genome Biol. 2022;23(1):87. DOI:10.1186/s13059-022-02651-9
- Dries R, Zhu Q, Dong R, et al. Giotto: a toolbox for integrative analysis and visualization of spatial expression data. Genome Bio. 2021;22(1):78. DOI:10.1186/s13059-021-02286-2
- Zheng SC, Stein-O’brien G, Augustin JJ, et al. Universal prediction of cell-cycle position using transfer learning. Genome Bio. 2022;23(1):41.
- Oh S, Shin S, Janknecht R. The small members of the JMJD protein family: enzymatic jewels or jinxes? Biochim Biophys Acta Rev Cancer. 2019;1871(2):406–418.
- Magadum A, Singh N, Kurian AA, et al. Pkm2 regulates cardiomyocyte cell cycle and promotes cardiac regeneration. Circulation. 2020;141(15):1249–1265. DOI:10.1161/CIRCULATIONAHA.119.043067
- Bao J, Shi Y, Tao M, et al. Pharmacological inhibition of autophagy by 3-MA attenuates hyperuricemic nephropathy. Clin Sci (Lond). 2018;132(21):2299–2322.
- Hwang SY, Kang YJ, Sung B, et al. Folic acid is necessary for proliferation and differentiation of C2C12 myoblasts. J Cell Physiol. 2018;233(2):736–747. DOI:10.1002/jcp.25989
- Zhao J, Lu P, Wan C, et al. Cell-fate transition and determination analysis of mouse male germ cells throughout development. Nat Commun. 2021;12(1):6839. DOI:10.1038/s41467-021-27172-0
- Okugawa Y, Grady WM, Goel A. Epigenetic alterations in colorectal cancer: emerging Biomarkers. Gastroenterology. 2015;149(5):1204–1225.e12.
- Portela A, Esteller M. Epigenetic modifications and human disease. Nat Biotechnol. 2010;28(10):1057–1068.
- Ricketts CJ, Hill VK, Linehan WM. Tumor-specific hypermethylation of epigenetic biomarkers, including SFRP1, predicts for poorer survival in patients from the TCGA Kidney Renal Clear Cell Carcinoma (KIRC) project. PLoS ONE. 2014;9(1):e85621.
- van Vlodrop IJH, Joosten SC, De Meyer T, et al. A four-gene promoter methylation marker panel consisting of GREM1, NEURL, LAD1, and NEFH predicts survival of clear cell renal cell cancer patients. Clin Cancer Res. 2017;23(8):2006–2018. DOI:10.1158/1078-0432.CCR-16-1236
- Bianco-Miotto T, Chiam K, Buchanan G, et al. Global levels of specific histone modifications and an epigenetic gene signature predict prostate cancer progression and development. Cancer Epidemiol Biomarkers Prev. 2010;19(10):2611–2622. DOI:10.1158/1055-9965.EPI-10-0555
- Krieg AJ, Rankin EB, Chan D, et al. Regulation of the histone demethylase JMJD1A by hypoxia-inducible factor 1α enhances hypoxic gene expression and tumor growth. Mol Cell Biol. 2010;30(1):344–353.
- Guo X, Shi M, Sun L, et al. The expression of histone demethylase JMJD1A in renal cell carcinoma. Neoplasma. 2011;58(2):153–157.
- Deng W-W, Hu Q, Liu Z-R, et al. KDM4B promotes DNA damage response via STAT3 signaling and is a target of CREB in colorectal cancer cells. Mol Cell Biochem. 2018;449(1–2):81–90.
- Kawazu M, Saso K, Tong KI, et al. Histone demethylase JMJD2B functions as a co-factor of estrogen receptor in breast cancer proliferation and mammary gland development. PLoS ONE. 2011;6(3):e17830.
- Liu X, Zhang Q, Zhao Y, et al. Association of JMJD2B and Hypoxia-inducible factor 1 expressions with poor prognosis in osteosarcoma. Anal Cell Pathol (Amst). 2020;2020:2563208.
- Toyokawa G, Taguchi K, Edagawa M, et al. The prognostic impact of jumonji domain-containing 2B in patients with resected lung adenocarcinoma. Anticancer Res. 2016;36(9):4841–4846. DOI:10.21873/anticanres.11046
- Xiang Y, Yan K, Zheng Q, et al. Histone demethylase KDM4B promotes DNA damage by activating long interspersed nuclear element-1. Cancer Res. 2019;79(1):86–98. DOI:10.1158/0008-5472.CAN-18-1310
- Slee RB, Steiner CM, Herbert B-S, et al. Cancer-associated alteration of pericentromeric heterochromatin may contribute to chromosome instability. Oncogene. 2012;31(27):3244–3253. DOI:10.1038/onc.2011.502
- Yang J, Jubb AM, Pike L, et al. The histone demethylase JMJD2B is regulated by estrogen receptor α and Hypoxia, and is a key mediator of estrogen induced growth. Cancer Res. 2010;70(16):6456–6466.
- Wen L, Chen Y, Zeng L, et al. Triptolide induces cell-cycle arrest and apoptosis of human multiple myeloma cells in vitro via altering expression of histone demethylase LSD1 and JMJD2B. Acta Pharmacol Sin. 2012;33(1):109–119.