
ABSTRACT
Biochemical premature adrenarche is defined by elevated serum DHEAS [≥40 μg/dL] before age 8 y in girls. This condition is receiving more attention due to its association with obesity, hyperinsulinemia, dyslipidemia, and polycystic ovary syndrome. Nevertheless, the link between early androgen excess and these risk factors remains unknown. Epigenetic modifications, and specifically DNA methylation, have been associated with the initiation and progression of numerous disorders, including obesity and insulin resistance. The aim of this study was to determine if prepubertal androgen exposure is associated with a different methylation profile in pubertal girls. Eighty-six healthy girls were studied. At age 7 y, anthropometric measurements were begun and DHEAS levels were determined. Girls were classified into Low DHEAS (LD) [<42 μg/dL] and High DHEAS (HD) [≥42 μg/dL] groups. At Tanner stages 2 and 4 a DNA methylation microarray was performed to identify differentially methylated CpG positions (DMPs) between HD and LD groups. We observed a differential methylation pattern between pubertal girls with and without biochemical PA. Moreover, a set of DNA methylation markers, selected by the LASSO method, successfully distinguished between HD and LD girls regardless of Tanner stage. Additionally, a subset of these markers were significantly associated with glucose-related measures such as insulin level, HOMA-IR, and glycaemia. This pilot study provides evidence consistent with the hypothesis that high DHEAS concentration, or its hormonally active metabolites, may induce a unique blood methylation signature in pubertal girls, and that this methylation pattern is associated with altered glucose metabolism.
Introduction
Adrenarche denotes the gradual growth and maturation of the innermost zone of the adrenal cortex (zona reticularis), leading to increased secretion of adrenal androgen precursors (AAP), including dehydroepiandrosterone (DHEA) and its sulphate ester (DHEAS) [Citation1] [Citation2]. Premature adrenarche (PA) can be defined biochemically by an increase of circulating AAP concentrations (above the age- and sex-specific reference range) [Citation1,Citation2]. Traditionally, prematurely elevated levels are indicated by serum DHEAS concentration ≥40 μg/dL before age 8 y in girls and 9 y in boys [Citation2].
The incidence of PA is significantly higher in girls than in boys [Citation3,Citation4] and in children with higher BMI [Citation1,Citation2,Citation4]. Premature adrenarche is receiving more attention due to its association with obesity and insulin resistance [Citation1,Citation2,Citation5,Citation6]; however, the mechanistic link between early androgen excess and these risk factors remains unknown.
Epigenetic modifications, such as DNA methylation, are important determinants of gene expression and have been associated with the pathogenesis of multiple diseases, including obesity and insulin resistance [Citation7,Citation8]. Moreover, epigenetic changes are themselves influenced by environmental and lifestyle factors, and do not remain stable throughout life [Citation9]. Consequently, research on epigenetic modifications, their developmental changes, and their association with disease have become an important approach in understanding disease pathogenesis.
In this study, we investigated DNA methylation of peripheral blood cells during early and late puberty in girls who had exhibited prematurely elevated versus normal DHEAS concentrations prepubertally. Our observations identified methylation markers able to distinguish girls with and without a history of biochemically defined premature adrenarche. We also examined the association of these DNA methylation markers with glucose metabolic parameters.
Subjects, materials, and methods
Study population
Samples were originally collected to investigate the epigenetic age during pubertal development in girls. The study population for these girls has been described previously [Citation10].
Our study population included a subset of 86 girls randomly selected from the longitudinal Growth and Obesity Cohort Study (GOCS) in Santiago, Chile, initiated in 2006, comprising children ages 2.6 to 4.0 y, recruited from public nursery schools of six counties in Santiago, who met the following inclusion criteria: 1) singletons born in 2002–2003 with birthweight between 2,500 and 4,500 g and 2) absence of physical (e.g., severe injury), medical (e.g., brain tumour), or endocrine diseases (e.g., diabetes, hypopituitarism, or thyroid disease) that could alter growth and/or onset of puberty.
All parents or guardians provided written informed consent, and the subjects gave their assent. The study protocol was approved by the Ethics Committee of the Institute of Nutrition and Food Technology, University of Chile (Approval number 028–2019).
Pubertal development
At age ~7 y, a single paediatric endocrinologist (VM) assessed breast development by inspection and palpation. The sexual maturity staging criteria and definitions were as described by Marshall and Tanner (Tanner staging) [Citation11]. Thereafter, every 6 months, secondary sex characteristics were evaluated by a single female dietitian trained specifically for this purpose, with permanent supervision of a single paediatric endocrinologist (VM). Concordance for breast stages between dietitian and paediatric endocrinologist was 0.9 [Citation12].
Anthropometric, hormonal, and biochemical measurements
Birth weight (kg) and length, as well as annual height and weight measurements prior to 2006, were obtained from medical charts. After study initiation, body fat percentage was estimated at each visit by Tanita-BC-418 MA bioelectrical impedance (Tanita-Corporation, Tokyo, Japan), according to the manufacturer’s guidelines and at measurement frequency of 50 kHz (accuracy ±0.1 kg) [Citation13]. Weight and height were determined using standardized protocols (barefoot and light clothes). Sex- and age-adjusted height, weight, and BMI Z-scores at each visit were calculated based on World Health Organization (WHO) growth charts [Citation14].
DHEAS concentration was determined in an early morning fasting blood sample at ~7 y of age and during pubertal progression at Tanner breast stages 2 (T2) and 4 (T4). Mothers were contacted the day before blood sampling to confirm the absence of fever (≥37.5°C) or symptoms of acute infection in the children. Samples were analysed at the Institute of Maternal and Child Research, University of Chile. Serum DHEAS at age ~7 y was determined as previously described by competitive specific binding RIA supplied by Diagnostic System Laboratories (Webster, TX, USA) [Citation4]. Thereafter, DHEAS concentrations at T2 and T4 were analysed by liquid chromatography-mass spectrometry in a high-performance liquid chromatography (HPLC) Agilent system (Santa Clara, CA, USA) 1260 coupled to an AB Sciex 3200 Quantum ultratriple quadrupole mass spectrometer (Foster City, CA, USA).
Plasma levels of insulin (μU/mL) and glucose (mg/dL) were measured by electrochemiluminescence and colorimetric methods, respectively, at the Nutrition Laboratory of the Catholic University of Chile [Citation15]. Insulin sensitivity was estimated from fasting insulin and glucose levels using the Homoeostasis model (HOMA-IR), which has been validated in non-diabetic children and adolescents (fasting insulin [μU/mL] × fasting glucose [mg/dL]/405).
DNA methylation measurements and preprocessing
Peripheral blood buffy coat DNA methylation (DNAm) at T2 and T4 was measured in bisulphite-treated DNA using the Illumina Infinium MethylationEPIC array at the USC Epigenome Center (Los Angeles, CA).
Array data analysis was performed using R version 4.0.2. The Minfi package v1.34.0 [Citation16] was used for quality control checks at the sample level. Data were normalized using Noob for background correction and dye bias normalization from Minfi [Citation16] and BMIQ (beta mixture quantile normalization) from WateRmelon package v1.32.0 [Citation17]. We filtered out probes containing detection p-values >0.01 in one or more samples, on Y sex chromosome, cross-hybridizing probes, non-cg probes, and probes that lie near single nucleotide polymorphisms [Citation18]. A total of 705,792 probes were available for further analysis.
A beta value was calculated for each locus as the ratio of methylated signal intensity to the sum of unmethylated and methylated signal intensities, with a range from 0 to 1 (proportion methylated). The beta values were log transformed into the corresponding M values, which were used for all analyses. Beta values only were reported in figures and tables for easy interpretation [Citation19].
Estimated cell proportions (CD8+ T cells, CD4+ T cells, natural killer cells, B cells, monocytes, and granulocytes) were calculated using the Houseman approach [Citation20] implemented in Minfi package. CpG sites were assigned to chromosomes, locations, and genes using the Illumina manifest for the EPIC array (hg19 genome reference).
Multidimensional scaling (MDS) was performed to examine sources of variation using the MDS plot function in the Minfi package. Since DNA methylation data were from two different plates, the M values were corrected for the effects of plate batch using removeBatchEffect function from Limma package [Citation21].
Statistical analyses
A mixed model design was used to identify differentially methylated CpG positions (DMPs) between high and low DHEAS groups in paired samples from Tanner stages 2 and 4, adjusted for cell subtype composition (model 1). Age at DHEAS measurement was also included as a covariate in the model (model 2).
For both models, we applied a robust regression to down-weight the influence of outliers, in conjunction with an empirical Bayes method to moderate standard errors, both implemented in the R Limma package. To account for the Tanner 2 and Tanner 4 measurements from the same girl, the intra-sample correlation was first calculated by the duplicate Correlation function in the Limma package. We corrected for multiple testing using the False Discovery Rate (adjusted p-value <0.05) according to the Benjamini and Hochberg method [Citation22].
To identify the strongest DNA methylation markers, a Least Absolute Shrinkage and Selection Operator (LASSO) regression was performed. LASSO regression, which involves a shrinkage process to identify variables strongly associated with variables corresponding to the target, adds a penalty equal to the absolute value of the magnitude of coefficients. Coefficients that become zero are eliminated from the model, which allows identification of CpGs that were significantly associated with antecedent premature adrenarche. The optimal parameter ‘lambda,’ obtained using 10-fold cross-validation, is a penalty parameter; cross validation indicates the variables and coefficients from the best model.
The CpG site selection was performed on the training set, considering the previously identified DMPs (FDR < 0.05) and anthropometric, hormonal, and biochemical variables, using the glmnet package v4.0–2. The training set of 64 paired samples (128 totals) was randomly selected, including 13 HD girls and 51 LD girls. Remaining paired samples (n = 22) were used as a test set. The performance of the 31-CpG methylation biomarkers was tested by sensitivity and specificity on the test set; the sensitivity was calculated as the number of HD girls that were correctly classified, divided by all HD girls, and the specificity was calculated as the number of LD correctly classified, divided by all LD individuals. The classification model, including 31 discriminating CpG sites, was assessed graphically using Heatmap based on the Manhattan metric. Finally, a classification prediction model was constructed using a logistic regression method.
The p-value distribution of all the CpG sites was compared to the theoretical distribution using a quantile-quantile plot and the genomic inflation factor lambda. The genomic inflation factor lambda was calculated by dividing the median of observed chi-square statistics by the median of theoretical chi-square statistics with 1 degree of freedom [Citation23], which quantified the systematic bias of test statistic.
Correlations between differentially methylated CpGs and glucose metabolic variables at T1, T2, and T4 were tested using Spearman coefficients as implemented in R. Quantitative variable comparisons between the LD and HD groups were determined with the nonparametric Wilcoxon’s test.
Results
Cohort description
The DNA Methylation Microarray Data included 86 girls. To evaluate the relationship between serum DHEAS and DNA methylation changes through puberty, two blood samples were taken from each participant, one sample at T2 and the other at T4 (172 samples, ).
Figure 1. Flow chart of the study design. LD= Low DHEAS, HD= High DHEAS.
At age of recruitment, girls from the LD group were younger than those of the HD group (p-value = 0.043), and we therefore adjusted for age at recruitment in the Methylation Analysis. The groups did not differ in BMI SD or fat percentage at birth or at age of classification (Suplementary Table S1). The clinical data of the 86 girls at the pubertal stage assessments are shown in . Notably, the DHEAS difference at the Tanner stage 1 grouping into high and low DHEAS persisted throughout pubertal development (Tanner stages 2 and 4, Supplementary Figure S1).
Table 1. Clinical and anthropometric characteristics of 86 girls by DHEAS levels at Tanner 2 and 4.
Identifying differentially methylated CpGs at breast Tanner stage 2 and 4
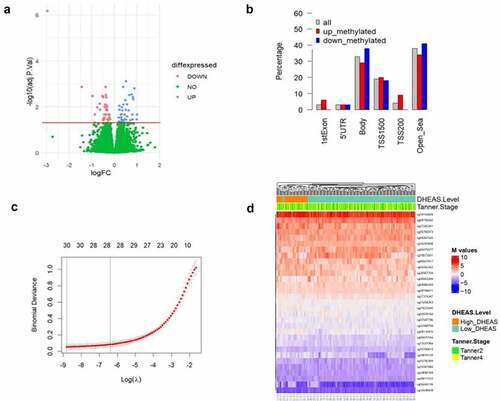
To identify DNA methylation markers associated with DHEAS concentration that had a consistent profile across puberty, we performed a differential methylation analysis between LD and HD group paired samples. The study flowchart is presented in . In model 1, we detected a total of 69 DMPs (λ inflation factor = 1.12) able to discriminate HD girls from LD girls in both Tanner stages (), of which 35 were up-methylated and 34 were down-methylated. Regarding the location of DMPs in relation to genes (), 33% were in gene body and 26% were in promoter regions (TSS200, TSS1500, and 5‘UTR). The percentage at promoter regions was higher for up-methylated sites (31%) than down-methylated sites (21%). DMP lists are available in Supplementary Table S2.
Figure 2. (a) Volcano plot showing differences in methylation between LD and HD groups (in 86 paired samples). Significant (FDR = 5%) DMPs are shown in red (down-methylated) and blue (up-methylated). The y axis shows –log10 P values and the x axis plots the mean difference in methylation M values. The horizontal line denotes significant CpGs at an FDR of 5%. (b) Location of DMPs relative to genomic location: 1st exon, 5’UTR (5’ untranslated region), gene body, TSS1500 (200–1500 bp upstream of the transcription start site), TSS200 (0–200 bp upstream of the transcription start site) and open sea (DNA methylation sites outside the CpG island regions). (c) Binomial Deviance of the LASSO model with different log, identification of the most appropriate log λ value (penalization coefficient) in the LASSO model, with 10-fold cross validation the optimal lambda was 0.00015. Numbers along the top x-axis represent the average number of predictors. (d) Heat map of unsupervised hierarchical clustering of the 31 sites of the 86 paired samples. Each column represents a girl DNA sample; each row represents a gCpg site; red and blue colors indicates DNA methylation levels as M value. The horizontal distances on each branch of the dendrogram represent the degree of similarity between DNA methylation profiles of the two DHEAS groups. logFC= Log fold change at base 2.
This list was further extended to 178 DMPs in model 2, when age at T1 was included as a covariate in the model (Supplementary Table S3), however the inflation factor was higher than in model 1 (λ inflation factor = 1.16) (Supplementary Fig S2A).
CpG candidate selection
The inflation factor lambda implied slight inflation of p-values. To improve the selection of CpGs and identify potential markers of high DHEAS, we performed a LASSO regression analysis. First, the paired samples were split randomly into training and testing groups at a 3:1 ratio. After splitting, we obtained a training group containing 64 samples and a testing group containing 22 samples. Then, we used the LASSO method in the trained set to further decrease the number of markers, considering the 69 DMPs resulting from model 1 (). CpGs with non-zero coefficients in the LASSO regression model were selected for further analysis. After LASSO, we obtained 31 methylation sites that could discriminate between LD and HD girls (Supplementary Table S4). Unsupervised hierarchical clustering of these 31 markers confirmed discrimination between LD and HD girls by the selected DMPs ().
To test these 31 sites as potential markers, we calculated the classification accuracy of the proposed model. As part of analysing the model performance, 75% of the data was taken for training, and 25% was taken for testing. Among the test group of 22 girls at Tanner 2 and 4 (44 samples), the classification sensitivity and specificity were 100% and 100% in HD girls, respectively. The confusion matrix generated out of the predicted variables is shown in . Next, we tested the performance of these 31 markers in the 86 girls (test and training groups, 172 samples), and the classification sensitivity and specificity reached 100% and 100%, respectively (); showing that these 31 DNA methylation markers could significantly distinguish T2 or T4 girls with a history of HD at age 7.
Table 2. Confusion table of the test group and performance of predictive CpG sets.
Table 3. Confusion table of the 86 paired samples and performance of predictive CpG sets.
We also performed this approach with 178 DMPs from model 2 and obtained 41 markers. However, using this subset of probes the samples did not correctly classify the respective groups by unsupervised hierarchical clustering as with model 1. Furthermore, the performance was inferior to model 1, yielding 80% sensitivity and 100% specificity in the test samples (Supplementary Figure S2). Therefore, model 2 results were not considered in further analyses.
Association between DMPs and glucose metabolic variables
Of the 31 DNA methylation markers, 16 were located within genes and 14 were close to genes (188 bp−145 Kbp). A literature search indicated that eight of these genes are associated with hyperandrogenism conditions or related to glucose metabolism (). The remaining DNA methylation markers, without mentioned literature link, were excluded from subsequent analysis.
Table 4. CpG sites related by literature review related to hormonal or metabolic parameters.
Reference genome: hg19/GRCh37
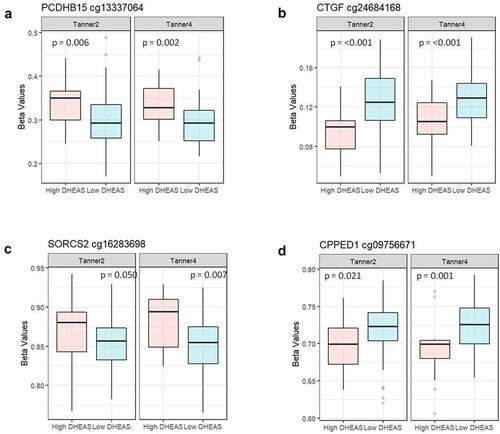
Based on literature review indicating linkage with PA, we selected 8 of the 31 DNA methylation markers for exploratory analysis of whether methylation at these sites showed associations with glucose metabolic variables. We observed that methylation at four of the CpG sites at T2 and/or T4 in our cohort was significantly associated with glucose parameters (insulin, HOMA, or glycaemia, measured at age 7 y, T2, and/or T4) (). No association remained significant after Benjamini-Hochberg correction for multiple testing; all correlations for each time point are shown in Supplementary Table 5. To compare the methylation level at these four CpG sites between LD and HD groups, the nonparametric Wilcoxon test of methylation at these four CpG sites was conducted (). Except for the cg16283698 site at Tanner 2, the other sites showed significant differences between the LD and HD groups at both T2 and T4.
Figure 3. A scatter plot of the Spearman correlation between methylation beta value at (a). cg13337064 (PCDHB15) at T2 and HOMA or insulin at T2. (b). cg24684168 (CTGF) at T2 and glycemia at T2. (c). cg16283698 (SORCS2) at T4 and HOMA at T1. d. cg09756671 (CPPED1) at T4 and glycemia at T4.
Figure 4. Boxplot comparison of methylation levels between DHEAS groups at Tanner stages 2 and 4. (a) cg13337064 (PCDHB15) (b) cg24684168 (CTGF) (c) cg16283698 (SORCS2) (d) cg09756671 (CPPED1). Differences were tested using Wilcoxon test.
CpG biomarkers and anthropometrics variables
To reduce the numbers of DNA methylation markers, we tested if anthropometric variables could contribute to the model. We repeated the LASSO analysis considering the 31 previously identified markers and birth weight, age, BMI-for-age, and body fat percentage at T1, T2, and T4. This reduced the number of CpG markers from 31 to 23 CpGs in the full model and the model including birth weight.
Discussion
This exploratory study showed a differential methylation pattern between pubertal girls with and without biochemical PA, and this effect was consistent across the early and late pubertal time-points examined. Indeed, a set of DNA methylation markers, selected by the LASSO method, successfully distinguished between HD and LD girls regardless of Tanner stage.
Altered DNA methylation patterns have previously been reported in animal models after exogenous DHEAS administration [Citation35,Citation36], and observations in humans also suggest that androgens may induce epigenetic modification [Citation37–39]. Interestingly, DHEA treatment of addicts has been shown to reverse their altered DNA methylation pattern on peripheral white blood cells [Citation40]. These observations suggest an impact of the androgen precursors DHEA and DHEAS, or of their active androgen and/or oestrogen metabolites, on DNA methylation. Further evidence suggests that androgens may induce epigenetic modifications by affecting the expression of DNA methyltransferase (DNMT) or by histone modifications [Citation38,Citation41]. Based on these earlier findings and our own observations, we hypothesize that biochemical PA may have induced the differential DNA methylation seen in the current study. However, our observational evidence of an association between biochemical PA and DNA methylation does not, by itself, allow assessment of causality.
We further explored potential associations between the differentially methylated CpG sites in our study and genes linked to disorders or markers of abnormal glucose metabolism. Literature review of genes associated with the 31 differentially methylated sites indicated eight such genes (). Among the exploratory association analyses, four CpGs (from the eight genes) showed a significant correlation between measures of glucose metabolism in our cohort and the level of DNA methylation.
Additionally, these four CpG sites showed significant differences between LD and HD groups at T2 and/or T4. Although there is overlap between the groups, the magnitude of the difference in methylation levels between groups can vary according to the tissue in which it was measured. This was observed by Crujeiras and co-workers, who found that the methylation map of circulating leukocytes mirrors the subcutaneous adipose DNA methylation profile between obese and non-obese individuals [Citation42]. Therefore, the difference found in blood cells could be even higher in other important tissues.
The CpG site cg13337064, for which methylation status at Tanner 2 correlated with HOMA-IR and insulin level at Tanner 1 (), is in exon 1 of gene PCDHB15 (Gene ID: 56121). It has recently been shown that PCDHB15 can be epigenetically silenced via promoter methylation [Citation43].
The CpG site cg24684168, for which methylation status at Tanner 2 correlated inversely with glycaemia at Tanner 1 (), is located at exon 3 of gene CTGF (Gene ID: 100194970). Several studies have shown that DNA methylation regulates CTGF expression [Citation44–46].
The CpG site cg16283698, for which methylation status at Tanner 4 correlated inversely with HOMA-IR at Tanner 1 (), is located at intron 3 of gene SORCS2 (Gene ID: 57537). A specific methylation pattern of this gene was observed in children at risk for obesity associated with maternal BMI [Citation33].
The CpG site cg09756671, for which methylation status at Tanner 4 correlated with glycaemia at Tanner 1 (), is located upstream of gene CPPED1 (Gene ID: 553139). Downregulation of CPPED1 expression increased glucose uptake in adipose tissue [Citation32].
Premature adrenarche in girls is associated with abnormalities of glucose metabolism, including hyperinsulinism in pre-puberty and puberty [Citation5,Citation6], increased prevalence of hyperglycaemia during puberty [Citation47], and higher HOMA-IR and prevalence of insulin resistance in young adulthood [Citation48], but the causality for these associations is controversial. Increased BMI has been hypothesized to cause both insulin resistance and premature adrenarche [Citation6,Citation48]. Interestingly, when we include girls’ anthropometric variables with the DNA methylation markers, the LASSO method selected birth weight as the only informative anthropometric variable. Studies in two large UK cohorts [Citation49,Citation50] also showed that low birth weight was associated with higher adrenal androgen levels at 8 (347 girls) and 9 (101 girls) y old, respectively [Citation51]. Moreover, those children with rapid postnatal catch-up weight gain exhibited higher adrenal androgen levels. To these observations, we add the association with differential methylation of CpG sites in girls with biochemical PA. Because DNA methylation patterns have highly variable spatio-temporal dynamics, longitudinal evaluation at multiple time points would be required to determine the temporal relationship between the observed epigenetic pattern and elevated DHEAS levels. Such studies may indicate whether the observed epigenetic patterns are a likely cause or a consequence of elevated DHEAS levels and the associated abnormalities of glucose metabolism.
Limitations of this study include its relatively small sample size, exploratory nature, and limited sampling points, and the need for validation in an external, independent, and larger cohort. However, the study benefits from a prospective and unique paediatric cohort in which data on a large array of variables have been acquired.
In summary, data from this pilot study are consistent with the hypothesis that DHEAS concentration may induce a unique blood methylation signature in girls with premature adrenarche – and that this signature remains consistent from Tanner stage 2 to 4. Furthermore, the observed associations with measures of glucose metabolism suggest that DNA methylation markers may be a causal link between premature adrenarche and its reported association with insulin resistance. Further studies will be necessary to confirm these hypotheses and their potential pathophysiologic significance.
Supplemental Material
Download Zip (325.3 KB)Acknowledgments
We thank all the children participating in the GOCS cohort. The genotyping of GOCS was performed at the Spanish National Cancer Research Centre, in the Human Genotyping lab, a member of CeGen, PRB3, and is supported by grant PT17/0019, of the PE I+D+i 2013-2016, funded by ISCIII and ERDF.
Disclosure statement
The authors declare that there are no actual or perceived conflicts of interest that could prejudice the impartiality of the research reported or any financial or other potential conflict of interest.
Data availability statement
The data that support the findings of this study are available from the corresponding author (VM) upon reasonable request.https://repositorio.uchile.cl/handle/2250/183290
Supplementary material
Supplemental data for this article can be accessed online at https://doi.org/10.1080/15592294.2023.2200366.
Additional information
Funding
References
- Ibáñez L, Dimartino-Nardi J, Potau N, et al. Premature adrenarche—normal variant or forerunner of adult disease? Endocrine Reviews. 2000;21(6):671–12.
- Utriainen P, Laakso S, Liimatta J, et al. Premature adrenarche–a common condition with variable presentation. Hormone Res Paediatrics. 2015;83(4):221–231.
- Mäntyselkä A, Jääskeläinen J, Lindi V, et al. The presentation of adrenarche is sexually dimorphic and modified by body adiposity. J Clin Endocrinol Metab. 2014;99(10):3889–3894.
- Pereira A, Iñiguez G, Corvalan C, et al. High DHEAS is associated with earlier pubertal events in girls but not in boys. J Endocr Soc. 2017;1(7):800–808.
- Utriainen P, Jääskeläinen J, Romppanen J, et al. Childhood metabolic syndrome and its components in premature adrenarche. J Clin Endocrinol Metab. 2007;92(11):4282–4285.
- Kaya G, Yavas Abali Z, Bas F, et al. Body mass index at the presentation of premature adrenarche is associated with components of metabolic syndrome at puberty. Eur J Pediatr. 2018;177(11):1593–1601.
- Samblas M, Milagro FI, Martínez A. DNA methylation markers in obesity, metabolic syndrome, and weight loss. Epigenetics. 2019;14(5):421–444.
- Ling C, Rönn T. Epigenetics in human obesity and type 2 diabetes. Cell Metab. 2019;29(5):1028–1044.
- Jaenisch R, Bird A. Epigenetic regulation of gene expression: how the genome integrates intrinsic and environmental signals. Nature Genet. 2003;33(S3):245–254.
- Binder AM, Corvalan C, Mericq V, et al. Faster ticking rate of the epigenetic clock is associated with faster pubertal development in girls. Epigenetics. 2018;13(1):85–94.
- Marshall WA, Tanner JM. Variations in pattern of pubertal changes in girls. Arch Dischildhood. 1969;44(235):291–303.
- Pereira A, Garmendia ML, González D, et al. Breast bud detection: a validation study in the Chilean growth obesity cohort study. BMC Women’s Health. 2014;14(1):96.
- Cediel G, Corvalán C, Aguirre C, et al. Serum 25-Hydroxyvitamin D associated with indicators of body fat and insulin resistance in prepubertal Chilean children. Int J Obesity. 2005;40(1):147–152.
- de Onis M, Garza C, Victora CG, et al. The WHO Multicentre growth reference study: planning, study design, and methodology. Food Nutr Bull. 2004;25(1 Suppl):S15–26.
- Gungor N, Saad R, Janosky J, et al. Validation of surrogate estimates of insulin sensitivity and insulin secretion in children and adolescents. J Paediatr. 2004;144(1):47–55.
- Aryee MJ, Jaffe AE, Corrada-Bravo H, et al. Minfi: a flexible and comprehensive Bioconductor package for the analysis of Infinium DNA methylation microarrays. Bioinformatics. 2014;30(10):1363–1369.
- Pidsley RY, Wong CC, Volta M, et al. A data-driven approach to preprocessing Illumina 450K methylation array data. BMC Genomics. 2013;14(1):293.
- Pidsley R, Zotenko E, Peters TJ, et al. Critical evaluation of the Illumina MethylationEPIC BeadChip microarray for whole-genome DNA methylation profiling. Genome Bio. 2016;17(1):208.
- Du P, Zhang X, Huang CC, et al. Comparison of Beta-value and M-value methods for quantifying methylation levels by microarray analysis. BMC Bioinf. 2010;11(1):587.
- Houseman EA, Accomando WP, Koestler DC, et al. DNA methylation arrays as surrogate measures of cell mixture distribution. BMC Bioinf. 2012;13(1):86.
- Ritchie ME, Phipson B, Wu D, et al. Limma powers differential expression analyses for RNA-sequencing and microarray studies. Nucleic Acids Res. 2015;43(7):e47.
- Benjamini Y, Hochberg Y. Controlling the false discovery rate: a practical and powerful approach to multiple testing. J R Stat Soc Ser B. 1995;57:289–300.
- Guintivano J, Shabalin AA, Chan RF, et al. Test-statistic inflation in methylome-wide association studies. Epigenetics. 2020;15(11):1163–1166.
- Ubba V, Soni UK, Chadchan S, et al. RHOG-DOCK1-RAC1 signaling axis is perturbed in DHEA-induced polycystic ovary in rat model. Reprod Sci. 2017;24(5):738–752.
- Ustinova M, Ansone L, Silamikelis I, et al. Whole-blood transcriptome profiling reveals signatures of metformin and its therapeutic response. PLoS ONE. 2020;15(8):e0237400. DOI:10.1371/journal.pone.0237400
- Wu Y, Wang W, Jiang W, et al. An investigation of obesity susceptibility genes in Northern han Chinese by targeted resequencing. Medicine. 2017;96(7):e6117.
- Scholl UI, Stölting G, Nelson-Williams C, et al. Recurrent gain of function mutation in calcium channel CACNA1H causes early-onset hypertension with primary aldosteronism. Elife. 2015;4:e06315.
- Daniil G, Fernandes-Rosa FL, Chemin J, et al. CACNA1H mutations are associated with different forms of primary aldosteronism. EBioMedicine. 2016;13:225–236.
- Nanba K, Blinder AR, Rege J, et al. Somatic CACNA1H mutation as a cause of aldosterone-producing adenoma. Hypertension. 2020;75(3):645–649. DOI:10.1161/HYPERTENSIONAHA.119.14349
- Wang D, Wang W, Liang Q, et al. DHEA-induced ovarian hyperfibrosis is mediated by TGF-β signaling pathway. J Ovarian Res. 2018;11(1):6.
- Zhang H, Li A, Zhang W, et al. High glucose-induced cytoplasmic translocation of Dnmt3a contributes to CTGF hypo-methylation in mesangial cells. Biosci Rep. 2016;36(4):e00362.
- Vaittinen M, Kaminska D, Käkelä P, et al. Downregulation of CPPED1 expression improves glucose metabolism in vitro in adipocytes. Diabetes. 2013;62(11):3747–3750.
- Oelsner KT, Guo Y, To SB, et al. Maternal BMI as a predictor of methylation of obesity-related genes in saliva samples from preschool-age Hispanic children at-risk for obesity. BMC Genomics. 2017;18(1):57.
- Wang WJ, Huang R, Zheng T, et al. Genome-wide placental gene methylations in gestational diabetes mellitus, fetal growth and metabolic health biomarkers in cord blood. Front Endocrinol. 2022;13:875180.
- Eini F, Novin MG, Joharchi K, et al. Intracytoplasmic oxidative stress reverses epigenetic modifications in polycystic ovary syndrome. Reprod Fertil Dev. 2017;29(12):2313–2323.
- Eini F, Bidadkosh A, Nazarian H, et al. Thymoquinone reduces intracytoplasmic oxidative stress and improves epigenetic modification in polycystic ovary syndrome mice oocytes, during in-vitro maturation. Mol Reprod Dev. 2019;86(8):1053–1066.
- Qu F, Wang FF, Yin R, et al. Molecular mechanism underlying ovarian dysfunction of polycystic ovary syndrome: hyperandrogenism induces epigenetic alterations in the granulosa cells. J Mol Med (Berl). 2012;90(8):911–923. DOI:10.1007/s00109-012-0881-4
- Salinas I, Sinha N, Sen A. Androgen-induced epigenetic modulations in the ovary. J Endocrinol. 2021;249(3):R53–64.
- Pallotti F, Senofonte G, Konstantinidou F, et al. Epigenetic effects of gender-affirming hormone treatment: a pilot study of the ESR2 promoter’s methylation in AFAB People. Biomedicines. 2022;10(2):459. DOI:10.3390/biomedicines10020459
- Lax E, Warhaftig G, Ohana D, et al. A DNA methylation signature of addiction in T cells and its reversal with DHEA intervention. Front Mol Neurosci. 2018;11:322.
- Gravina GL, Marampon F, Piccolella M, et al. Hormonal therapy promotes hormone-resistant phenotype by increasing DNMT activity and expression in prostate cancer models. Endocrinology. 2011;152(12):4550–4561. DOI:10.1210/en.2011-1056
- Crujeiras AB, Diaz-Lagares A, Sandoval J, et al. DNA methylation map in circulating leukocytes mirrors subcutaneous adipose tissue methylation pattern: a genome-wide analysis from non-obese and obese patients. Sci Rep. 2017;7(1):41903. DOI:10.1038/srep41903
- Chiang CC, Lin GL, Yang SY, et al. PCDHB15 as a potential tumor suppressor and epigenetic biomarker for breast cancer. Oncol Lett. 2022;23(4):117. DOI:10.3892/ol.2022.13237
- Zhang H, Cai X, Yi B, et al. Correlation of CTGF gene promoter methylation with CTGF expression in type 2 diabetes mellitus with or without nephropathy. Mol Med Rep. 2014;9(6):2138–2144.
- Shi C, Li G, Tong Y, et al. Role of CTGF gene promoter methylation in the development of hepatic fibrosis. Am J Transl Res. 2016;8(1):125–132.
- Zhang L, Zhao F, Yang C, et al. Hypomethylation of CTGF promoter in placenta and peripheral blood of pre-eclampsia women. Reprod Sci. 2020;27(2):468–476.
- Pereira A, Merino PM, Santos JL, et al. High DHEAS in girls and metabolic features throughout pubertal maturation. Clinical Endocrinol. 2022;96(3):419–427.
- Liimatta J, Utriainen P, Laitinen T, et al. Cardiometabolic risk profile among young adult females with a history of premature adrenarche. J Endocr Soc. 2019;3(10):1771–1783.
- Clark PM, Hindmarsh PC, Shiell AW, et al. Size at birth and adrenocortical function in childhood. Clinical Endocrinol. 1996;45(6):721–726.
- Ong KK, Potau N, Petry CJ, et al. Opposing influences of prenatal and postnatal weight gain on adrenarche in normal boys and girls. J Clin Endocrinol Metab. 2004;89(6):2647–2651. DOI:10.1210/jc.2003-031848.
- Francois I, de Zegher F, De Zegher F. Adrenarche and fetal growth. Pediat Res. 1997;41(3):440–442.