
ABSTRACT
N6-Methyladenosine (m6A) plays key roles in the regulation of biological functions and cellular mechanisms for ischaemia reperfusion (IR) injury in different organs. However, little is known about the underlying mechanisms of m6A-modified mRNAs in hepatic IR injury. In mouse models, liver samples were subjected to methylated RNA immunoprecipitation with high-throughput sequencing (MeRIP-seq) and RNA sequencing (RNA-seq). In total, 16917 m6A peaks associated with 4098 genes were detected in the sham group, whereas 21,557 m6A peaks associated with 5322 genes were detected in the IR group. There were 909 differentially expressed m6A peaks, 863 differentially methylated transcripts and 516 differentially m6A modification genes determined in both groups. The distribution of m6A peaks was especially enriched in the coding sequence and 3‘UTR. Furthermore, we identified a relationship between differentially m6A methylated genes (fold change≥1.5/≤ 0.667, p value≤0.05) and differentially expressed genes (fold change≥1.5 and p value≤0.05) to obtain three overlapping predicted target genes (Fnip2, Phldb2, and Pcf11). Our study revealed a transcriptome-wide map of m6A mRNAs in hepatic IR injury and might provide a theoretical basis for future research in terms of molecular mechanisms.
Introduction
N6-Methyladenosine (m6A), an epigenetic regulatory mechanism, serves as the most prevalent RNA posttranscriptional modification and can control gene expression in eukaryotic cells [Citation1]]. Dynamic m6A modification plays important roles in many normal biological processes, including stem cell differentiation and renewal, tissue development, circadian rhythms, heat shock, DNA damage and sex determination [Citation2,Citation3]. The consensus sequence of m6A modification occurs mostly at the N6 position of adenosine in the RRACH motif (R=G/A; H=A/C/U; A is the m6A site). Moreover, m6A sites tend to be enriched around stop codons in 3’ untranslated regions (3’UTRs) and internal long exons [Citation4].
Recent studies have shown that core enzymes of m6A modification consist of three parts, including methyltransferases (writers), demethylases (erasers) and m6A binding proteins (readers) [Citation5,Citation6]. Writers are methyltransferase complexes that can catalyse the transfer of methyl groups to adenosine nucleobases. The core complex is composed of methyltransferase-like 3 (METTL3), methyltransferase-like 14 (METTL14), Wilms tumour 1 associated protein (WTAP) and KIAA1429 [Citation7,Citation8]. Erasers refer to two demethylases, AlkB homolog 5 (ALKBH5) and fat mass and obesity-associated protein (FTO), which can actively remove m6A methylation, thus forming dynamic regulation under different physiological and pathological conditions [Citation9]. Readers are m6A binding proteins that can mediate m6A functions by recognizing and binding target mRNAs, such as YTH domain-containing proteins (YTHDF1, YTHDF2, YTHDF3) and insulin-like growth factor 2 mRNA-binding proteins (IGF2BPs; including IGF2BP1/2/3) [Citation10,Citation11]. Through physical interaction with RNA transcripts, RNA binding proteins can regulate alternative splicing, structure switching, stability, nuclear export, microRNA maturation, translation and chromosome inactivation [Citation12].
Hepatic ischaemia reperfusion injury (IRI) is a complex clinical complication during partial hepatic resection, abdominal trauma and liver transplantation that may lead to cell damage and dysfunction [Citation13]. The characteristics of hepatic ischaemia reperfusion include an initial transient disruption of blood supply and a subsequent restoration of perfusion and reoxygenation. Reactive oxygen species (ROS), reactive nitrogen species (RNS), proinflammatory immunocytes, mitochondrial dysfunction, calcium overload and apoptosis are involved in pathophysiological events [Citation14,Citation15]. The relevant signalling pathways of hepatic IRI mainly focus on regulating inflammatory response, apoptosis, oxidative stress and other aspects. Therefore, in order to achieve more effective mitigation and containment of hepatic IRI, we should focus on signalling pathways that can regulate the above pathological mechanisms, such as PPAR, PI3K-AKT-mTOR, NF-κB, Wnt/β-catenin, IL-17 as well as others. To date, there is no effective treatment tailored for each individual due to the rather complicated pathophysiologic mechanisms of hepatic IRI. Better and more effective therapeutic targets are urgently needed. Many studies have found that RNA m6A methylation is involved in the regulation of IRI in different organs [Citation16–18]. However, the specific potential roles of m6A-modified transcripts and molecular mechanisms in hepatic IRI remain unclear.
In this study, we profiled the transcriptome-wide m6A distribution of hepatic IRI by using methylated RNA immunoprecipitation sequencing (MeRIP-seq). Furthermore, we identified significant differentially methylated peaks within mRNAs and differentially expressed mRNAs. Then, we further probed the inner relationship and functional implications between differentially methylated genes and differentially expressed genes.
Materials and methods
Animals
A total of 14 male mice (8-week-old C57BL/6) were purchased from Charles River Lab Animal Center (Beijing, China), ten of which were randomly divided into the hepatic IR group and the sham group (five mice per group). All experimental procedures and care administered to the animals were conducted in accordance with regulations and guidelines and were approved by the Ethics Committee of The First Affiliated Hospital of Harbin Medical University (No. 2021087).
Hepatic IR model and specimen collection
The hepatic IR procedures in mice were described previously [Citation19]. First, the mice were anesthetized by intraperitoneal injection of sodium pentobarbital (60 mg/kg), and a midline laparotomy incision was performed. Then, an atraumatic clip was used to clamp the left lateral and median lobes of the liver at its base allowing perfusion to right lateral and caudate lobes (about 70% of the blood supplied to the liver). The hepatic IR group was subjected to 90 minutes of ischaemia, followed 6 hours of reperfusion by removing the vascular clamp. The sham group underwent laparotomy and the same operative procedures of the hepatic hila without clamping vessels. Mice were sacrificed at 6 h after reperfusion to collect serum and liver samples.
The serum and liver samples collected were further analysed, including serial serum tests, histological examinations [Citation20,Citation21], terminal deoxynucleotidyl transferase dUTP nick-end labelling (TUNEL) assays, total m6A levels, caspase-3 activity assays, DNA fragmentation ELISAs [Citation22], and quantitative real-time polymerase chain reaction (qRT‒PCR) analyses. A series of related experiments were carried out with mouse primary hepatocytes isolated by a two-step collagenase perfusion method.
Cell culture and Hypoxia/Reoxygenation (H/R) treatment
The mouse primary hepatocytes were cultured in the Dulbecco’s modified Eagle’s medium (DMEM) containing 10% foetal bovine serum, 100 U/mL penicillin and 100 μg/mL streptomycin. The cultures were incubated at 37°C in a humidified air incubator (5% CO2) [Citation23]. To establish the H/R model, cells were cultured in sugar-free serum-free DMEM and exposed to hypoxia containing 5% CO2, 1% O2, and 94% N2 for 6 hours, followed by 6 hours of reoxygenation with 5% CO2, 21% O2, and 74% N2, and cultured in DMEM containing 10% foetal bovine serum, 100 U/mL penicillin and 100 μg/mL streptomycin.
RNA MeRIP-seq library construction and sequencing
RNA samples were checked for quality by agarose gel electrophoresis and quantified with a Nanodrop ND-1000 spectrophotometer. Total RNA (60 µg) was extracted from mouse liver samples using TRIzol reagent (Ambion) according to the manufacturer’s protocol. Five biological replicates were performed for the IR and sham groups, and five liver samples per IR group or sham group were pooled to achieve 60 µg of RNA. The intact mRNA was enriched while rRNA was deleted using the oligo dT method, and the mRNA was isolated from total RNA samples using the Arraystar Seq-StarTM poly(A) mRNA Isolation Kit according to the manufacturer’s instructions (Catalogue Number: AS-MB-006-01/02). Isolated mRNA was chemically fragmented into 300-nucleotide-long fragments by incubation in fragmentation buffer (20 μL: 10 mM Zn2+, 10 mM Tris-HCl and pH 7.0) at 94°C for 5 min. The mRNA fragment length was detected by agarose gel electrophoresis after interruption. Two micrograms of anti-m6A rabbit polyclonal antibody (Synaptic Systems, 202003) was tumbled with fragmented mRNA (one tenth kept as an input control) in a 500 μl IP reaction system at 4°C for 2 h. Twenty microlitres of blocked Dynabeads T M M-280 Sheep Anti-Rabbit IgG (Thermo Fisher Scientific) was incubated with 0.5 mg/ml BSA at 4°C for 2 h, followed by three washes with 1×IP buffer (10 mM Tris-HCl, pH 7.4, 150 mM NaCl, 0.1% NP-40) and two washes with 1×wash buffer (10 mM Tris-HCl at pH 7.4, 50 mM NaCl, 0.1% NP-40). The mRNA fragments immunoprecipitated with m6A-antibody were eluted from the Dynabeads in 200 μl elution buffer (10 mM Tris-HCl, pH 7.4, 1 mM EDTA, 0.05% SDS, 40 U proteinase K) at 50°C for 30 min. RNA-seq libraries of both m6A-enriched RNAs and input mRNAs were successfully constructed by the KAPA Stranded mRNA-seq Kit (Illumina) in the following steps: strand cDNA synthesis; strand cDNA synthesis; A-tailing; adapter ligation; PCR amplification; and library purification. Finally, the quality of the completed libraries was tested by an Agilent 2100 Bioanalyzer. The libraries were denatured and diluted to a loading volume of a loading concentration. Clustered libraries generated on the Illumina cBot using NovaSeq 6000 S4 Reagent Kit (300 cycles) were loaded onto reagent cartridges and forwarded to sequencing run on an Illumina NovaSeq 6000 system by Aksomics (Shanghai, China).
RNA-seq
In this study, ten of fourteen male mice were randomly divided into the hepatic IR group and the sham group (five mice per group). Briefly, total RNA in liver tissues was isolated using TRIzol reagent (Ambion). RNA samples were checked for quality by agarose gel electrophoresis and quantified with a Nanodrop ND-1000 spectrophotometer. mRNA was extracted from 2 μg of total RNA with the NEBNext® Poly(A) mRNA Magnetic Isolation Module (Cat#E7490L, New England Biolabs, Hertfordshire, UK). The RNA-seq libraries were constructed with the KAPA Stranded RNA-Seq Library Prep Kit (Illumina, CA, USA). Libraries were sequenced using Illumina HiSeq 4000 platforms.
Methylated RNA immunoprecipitation (MeRIP)-Qpcr
MeRIP-qPCR (Ensembl GRCm38) was used to quantify the levels of the m6A modification on individual transcripts. In brief, RNA was isolated and chemically shredded into fragments by using an Arraystar Seq-StarTM poly (A) RNA Isolation Kit (AS-MB-006-01/02), and a portion of the RNA sample was saved as the input control. Affinity-purified anti-m6A rabbit polyclonal antibody (Synaptic Systems, 202003) or DynabeadsTM M-280 Sheep Anti-Rabbit IgG (Invitrogen, 11203D) was added to a tube containing magnetic beads and the remainder of the RNA sample, followed by RNase inhibitor at 4°C overnight. The beads were washed with 300 µl IP buffer (10 mM Tris-HCl, pH 7.4, 150 mM NaCl, 0.1% NP-40) three times, twice with wash buffer (50 mM NaCl, 100 mM Tris-HCl, pH 7.4 and 0.1% NP-40), once with elution buffer (100 mM Tris-HCl, pH 7.4, 1 mM EDTA and 0.05% SDS), 4 µl proteinase and 2 µl RNase inhibitor. The supernatant of the lysate and IP samples were placed in a mixture of phenol, chloroform and isoamyl alcohol. Next, the supernatant RNA was labelled supernatant, and the IP RNA was labelled MeRIP. Finally, mRNA was extracted by the phenol‒chloroform method and analysed by qRT‒PCR. The qRT‒PCR procedure was performed as follows: holding initially at 94°C for 4 minutes, followed by 40 cycles of 94°C for 15 seconds (denaturation) and 58°C for 45 seconds (annealing and extension). Each qRT‒PCR was repeated three times with three biological replicates. Quantification of mRNA from MeRIP was performed via the 2−ΔΔCt method against nonimmunoprecipitated input mRNA. The primer sequences for MeRIP are presented in .
Table 1. Primer sequences for real-time quantitative PCR.
Data analysis
All data were expressed as mean ± SD. Statistical analyses were performed by one-way ANOVA, with a Bonferroni correction for multiple comparisons. Two-tailed Student’s t test was used to analyse the differences between two groups. P values<0.05 were considered as statistically significant. Quality control of raw MeRIP-seq data was performed with FastQC (v0.11.7) according to Q30 standards. The 3’ adaptors were trimmed, and the low-quality reads were removed by using cutadapt software (Trimmomatic V0.32). Clean reads were aligned to the reference genome sequences and then used to produce bedGraph files by using HISAT2 v2.1.0. The m6A methylation sites (peaks) of each sample and the differentially methylated peaks (fold change cut-off of≥1.5 and p value≤0.05) of the compared groups were identified using exomePeak (v2.13.2). The identified peaks were annotated in accordance with the Ensembl database. Differentially expressed genes (fold change≥1.5, p value≤0.05) were screened by using the RNA-seq data (the corresponding MeRIP-seq input library data).
Gene Ontology (GO) functional enrichment analysis and Kyoto Encyclopedia of Genes and Genomes (KEGG) pathway analysis of differentially methylated protein-coding genes and differentially expressed genes were performed using Fisher’s exact test method and ClueGO in combination with the Database of Annotation, Visualization and Integrated Discovery. The ontology covers three domains based on the enrichment score: biological process (BP), cellular component (CC) and molecular function (MF). The p value indicates a significant correlation between the GO/KEGG pathway term and the differentially expressed genes.
For further details of the experimental materials and procedures, please see the Supplementary files.
Results
Levels of RNA m6A modification and evaluation of hepatic IRI
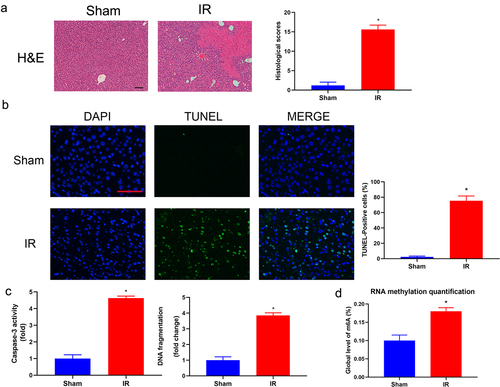
The hepatic IR procedure dramatically increased ischaemia‒reperfusion-induced liver injury compared with that in the sham group. We successfully established a mouse liver model of hepatic ischaemia‒reperfusion injury, which was characterized by the serum levels of AST, ALT, and inflammatory cytokines; H&E staining; and TUNEL assays of liver specimens. After the IRI procedure, the levels of serum ALT, AST, TNF-α, IL-6 and MIP-2 were significantly increased in the hepatic IR group (). H&E staining showed extensive cell necrosis with nuclear condensation and nuclear fragmentation in IRI liver samples, which never appeared in the sham group. The liver injury scores in the IR group were significantly higher than the liver injury scores in the sham group (). Meanwhile, the levels of hepatic cell apoptosis and necrosis were detected by TUNEL assay, caspase-3 activity assay and DNA fragmentation ELISA. As shown in , a significant hepatic cell apoptosis rate was induced by hepatic IRI. No TUNEL-positive cells were detected in the sham group, and hepatic IR induced a percentage of TUNEL-positive cells of 68.76% ± 11.21%. Mean caspase-3 activity and DNA fragmentation showed a significantly higher fold increase in the IR groups (). Finally, we conducted an EpiQuik m6A RNA methylation quantitative assay to detect m6A modifications and revealed that the RNA m6A levels were obviously increased in the IR group compared with the sham group ().
Figure 1. Changes in the serum aminotransferase levels and inflammatory cytokine production in hepatic IR injury. (a) Serum ALT and AST levels were detected by an automatic analyser during the sham and IR processes. (b) the proinflammatory cytokines (TNF, IL-6 and MIP-2) were measured using an ELISA kit. The results are expressed as the mean ± SD of 5 animals per group. *Significant difference from the sham group, P < 0.05.
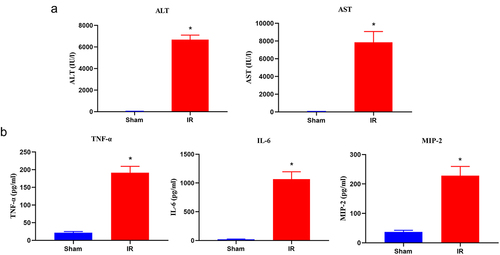
Figure 2. Histopathological changes and m6A level of total RNA in hepatic IRI. (a) Representative photographs (100×) of H&E-stained liver sections were taken from the mice subjected to the sham and IR processes, and histopathological scoring of hepatic injury was performed. Scale bar: 200 μm. (b) Representative photographs (200×) of liver sections stained by TUNEL were taken from the mice subjected to the sham and IR processes, and TUNEL-positive cells were counted as described in the Materials and Methods. Scale bar: 25 μm. (c) DNA fragmentation and the activity of caspase 3 in the liver tissues were measured by ELISA (n = 5). (d) Hepatic IR injury significantly upregulated the total RNA of m6A in liver tissues. Data are shown as the mean ± SD of 5 animals per group. *Significant difference from the sham group, P < 0.05.
Landscape of m6A methylation in hepatic IRI in mice
MeRIP-seq analysis of mRNA derived from mouse livers (five mice per group) showed that, in the sham group, there were 16,917 m6A peaks within 4098 coding gene transcripts (mRNAs) in five biological replicates, while in the hepatic IR group, there were 21,557 m6A peaks within 5322 coding gene transcripts (mRNAs) in five replicates. Additionally, there were 3778 overlapping m6A coding gene transcripts and 1916 overlapping m6A modification genes in both groups (). There were 909 differentially expressed m6A peaks, 863 differentially methylated transcripts and 516 differentially m6A modification genes determined in both groups. Furthermore, the significantly differentially expressed mRNAs were divided into upregulated (fold change≥1.5, p value≤0.05) and downregulated (fold change≤0.667, p value≤0.05) m6A peaks. There were 212 upregulated m6A peaks within 117 mRNAs and 50 downregulated m6A peaks within 27 mRNAs (). The top 10 up- and downregulated m6A peak sites within mRNAs with the highest fold change values are listed in Supplementary Table S1.
Figure 3. Overview of N6-methyladenosine methylation within mRnas in the hepatic IR and sham groups. (a) Venn diagrams showing m6A methylation-related transcripts (a) and m6A methylation-related genes (b) between IR and sham group. (b) Volcano plots showing the significantly differential m6A peaks in the hepatic IR group compared with the sham group (fold changes≥1.5 and p ≤ 0.05). (c) Metagene plots showing the accumulation of the region of average m6A peaks across the length of mRNA transcripts. (d) Pie charts showing the differentially methylated m6A peaks between the IR and sham groups. (e) Sequence logo showing the top motifs enriched across m6A peaks. (f) the relative occupancy of differentially methylated m6A peaks in mouse chromosomes.
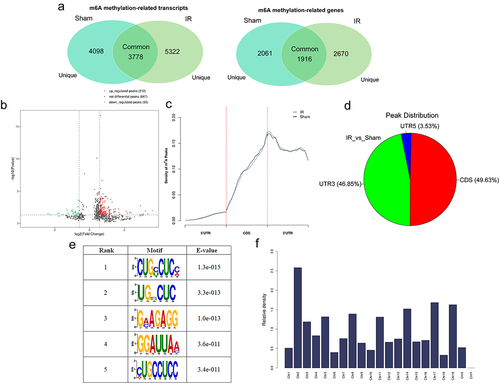
We found that m6A peaks of mRNAs were highly clustered in the coding sequence (CDS) and 3‘UTR near the stop codon, with some in the 5‘UTR in the IR and sham groups (). Furthermore, in the hepatic IR group vs. the sham group, the distribution of m6A peaks was also especially enriched in the CDS (49.63%) and 3‘UTR (46.85%) ().
In this study, multiple similar m6A motifs were identified in the samples (). These analysed results supported the m6A RRACH consensus sequence, which further confirmed the authenticity and accuracy of the transcriptome-wide m6A-seq data [Citation23].
Differentially methylated m6A sites within mRNA were mapped to chromosomes to evaluate their distribution profiles. Methylated m6A peaks were identified on all chromosomes (except chrY), and the top five chromosomes harbouring the most differentially methylated m6A sites were chr2, chr17, chr19, chr14 and chr8 ().
Differentially methylated RNAs are involved in important biological processes and pathways
To uncover the significant potential functions and biological pathways of m6A modifications in mouse models of hepatic IRI, altered m6A peaks in mRNAs were subjected to GO enrichment analysis and KEGG pathway analysis. For the genes with upmethylated m6A sites, regarding biological processes, the significantly enriched terms were related to metabolic process, regulation of chromatin organization, cellular metabolic process and negative regulation of cellular process. Regarding cellular components, the significantly enriched terms were intracellular membrane-bound organelle, cytoplasm, nucleus and intracellular organelle. Regarding molecular functions, the significantly enriched terms were protein binding, enzyme binding, transcription corepressor binding and ion binding (). For the genes with downmethylated m6A sites, regarding biological processes, the significantly enriched terms were regulation of gene expression, regulation of nitrogen compound metabolic process, regulation of cellular metabolic process, regulation of metabolic process and response to endoplasmic reticulum stress. Regarding cellular components, the significantly enriched terms were intracellular anatomical structure, intracellular membrane-bound organelle and nucleus. Regarding molecular functions, the significantly enriched terms were nucleic acid binding and RNA binding ().
Figure 4. GO and KEGG analyses of coding genes with modulated m6A peaks in the hepatic IR vs. sham groups. (a) the top ten significant GO enrichment terms for the upmethylated genes. (b) the top ten significant GO enrichment terms for the downmethylated genes. (c) the top ten enrichment scores of the enrichment pathway for the upmethylated genes. (d) the top ten enrichment scores of the significant enrichment pathway for the downmethylated genes.
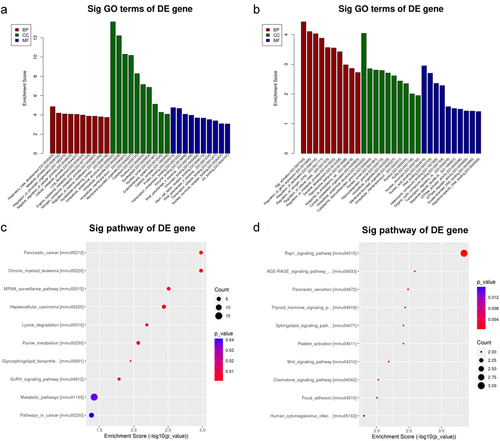
KEGG pathways were obtained based on the enrichment score principle. According to the enrichment score, the top ten pathways with the highest enrichment score (-log10 (p value)) in the compared groups were listed and ranked. For the genes with upmethylated m6A sites, the significantly enriched terms were the mRNA surveillance pathway, purine metabolism and metabolic pathways (). For the genes with downmethylated m6A sites, the significantly enriched terms were the Rap1 signalling pathway, sphingolipid signalling pathway, platelet activation, Wnt signalling pathway, chemokine signalling pathway and focal adhesion ().
Conjoint analysis of MeRIP-seq and RNA-seq data
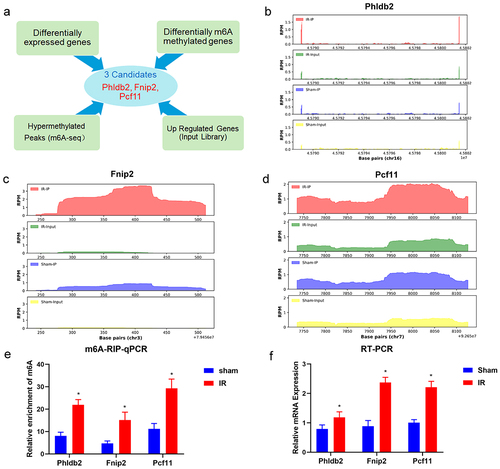
In this study, we employed RNA-seq (MeRIP-seq input library) to quantify the expression level of samples and to explore differences in altered genes in the transcriptome profiles. Significantly differentially expressed genes (fold change≥1.5 and p ≤ 0.05) between the hepatic IR and sham groups were identified using a volcano plot (). Hierarchical clustering was performed to show distinguishable gene expression patterns between the two groups (). Compared with the sham group, 402 genes were differentially expressed in the hepatic IR group, including 276 upregulated genes (log2FC ≥ 0.585 and p ≤ 0.05) and 126 downregulated genes (log2FC ≤ −0.585 and p ≤ 0.05). The coding potential assessment tool was used to evaluate whether a new transcript had coding capabilities by using a logistic regression model (.) Based on the conjoint analysis of the MeRIP-seq and RNA-seq data, all differentially methylated m6A peaks with differential mRNA expression levels were divided into four groups: 189 hypermethylated m6A peaks in mRNAs, in which 109 were significantly upregulated (hyperup) and 80 were downregulated (hyperdown), and 28 hypomethylated m6A peaks in mRNAs, in which 22 were significantly upregulated (hypo-up) and 6 were downregulated (hypo-down) (). The top 20 differentially expressed genes are listed in Supplementary Table S2. Additionally, the GO and KEGG pathways associated with the differentially expressed genes are displayed in Supplementary Figure S1A-S1D. Then, three hypermethylated and upregulated genes (Phldb2, Fnip2, and Pcf11) were detected at the intersection of differentially expressed genes (fold change≥1.5, p value≤0.05) and significantly differentially m6A methylated genes (fold change≥1.5, p value≤0.05) (). The m6A abundance and location on the chromosomes of these genes are shown in . MeRIP – qPCR was conducted for m6A hypomethylated genes, including Phldb2, Fnip2, and Pcf11, which showed increased m6A modification levels (). Next, the differences in the expression levels of the three mRNAs between the hepatic IR and sham groups were significantly amplified by qRT‒PCR (). The m6A modification and mRNA expression levels confirmed were consistent with the high-throughput sequencing data.
Figure 5. Analysis of RNA-sequencing data of hepatic IRI in mice. (a) Volcano plots showing differentially expressed genes in hepatic IR groups compared with sham groups (log2FC ≥ 0.585/log2FC ≤ −0.585 and p ≤ 0.05). (b) Heatmap plots showing the differentially expressed genes in the hepatic IR and sham groups. (c) Three-dimensions scatter graph showing the predicted new transcripts by coding potential assessing tool. (d) Four-quadrant graph exhibiting the distribution of mRnas with significant alterations in both m6A-modified level and corresponding mRNA expression between the IR and sham groups (|log2 FC| > 1.5, p < 0.05).
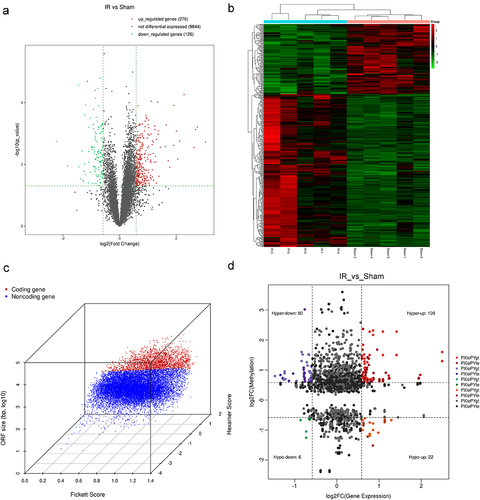
Figure 6. Analysis of differential mRnas with differentially methylated m6A peaks. (a) Screening strategy of m6A-regulated target genes (Phldb2, Fnip2, and Pcf11). (b-d) the m6A abundances on mRNA transcripts and location of the chromosome as detected were plotted by MeRIP-seq. (e) MeRIP-Qpcr validation of m6A-regulated genes (Phldb2, Fnip2, and Pcf11) between the IR and sham groups. (f) the mRNA levels of Phldb2, Fnip2, and Pcf11 by real-time qRT‒PCR. *p < 0.05. Data are shown as the mean ± SD of three independent experiments performed in triplicate.
The m6A-regulated gene deficiency regulates hepatic IRI in vitro
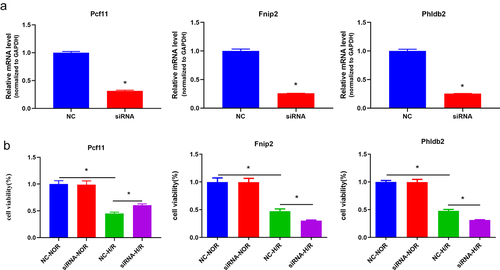
We hypothesized that m6A-regulated genes (Fnip2, Phldb2, and Pcf11) might regulate hepatic IRI in vitro. To clarify this issue, we used the loss-of-function approach in mouse primary hepatocytes that underwent H/R treatment. The knockdown of Fnip2, Phldb2, and Pcf11 at the RNA level in mouse primary hepatocytes was induced by administration of a small interfering RNA (siRNA) (). The results of the CCK-8 assays demonstrated that silencing of Fnip2 and Phldb2 significantly caused varying degrees of decrease in cell viability; in contrast, Pcf11 had the opposite effect on cell viability (). Obtained results revealed that Phldb2, Fnip2 and Pcf11 were the potential m6A-regulated target genes for further investigation.
Figure 7. The m6A-regulated genes (Fnip2, Phldb2, and Pcf11) deficiency regulates hepatic IRI in vitro. (a) Qrt-PCR analysis showed a decreased expression of m6A-regulated genes in the mouse primary hepatocytes. *p < 0.05. (b) Cell viability was detected with CCK8 assay. *p < 0.05. Data are shown as the mean ± SD of three independent experiments performed in triplicate.
Discussion
Hepatic IRI is an intractable scientific problem that urgently needs to be solved, and its aetiology is complex and involves many crucial biological processes, such as oxidative stress, inflammation and apoptosis. Severe hepatic injury is the outcome of inflammatory processes, liver cell death by apoptosis and oxidative damage through the induction of oxidative stress. RNA m6A methylation, the best-characterized internal RNA modification, plays important regulatory roles in the stabilization and translation of mRNA and the occurrence and development of myocardial, brain, and renal ischaemia reperfusion injury [Citation16,Citation24]. The regulatory mechanisms and biological functions of m6A methylation are increasingly being understood. The physiological functions of m6A methylation are determined by regulators (writers, erasers, and readers) in posttranscriptional gene expression regulation. The dynamic m6A base modifications with special emphasis on central roles were mainly in growth, development, metabolism, protein catabolism and translation [Citation25]. A previous study showed that METTL3-mediated m6A plays important roles in hepatic lipid and glucose metabolism [Citation26]. Evidence is emerging that the overexpression of FTO alleviates hepatic IR-mediated oxidative stress and mitochondrial fragmentation through its m6A demethylase activity, affecting the initiation of cap-independent translation [Citation27]. Recent studies have demonstrated that m6A modification can promote mRNA translation and enhance the export of mRNA from the nucleus to the cytoplasm in acute liver injury [Citation28]. IGF2BP and YTHDF1, as m6A readers, can enhance protein synthesis and mRNA translation through interactions with initiation factors in the regulation of posttranscriptional genes and cancer-related pathophysiological processes [Citation29,Citation30]. METTL14 stimulated the translation of DDB2 transcripts and increased DDB2 protein levels, thereby suppressing the growth and invasion of UVB-induced skin tumours [Citation31,Citation32]. Hepatic m6A methylation provides a new perspective for the regulation of gene expression through posttranscriptional fine-tuning in hepatic IRI. However, to date, the distribution of m6A modifications at the transcriptome-wide level in hepatic IRI remains incompletely understood [Citation33–40].
In this study, we performed high-throughput sequencing on hepatic IR mouse models to evaluate the m6A methylation status. Mapping studies suggested that mRNA m6A peaks were enriched mainly in the CDS and 3‘UTR, and the consensus sites for m6A were revealed by bioinformatics analysis of m6A localization, which could have a profound effect on mRNA localization, mRNA stability, translation regulation and protein expression. We identified 256 differentially methylated m6A peaks in mRNAs through comprehensive analyses of MeRIP-seq data. Among these peaks, 206 peaks were significantly upregulated and 50 were downregulated in the hepatic IR group vs. the sham group.
Moreover, many differentially methylated mRNAs were predicted and analysed using the enrichment of Gene Ontology and KEGG pathways. GO analysis showed that genes with downregulated m6A modification were associated mainly with metabolism-related processes, such as metabolic process, cellular metabolic process, organic substance metabolic process, nitrogen compound metabolic process and regulation of metabolic process.
KEGG analysis showed that genes with upregulated m6A modification were associated with metabolic pathways, purine metabolism and mRNA surveillance pathways. IRI has been proven to alter hepatic functions mainly through changes in metabolic pathways, including energy, lipid, glucose, and amino acid metabolism; inflammation; and oxidative stress [Citation41]. High-energy purine compounds, as representative contributing factors through the IRI procedure, continually decrease in purine metabolism pathways [Citation42]. The genes with downregulated m6A modification were associated with the Rap1 signalling pathway and Wnt signalling pathway. Rap1 may promote the neutrophil inflammatory response and regulate nuclear factor-κB (NF-κB)-dependent signalling to induce hepatic IRI [Citation43]. The Wnt signalling pathway is affected by the cell redox balance, which attenuates hepatic IRI [Citation44].
In our study, we revealed the roles of m6A methylation modification in metabolism-related processes, aiming to show the biological functions of targeting m6A in regulating hepatic metabolism. Surprisingly, upregulated genes were mainly enriched in purine metabolism and metabolic pathways; downregulated genes were mainly involved in cellular metabolic processes, organic substance metabolic processes, nitrogen compound metabolic processes and regulation of metabolic processes. Alterations in m6A methylation modification are critical to the development of different metabolic processes.
Hepatic IRI is an intractable scientific problem that urgently needs to be solved, and its aetiology is complex and involves many crucial biological processes, such as oxidative stress, inflammation and apoptosis. Severe hepatic injury is the outcome of inflammatory processes, liver cell death by apoptosis and oxidative damage through the induction of oxidative stress. We used the online tool KEGG to screen and identify differentially expressed genes involved in oxidative stress, inflammation and apoptosis from MeRIP-seq data. Then, we performed functional and pathway enrichment based on differentially expressed genes and KEGG pathways in MeRIP-seq data (Supplementary Figure S2A, S2B). The enrichment analysis of GO and KEGG pathways showed that oxidative stress, inflammation and apoptosis were mainly mediated by the PPAR/PI3K-AKT/IL-17/RAP-1/HIF-1 signalling pathways. Therefore, the key genes of these pathways could be considered as potential therapeutic interventions for hepatic IRI.
According to the comprehensive further analysis of the correlation between differentially m6A-methylated genes and differentially expressed mRNAs, Fnip2, Phldb2 and Pcf11 in both MeRIP-seq and RNA-seq were filtered out as the overlapping predicted target genes. At the cellular level, the loss-of-function studies demonstrate that the three genes play a critical role in regulation the pathophysiological processes of hepatic IRI.
Folliculin (FLCN) is a tumour suppressor protein mutated in BirtHogg – Dubé syndrome, and folliculin-interacting proteins (Fnip) 2 and Fnip1 are homologous binding partners of FLCN, forming a complex that is not only connected to B-cell development and autophagy via GABARAP and the induction of apoptosis following DNA base mispairing but also influences both AMP-activated protein kinase (AMPK) and mechanistic target of rapamycin complex (mTORC)1 [Citation45,Citation46]. Previous studies have shown that key proteins can ameliorate hepatic ischaemia reperfusion injury, which might be connected with the modulation of AMPK/mTOR signalling complex-mediated autophagy and apoptosis [Citation47,Citation48]. Pleckstrin homology-like domain family member (Phldb) 2 (also known as LL5β) is a filamin-binding protein that can control microtubule-dependent focal adhesion disassembly and its involvement in the regulation of the PI3K signalling pathway as an effector [Citation49,Citation50].
The protein encoded by the Phldb2 gene is a microtubule transcription termination and rate of transcription reinitiation homing factor, which has an extremely positive effect on cell migration and invasion [Citation51,Citation52]. Inhibiting apoptosis and activating the PI3K/Akt pathway can alleviate hepatic ischaemia reperfusion injury. Termination factor cleavage and Pcf11 modulate gene expression on the basis of different sizes. Downregulation of Pcf11 can result in the suppression of the expression of short genes. Pcf11 can also regulate the expression of genes with large introns through intronic polyadenylation sites in cells [Citation53]. The three target genes were enriched in the mRNA surveillance pathway and mTOR signalling pathway, which might lay a solid foundation for the in-depth study of the mechanism of m6A in hepatic ischaemia‒reperfusion injury.
The m6A methylation is considered the most common and abundant type of internal posttranscriptional RNA modification and plays crucial roles in mRNA metabolism and the pathogenesis of many kinds of diseases, including cancers. In addition, previous studies indicated that m6A inhibitors, as a new avenue for anticancer therapeutic strategies, were designed as nanomolar small molecules with cell permeability and could selectively impair the activity of the enzymes responsible for RNA modification [Citation54–56]. The Dac51, as a potent FTO inhibitor, significantly suppressed tumour growth, dampened the glycolytic capacity and improved anti-tumour immunity in mouse models in vivo [Citation57]. The specific ALKBH5 inhibitor ALK-04 reduced the proliferation, invasion, and migration of cancer cells in the inhibitor-treated mice during immunotherapy [Citation58]. The m6A methylation levels affected hepatic IRI progression by regulating the expression of critical genes and signalling pathways. Therefore, the development of m6A inhibitors might provide an important new perspective for understanding HIRI and reveal new therapeutic strategies and targets.
Conclusions
In summary, our study revealed an m6A transcriptome-wide map of hepatic IRI by high-throughput sequencing, which revealed many genes with differentially methylated m6A peaks and synchronously differentially expressed genes. By conjoint analyses of MeRIP-seq and RNA-seq data, we explored the correlation of differentially methylated m6A peaks and differentially expressed mRNAs to point out the potential correlation between RNA m6A methylation and gene expression. In addition, three m6A-related target genes were further suggested to be associated with the progression of hepatic IRI. Therefore, m6A-related genes have become a potential biomarker and therapeutic target in hepatic IRI.
Author contributions
YH conceptualized and designed the study, drafted the initial manuscript, and reviewed and revised the manuscript. XL performed the experiments and helped to prepare the manuscript. BY, JH, CW, SL, SK, YX, BQ, ZF and HY collected data and carried out the initial analyses. YM conceptualized and designed the study, coordinated and supervised data collection, and critically reviewed the manuscript for important intellectual content.
Supplemental Material
Download Zip (18 MB)Acknowledgments
We gratefully thank our team for performing the experiment.
Disclosure statement
No potential conflict of interest was reported by the authors.
Data availability statement
The data used to support the findings of this study are available from the corresponding author upon request. MeRIP-seq and RNA-seq data that support the findings of this study have been deposited in the Gene Expression Omnibus (GEO) database (https://www.ncbi.nlm.nih.gov/geo/), accession codes GSE190216.
Supplementary material
Supplemental data for this article can be accessed online at https://doi.org/10.1080/15592294.2023.2201716
Additional information
Funding
References
- Chen S, Li Y, Zhi S, et al. WTAP promotes osteosarcoma tumorigenesis by repressing HMBOX1 expression in an m(6)A-dependent manner. Cell Death Amp Dis. 2020;11(8):659.
- Du J, Ji H, Ma S, et al., M6a regulator-mediated methylation modification patterns and characteristics of immunity and stemness in low-grade glioma. Briefings in bioinformatics 2021.
- Song Y, Wang Q, Li L. Comprehensive epigenetic analysis of m6A modification in the hippocampal injury of diabetic rats. 2020;12(20):1811–16.
- Wen J, Lv R, Ma H, et al. Zc3h13 regulates nuclear RNA m(6)A methylation and mouse embryonic stem cell self-renewal. Molecular Cell. 2018;69(6):1028–1038.e6.
- Deng S, Zhang H, Zhu K, et al. M6a2target: a comprehensive database for targets of m6A writers, erasers and readers. Brief Bioinform. 2021;22:3.
- Chen L, Wang P, Bahal R, et al. Ontogenic mRNA expression of RNA modification writers, erasers, and readers in mouse liver. PLoS ONE. 2019;14(12):e0227102.
- Lan T, Li H, Zhang D, et al. KIAA1429 contributes to liver cancer progression through N6-methyladenosine-dependent post-transcriptional modification of GATA3. Mol Cancer. 2019;18(1):186. Molecular cancer 2019. 10.1186/s12943-019-1106-z.
- Gu L, Wang L, Chen H, et al. CG14906 (mettl4) mediates m(6)A methylation of U2 snRNA in Drosophila. Cell Discov. 2020;6:44.
- Chen Y, Zhao Y, Chen J, et al. ALKBH5 suppresses malignancy of hepatocellular carcinoma via m(6)A-guided epigenetic inhibition of LYPD1. Mol Cancer: BioMed Central. 2020;Vol. 191:p. 123.
- Huang H, Weng H, Sun W, et al. Recognition of RNA N(6)-methyladenosine by IGF2BP proteins enhances mRNA stability and translation. Nat Cell Biol. 2018;20(3):285–295.
- Zaccara S, Jaffrey SR. A unified model for the function of YTHDF proteins in regulating m(6)A-Modified mRNA. Cell. 2020;181(7):1582–1595.e18.
- Li Y, Gu J, Xu F, et al., Molecular characterization, biological function, tumor microenvironment association and clinical significance of m6A regulators in lung adenocarcinoma. Briefings in bioinformatics 2020.
- Ye L, He S, Mao X, et al. Effect of hepatic macrophage polarization and apoptosis on liver ischemia and reperfusion injury during liver transplantation. Front Immunol. 2020;11:1193.
- Bi J, Zhang J, Ren Y, et al. Irisin alleviates liver ischemia-reperfusion injury by inhibiting excessive mitochondrial fission, promoting mitochondrial biogenesis and decreasing oxidative stress. Redox Biol. 2019;20:296–306.
- Jiménez-Castro MB, Cornide-Petronio ME, Gracia-Sancho J. Inflammasome-mediated inflammation in liver Ischemia-reperfusion injury. Cells. 2019;8:10.
- Yao W, Han X, Ge M, et al. N(6)-methyladenosine (m(6)A) methylation in ischemia-reperfusion injury. Cell Death Amp Dis. 2020;11(6):478.
- Zhang H, Shi X, Huang T, et al. Dynamic landscape and evolution of m6A methylation in human. Nucleic Acids Res. 2020;48(11):6251–6264.
- Shi H, Wei J, He C. Where, when, and how: context-dependent functions of RNA methylation writers, readers, and erasers. Molecular Cell. 2019;74(4):640–650.
- Wang D, Ma Y, Li Z, et al. The role of AKT1 and autophagy in the protective effect of hydrogen sulphide against hepatic ischemia/reperfusion injury in mice. Autophagy. 2012;8(6):954–962.
- Pan S, Liu L, Pan H, et al. Protective effects of hydroxytyrosol on liver ischemia/reperfusion injury in mice. Mol Nutr Food Res. 2013;57(7):1218–1227.
- Xu Y, Li Z, Lu S, et al. Integrative analysis of the roles of lncRnas and mRnas in itaconate-mediated protection against liver Ischemia-reperfusion injury in mice. 2021;14:4519–4536. DOI:10.2147/JIR.S327467.
- Wang C, Li Z, Zhao B. PGC-1α protects against hepatic Ischemia reperfusion injury by activating PPARα and PPARγ and regulating ROS production. 2021;2021:6677955. DOI:10.1155/2021/6677955.
- Wang C, Yu H, Lu S, et al. LncRNA Hnf4αos exacerbates liver ischemia/reperfusion injury in mice via Hnf4αos/Hnf4α duplex-mediated PGC1α suppression. Redox Biol. 2022;57:102498.
- Xu K, Mo Y, Li D, et al. N 6 -methyladenosine demethylases Alkbh5/Fto regulate cerebral ischemia-reperfusion injury. Ther Adv Chronic Dis. 2020;11:2040622320916024.
- Xu K, Sun Y, Sheng B, et al. Role of identified RNA N6-methyladenosine methylation in liver. Anal Biochem. 2019;578:45–50.
- Li Y, Zhang Q, Cui G, et al. M(6)a regulates liver metabolic disorders and hepatogenous diabetes. Genom Proteom Bioinformat. 2020;18(4):371–383.
- Du YD, Guo WY, Han CH, et al. N6-methyladenosine demethylase FTO impairs hepatic ischemia–reperfusion injury via inhibiting Drp1-mediated mitochondrial fragmentation. Cell Death Amp Dis. 2021;12(5):442.
- Huang Y, Chen S, Pang L, et al. Isovitexin protects against acute liver injury by targeting PTEN, PI3K and BiP via modification of m6A. Eur J Pharmacol. 2022;917:174749.
- Liu T, Wei Q, Jin J, et al. The m6A reader YTHDF1 promotes ovarian cancer progression via augmenting EIF3C translation. Nucleic Acids Res. 2020;48(7):3816–3831.
- He L, Li H, Wu A, et al. Functions of N6-methyladenosine and its role in cancer. Mol Cancer. 2019;18(1):176.
- Yang Z, Yang S, Cui Y-H. METTL14 facilitates global genome repair and suppresses skin tumorigenesis. Proc Nat Acad Sci. 2021;118:35.
- Luo Z, Zhang Z, Tai L, et al. Comprehensive analysis of differences of N(6)-methyladenosine RNA methylomes between high-fat-fed and normal mouse livers. Epigenomics. 2019;11(11):1267–1282.
- Fry NJ, Law BA, Ilkayeva OR, et al. N 6 -methyladenosine is required for the hypoxic stabilization of specific mRnas. RNA. 2017;23(9):1444–1455.
- Xu Y, Yuan XD, Wu JJ, et al. The N6-methyladenosine mRNA methylase METTL14 promotes renal ischemic reperfusion injury via suppressing YAP1. J Cell Biochem. 2020;121(1):524–533.
- Song H, Feng X, Zhang H. METTL3 and ALKBH5 oppositely regulate m 6 a modification of TFEB mRNA, which dictates the fate of hypoxia/reoxygenation-treated cardiomyocytes. Autophagy. 2019;15(8):1419–1437.
- Zhao W, Qi X, Liu L, et al. Epigenetic regulation of m(6)A modifications in human cancer. Mol Ther Nucl Acids. 2020;19:405–412.
- Wang LJ, Xue Y, Li H, et al. Wilms’ tumour 1-associating protein inhibits endothelial cell angiogenesis by m6A-dependent epigenetic silencing of desmoplakin in brain arteriovenous malformation. J Cell Mol Med. 2020;24(9):4981–4991.
- Chen Z, Zhao P, Li F, et al. Comprehensive review and assessment of computational methods for predicting RNA post-transcriptional modification sites from RNA sequences. Brief Bioinform. 2020;21(5):1676–1696.
- Wen K, Zhang Y, Li Y. Comprehensive analysis of transcriptome-wide m 6 a methylome in the anterior capsule of the lens of high myopia patients. Epigenetics. 2020;16:1–14.
- Zheng L, Tang X, Lu M, et al. MicroRNA-421-3p prevents inflammatory response in cerebral ischemia/reperfusion injury through targeting m6A reader YTHDF1 to inhibit p65 mRNA translation. Int Immunopharmacol. 2020;88:106937.
- Zuurbier CJ, Bertrand L, Beauloye CR, et al. Cardiac metabolism as a driver and therapeutic target of myocardial infarction. J Cell Mol Med. 2020;24(11):5937–5954.
- Tani T, Okamoto K, Fujiwara M, et al. Metabolomics analysis elucidates unique influences on purine/pyrimidine metabolism by xanthine oxidoreductase inhibitors in a rat model of renal ischemia-reperfusion injury. Mol Med (Cambridge, MA). 2019;25(1):40.
- Folch-Puy E, Panisello A, Oliva J, et al. Relevance of endoplasmic reticulum stress cell signaling in liver cold ischemia reperfusion injury. Int J Mol Sci. 2016;17:6.
- Han Z, Li Y, Yang B, et al. Agmatine attenuates liver ischemia reperfusion injury by activating Wnt/β-catenin signaling in mice. Transplantation. 2020;104(9):1906–1916.
- Hasumi H, Baba M, Hasumi Y, et al. Folliculin-interacting proteins Fnip1 and Fnip2 play critical roles in kidney tumor suppression in cooperation with Flcn. 2015;112(13):E1624–31.
- Siggs OM, Stockenhuber A, Deobagkar-Lele M, et al. Mutation of Fnip1 is associated with B-cell deficiency, cardiomyopathy, and elevated AMPK activity. 2016;113(26):E3706–15.
- Chen QS, Shen A, Dai JW, et al. IL37 overexpression inhibits autophagy and apoptosis induced by hepatic ischemia reperfusion injury via modulating AMPK/mTOR/ULLK1 signalling pathways. Life Sci. 2021;276:119424.
- Hasumi H, Baba M, Hong SB, et al. Identification and characterization of a novel folliculin-interacting protein FNIP2. Gene. 2008;415(1–2):60–67.
- Paranavitane V, Coadwell WJ, Eguinoa A, et al. Ll5beta is a phosphatidylinositol (3,4,5)-trisphosphate sensor that can bind the cytoskeletal adaptor, gamma-filamin. J Biol Chem. 2003;278(2):1328–1335.
- Dowd GC, Bhalla M, Kean B, et al. Role of host type IA phosphoinositide 3-kinase pathway components in invasin-mediated internalization of yersinia enterocolitica. Infect Immun. 2016;84(6):1826–1841.
- Lin ZY, Chuang WL. Genes responsible for the characteristics of primary cultured invasive phenotype hepatocellular carcinoma cells. Biomed Pharmacother = Biomed Pharmacother. 2012;66(6):454–458.
- Chen G, Zhou T, Li Y, et al. P53 target miR-29c-3p suppresses colon cancer cell invasion and migration through inhibition of PHLDB2. Biochem Biophys Res Commun. 2017;487(1):90–95.
- Wang R, Zheng D, Wei L, et al. Regulation of intronic polyadenylation by PCF11 impacts mRNA expression of long genes. Cell Rep. 2019;26(10):2766–2778.e6.
- Moroz-Omori EV, Huang D, Kumar Bedi R, et al. METTL3 inhibitors for epitranscriptomic modulation of cellular processes. ChemMedchem. 2021;16(19):3035–3043.
- Garbo S, Zwergel C, Battistelli C. M6a RNA methylation and beyond - the epigenetic machinery and potential treatment options. Drug Discovery Today. 2021;26(11):2559–2574.
- Yankova E, Blackaby W, Albertella M, et al. Small-molecule inhibition of METTL3 as a strategy against myeloid leukaemia. Nature. 2021;593(7860):597–601.
- Liu Y, Liang G, Xu H, et al. Tumors exploit FTO-mediated regulation of glycolytic metabolism to evade immune surveillance. Cell Metab. 2021;33(6):1221–1233.e11.
- Li N, Kang Y, Wang L, et al. ALKBH5 regulates anti-PD-1 therapy response by modulating lactate and suppressive immune cell accumulation in tumor microenvironment. 2020;117(33):20159–20170.